-
-
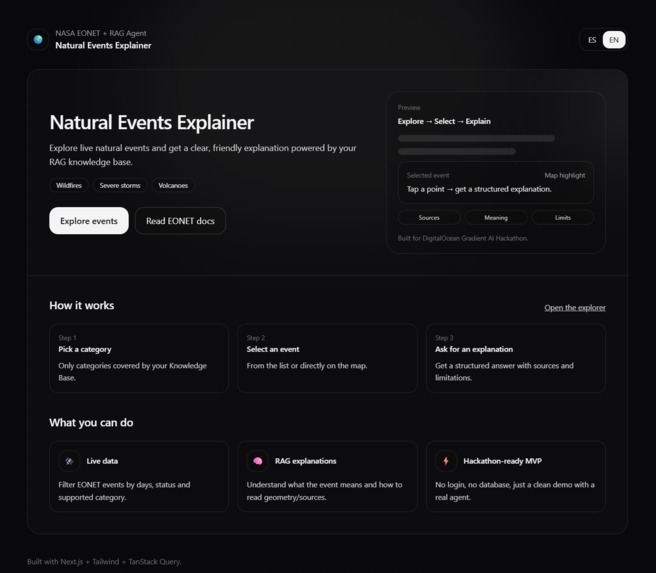
Home page
-
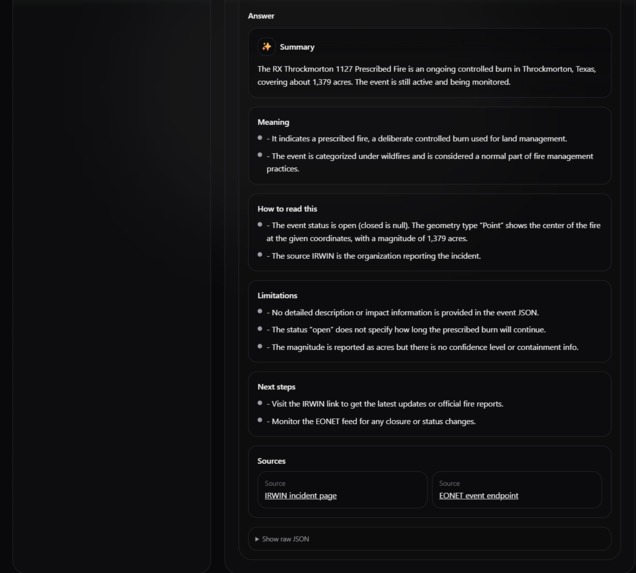
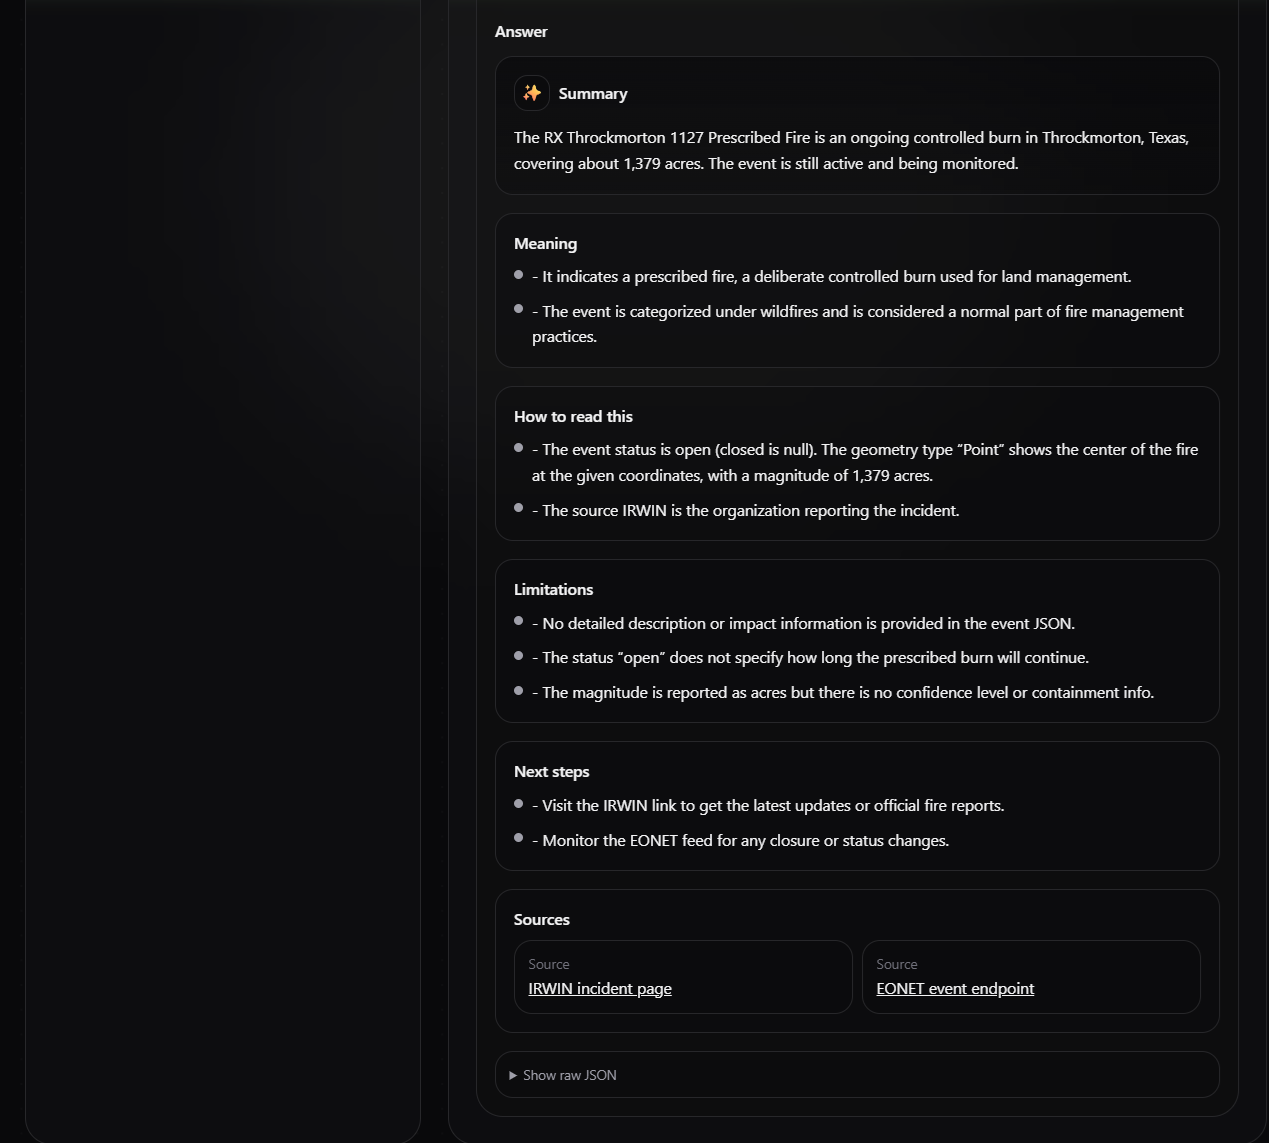
Rag answer section
-
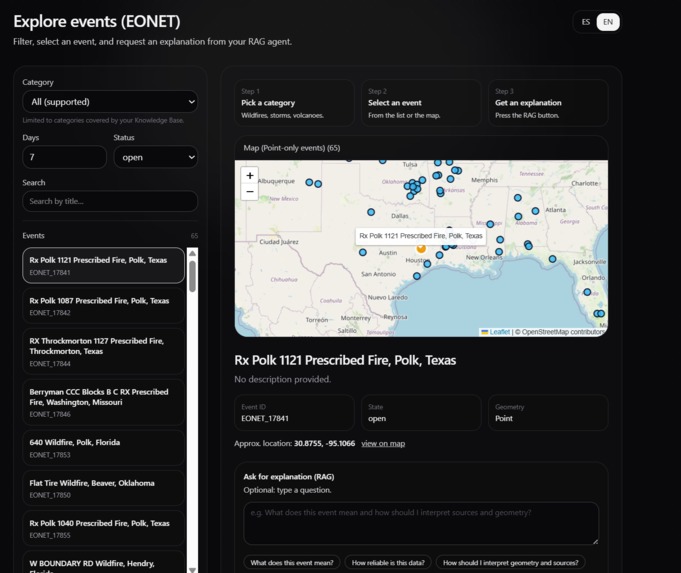
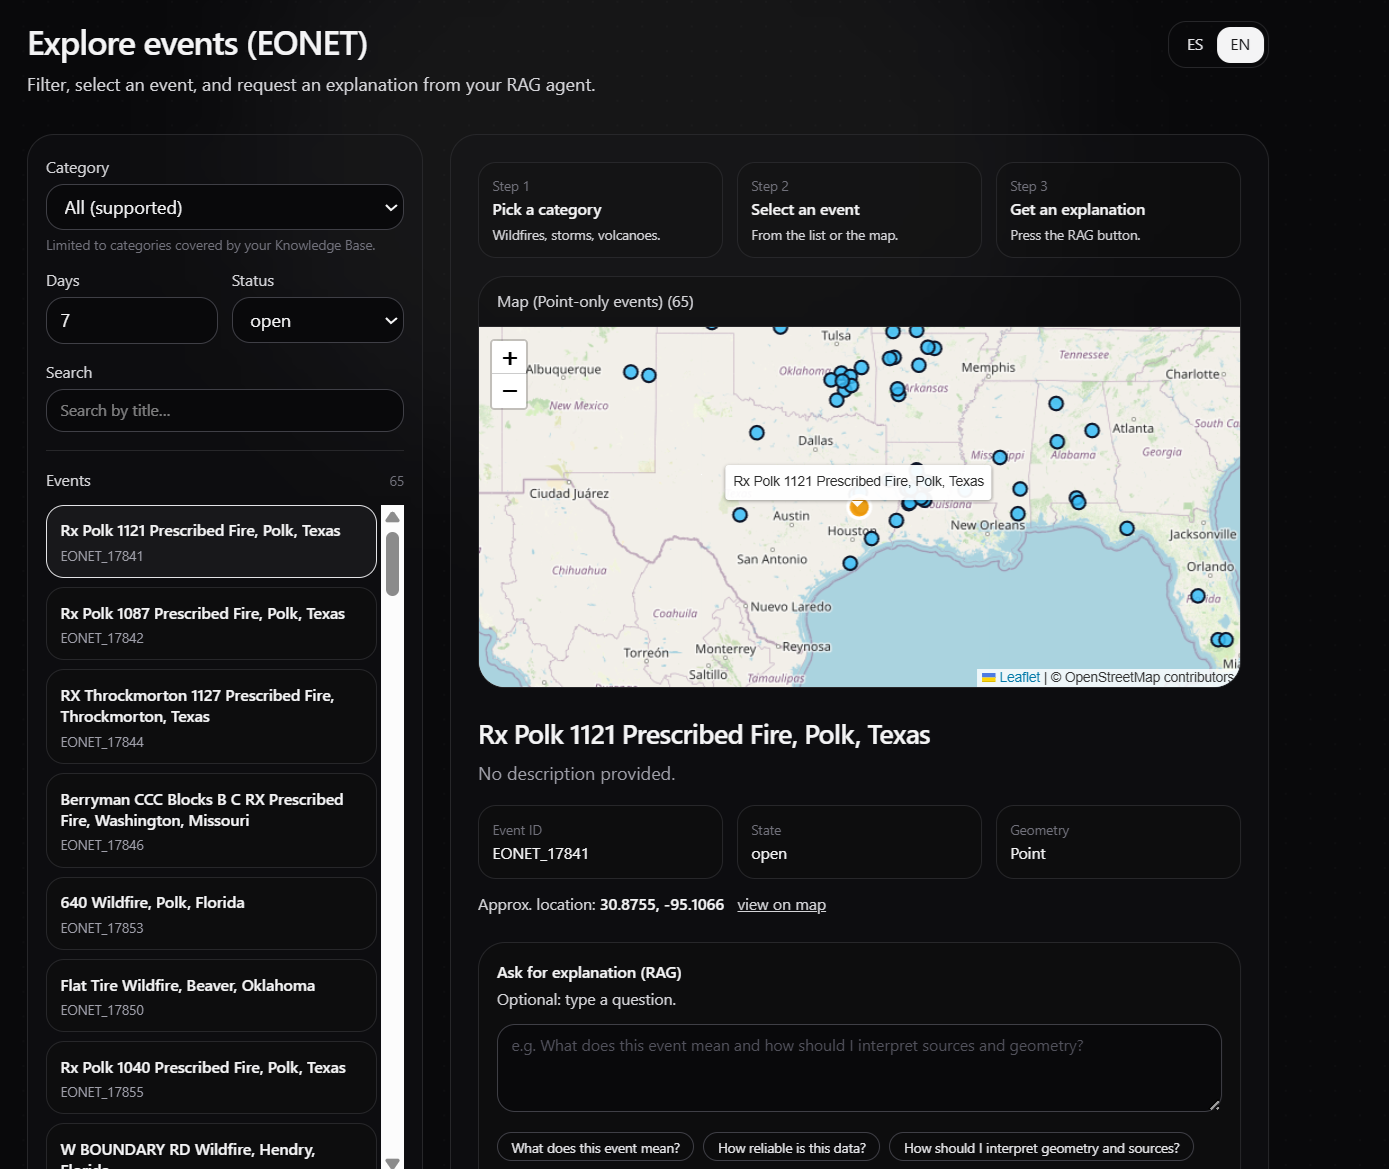
Map and Visualization page
Inspiration
When natural hazards happen, the data is often scattered, technical, and hard to interpret quickly—especially for non-experts. I wanted a simple experience where you can see events on a map and instantly get a plain-language explanation of what’s happening and what to monitor next.
What it does
Natural Events Explorer lets you browse live natural event data (wildfires, storms, volcanoes, and more) on an interactive map powered by NASA’s EONET feed. When you select an event, an AI Agent generates a clear explanation, key context, and practical guidance (e.g., what signals to watch, why it matters, and what to check next). The app also supports multiple languages via a quick toggle.
How I built it
Next.js (App Router) + TypeScript for a full-stack web app.
Leaflet for interactive mapping and geospatial visualization.
Internal API routes (/api/eonet/*) to fetch and normalize EONET data for the frontend.
An AI Agent endpoint (/api/agent/explain) integrated with DigitalOcean Gradient™ AI using:
DO_AGENT_ENDPOINT for the agent inference endpoint
DO_AGENT_ACCESS_KEY for authentication The agent receives event metadata (category, location, timeline, and relevant details) and returns a structured, user-friendly explanation.
Challenges I faced
Data normalization: EONET events can vary in structure, geometry types, and update patterns, so I had to normalize the data for a consistent map/UI experience.
Useful AI output: Getting answers that are clear, actionable, and not generic required careful prompt structure and well-scoped context.
UX clarity: Balancing map detail with readable explanations so users can understand events quickly without information overload.
What I learned
I learned that the best AI features feel “invisible”: they don’t replace the product—they amplify it. Combining reliable data sources with a focused agent and a clean UI creates a workflow that’s fast, understandable, and genuinely helpful.
What’s next
Advanced filters (time range, region, category) and saved views
Alerts/notifications for tracked events
Stronger grounding with additional trusted sources and basic response quality checks
Public deployment with a live demo link
Built With
- digitalocean
- i18n
- leaflet.js
- next.js
- react
- tanstack
- typescript

Log in or sign up for Devpost to join the conversation.