-

Final Map
-

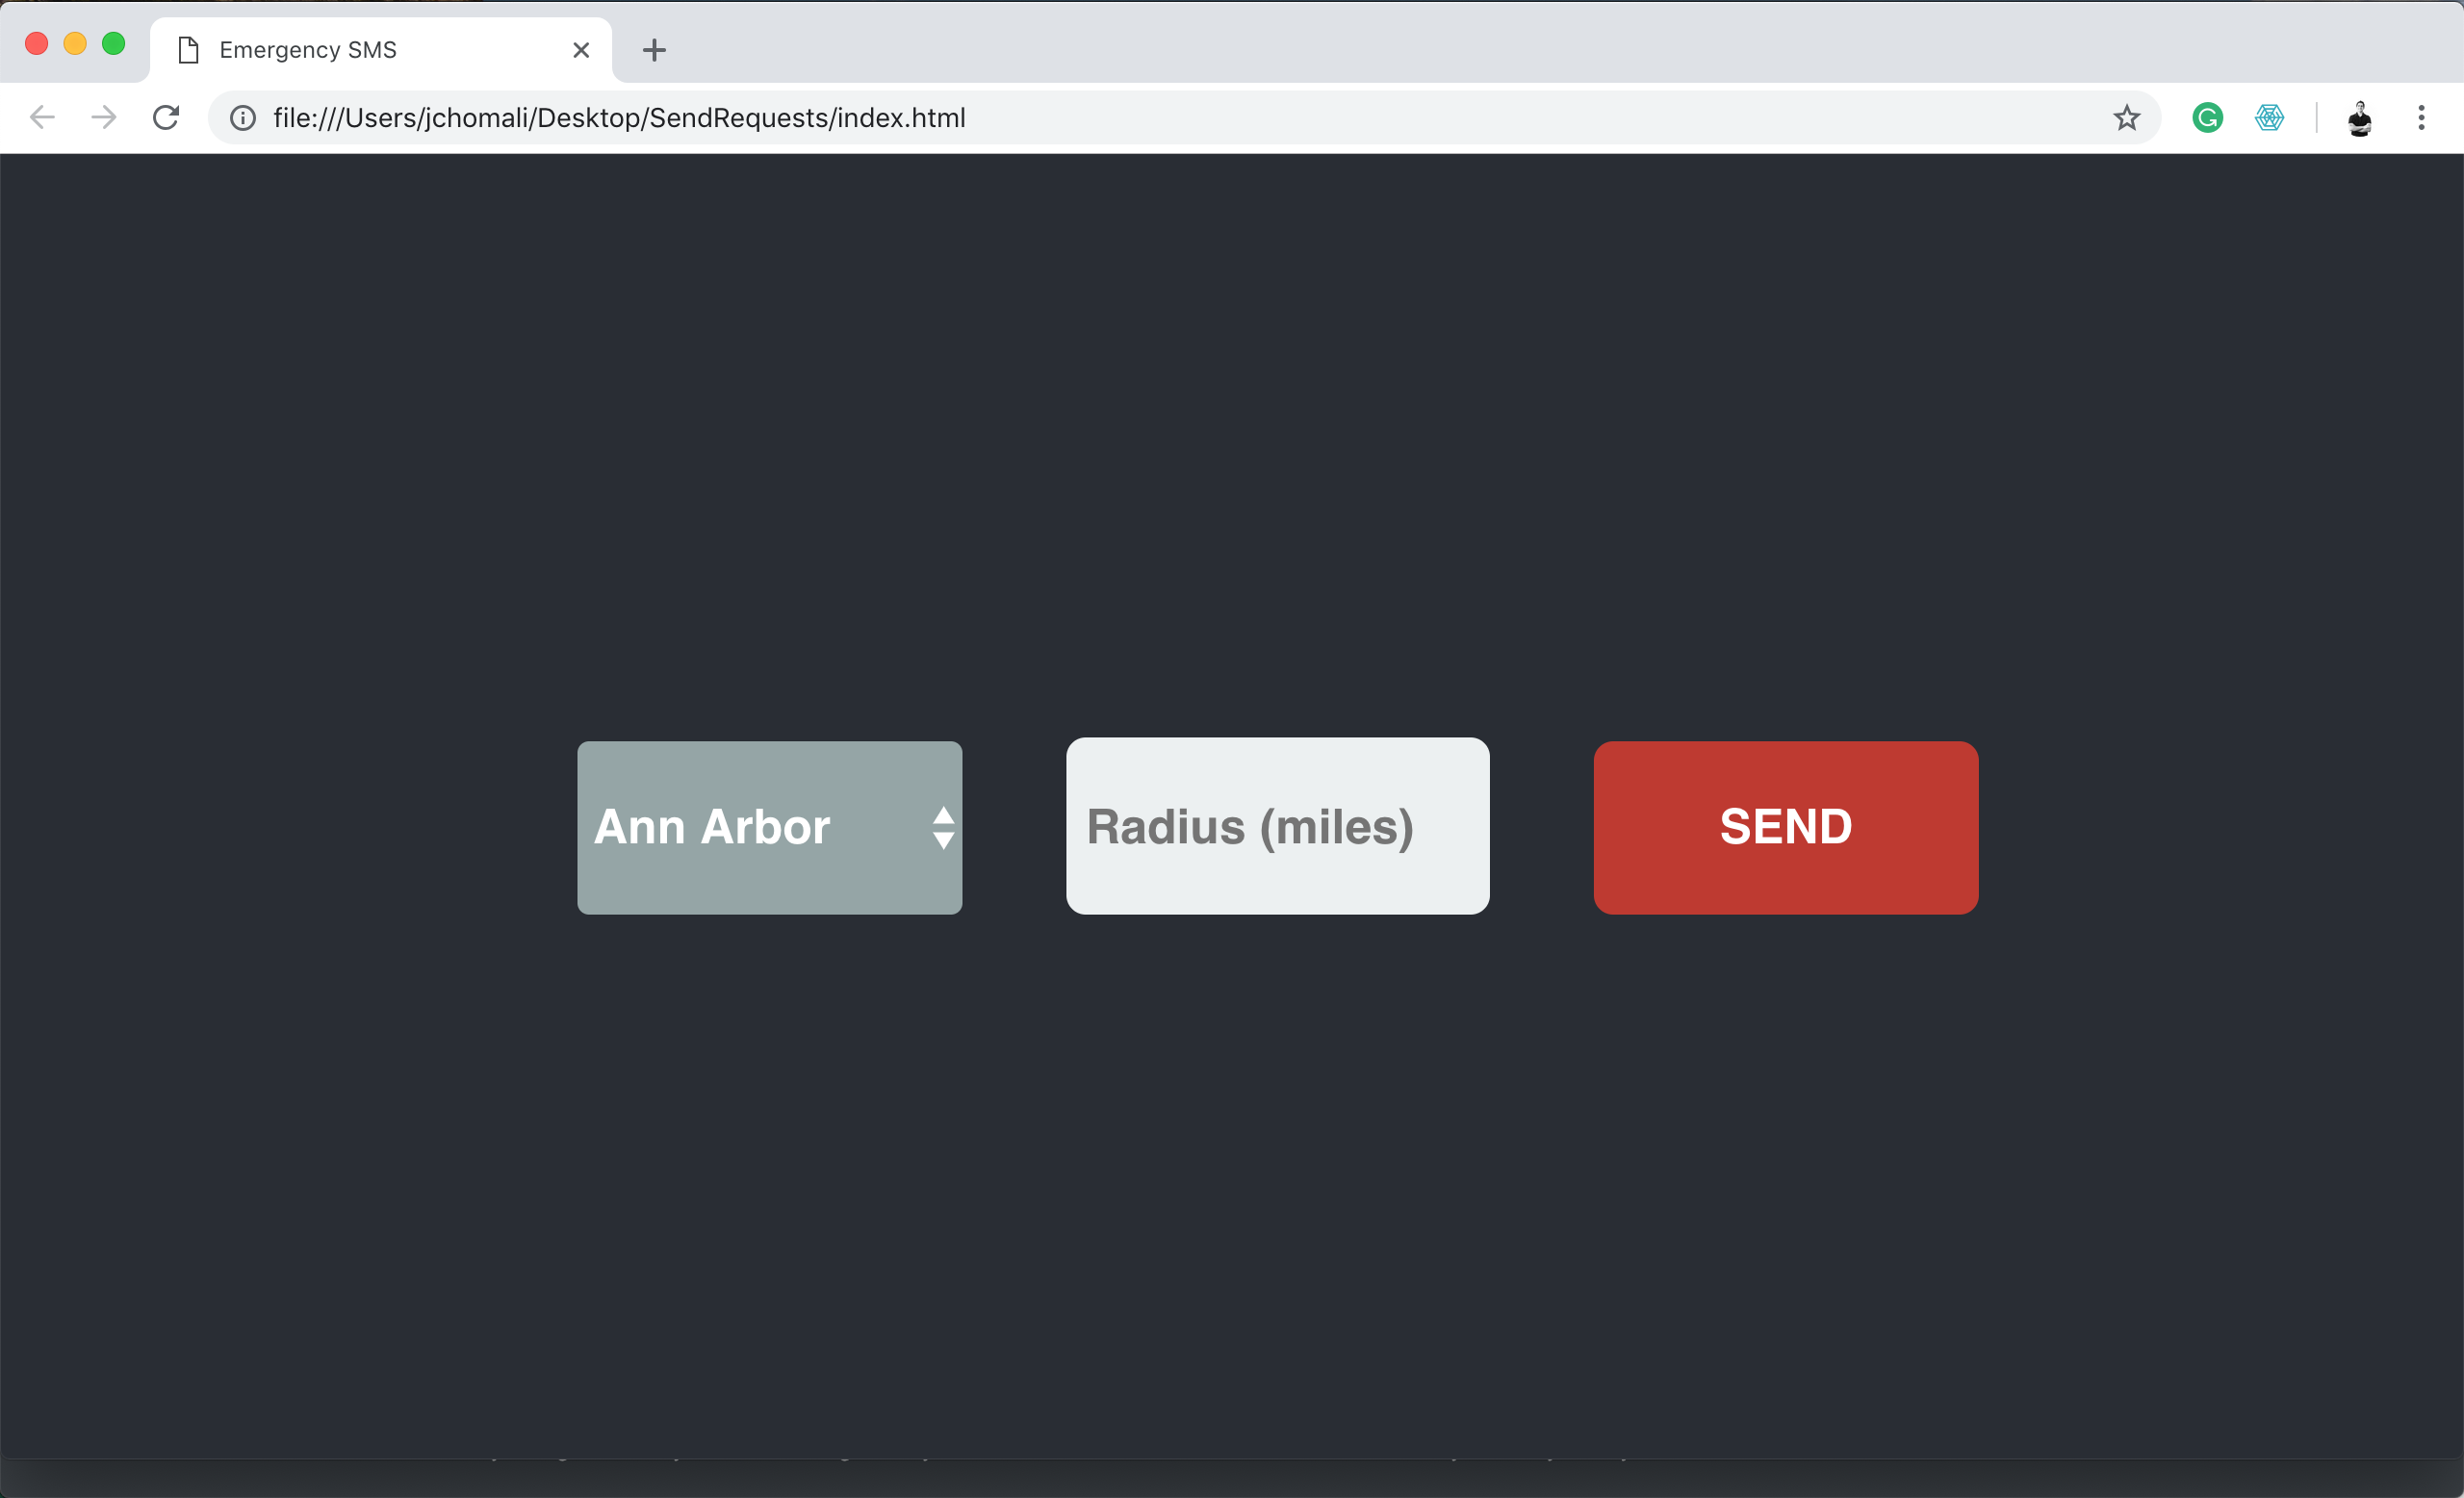
Send Initial SMS Simple Web
-

SMS Interaction


Inspiration
Looking to build a socially good project with a direct impact, we leaned towards natural disasters feedback especially that we realized that in case of natural disasters and despite the rapid spread of the event all over the news, which sometimes are even fake-ish; it is only after many days, effort and investment, that some information gets spread. We wanted a real-time damage feedback, especially for when quick actions are needed and figured the best way to have it is to directly get in contact with the people in the location of the disaster and request instant feedback. This could make more effective use of resources, time and access to real information in case of natural disasters.
What it does
In case of any natural disaster, an SMS can be sent to inhabitants in a geographical location close to the disaster by a certain radius determined by the user. The SMS includes an alert of the disaster and most importantly a request for feedback about the level of damage on a scale from 1 (least damage) to 5 (most damage) alongside the ZIP code of the area. The people responses are received and processed to visualize the damage on an interactive 3D map with different colors representing different levels of damage.
How it does
The project architecture is divided into three main layers:
1. Twilio: This is the main layer for communication with people. In the case of natural disasters SMS tend to have better coverage than other services, so we chose SMS as our main channel for communication. Through Twilio's REST API and native integration with MongoDB Stitch, we send the massive messages and also handle the responses from the inhabitants.
2. MongoDB: This is the connector and processor layer for our ecosystem. By using MongoDB stitch we handle Twilio responses and also send the requests for sending messages. Here we also process the data, check for the message responses to be correctly formatted and if that is the case, save the responses to a database by using a MongoDB cluster. The second part of MongoDB comes for the communication with the end-user application – the map. By using webhooks we communicate the MongoDB application with our frontend.
3. Kepler.gl: This is the frontend layer for communication with people. By using Uber's open source Kepler.GL we built an interactive map that connects to MongoDB by using the webhooks available in MongoDB HTTP services and display the data obtained from the people in an interactive way.
The interaction goes as follow:
- Through a simple web, the user segments the inhabitants and send the SMS by using Twilio services.
- The inhabitants respond to the message and Twilio handles the initial response.
- A MongoDB app is called through a webhook configured in Twilio.
- The MongoDB app processes the message response gets the location by using Google Geo-Coding API and stores the final and initial data into a database.
- A node.js web app makes a call to the MongoDB app to retrieve the stored locations vs damage data.
- The node.js app displays the data in an interactive 3D map by using Kepler.gl and Mapbox.
Challenges we ran into
The main challenges we ran into during our project were primarily outputting MongoDB in the correct formats and the absence of a fixed scale on Kepler.gl coloring system. On the one side, when using MongoDB we found that a lot of the objects were in types that were not compatible with our code and also that as MongoDB works asynchronously, we needed to do lots of things differently than usual. On the other side, as we were using Kepler.gl and continuously updating with new data, we wanted a fixed scale for our colors to put more into a real context the results, but as Kepler is still very new and unknown, this and many other things we wanted to do were still not available, so after a lot of experimenting and testing we came up with some workarounds for such problems.
Accomplishments that we're proud of
We're really proud to have addressed a social concern by coming up with the idea of real-time feedback about natural disaster and especially being able to deliver an accurate prototype in less than 36 hours which runs as we planned!
What's next for Harvey
Online update instead of just SMS.
More details on the help needed for specific zones.
Crossing data with other datasets for making some intelligence out of the map.
Built With
- css
- google-geocoding
- html
- javascript
- kepler.gl
- mongodb
- mongodbstitch
- node.js
- twilio

Log in or sign up for Devpost to join the conversation.