-
Demo
🌍 NASA Weather Prediction Tool
2025 NASA Space Apps Challenge: "Will It Rain On My Parade?"
A web-based climate prediction tool that forecasts temperatures and precipitation for any future date and location on Earth using 25 years of NASA satellite data.


🎯 The Problem
Traditional weather forecasts are limited to 10-14 days. But what if you're planning a wedding in 6 months, a hiking trip next summer, or need to schedule an outdoor event? You need long-range climate insights that go beyond standard forecasts.
💡 Our Solution
We built a statistical climate prediction tool that combines historical data analysis with climate trend detection to provide temperature and precipitation estimates for any future date and location. All math!
Key Features
- 🗺️ Interactive Map - Click anywhere on Earth to select your location
- 📅 Flexible Date Selection - Single date or date range predictions
- 📊 Visual Analytics - Historical data charts with trend lines
- 🌡️ Climate-Aware Predictions - Accounts for warming/cooling trends
- ⚡ Fast & Responsive - Runs entirely in your browser
- 🌧️ Rain Probability - Historical precipitation likelihood
🔬 How It Works
The Statistical Approach
When we started, we thought we'd just calculate historical averages. But the mentors at the hackathon told us that wouldn't account for climate change trends. We needed machine learning... but we less than a day and no ML experience. Normally we would attempt anyways, but we wanted to have a working project without having to worry about lacking knowledge.
Our solution: Use linear regression - a statistical method we already understood from CS coursework.
The Process
- Fetch NASA Data 🛰️
- Filter Historical Data 📆
- Calculate Statistics 📈
- Detect Climate Trends 🌡️
- Generate Prediction 🎯
6. Visualize Results 📊
🛠️ Technical Stack
Frontend
- Vanilla JavaScript - No frameworks, kept it simple and fast
- HTML5 & CSS3 - Responsive glassmorphism design
- Bootstrap 5.3 - Layout and responsive grid
APIs & Libraries
- NASA POWER API - 25 years of satellite climate data
- Leaflet.js - Interactive map with OpenStreetMap tiles
- Chart.js - Data visualization (line & histogram charts)
📖 Usage
Single Date Prediction
- Select a location by clicking on the map or dragging the marker
- Choose "Single date" mode from the dropdown
- Pick a date (any future date)
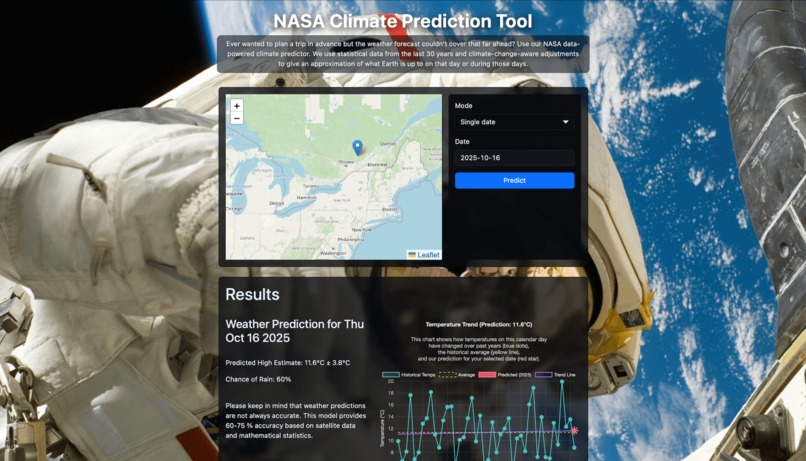
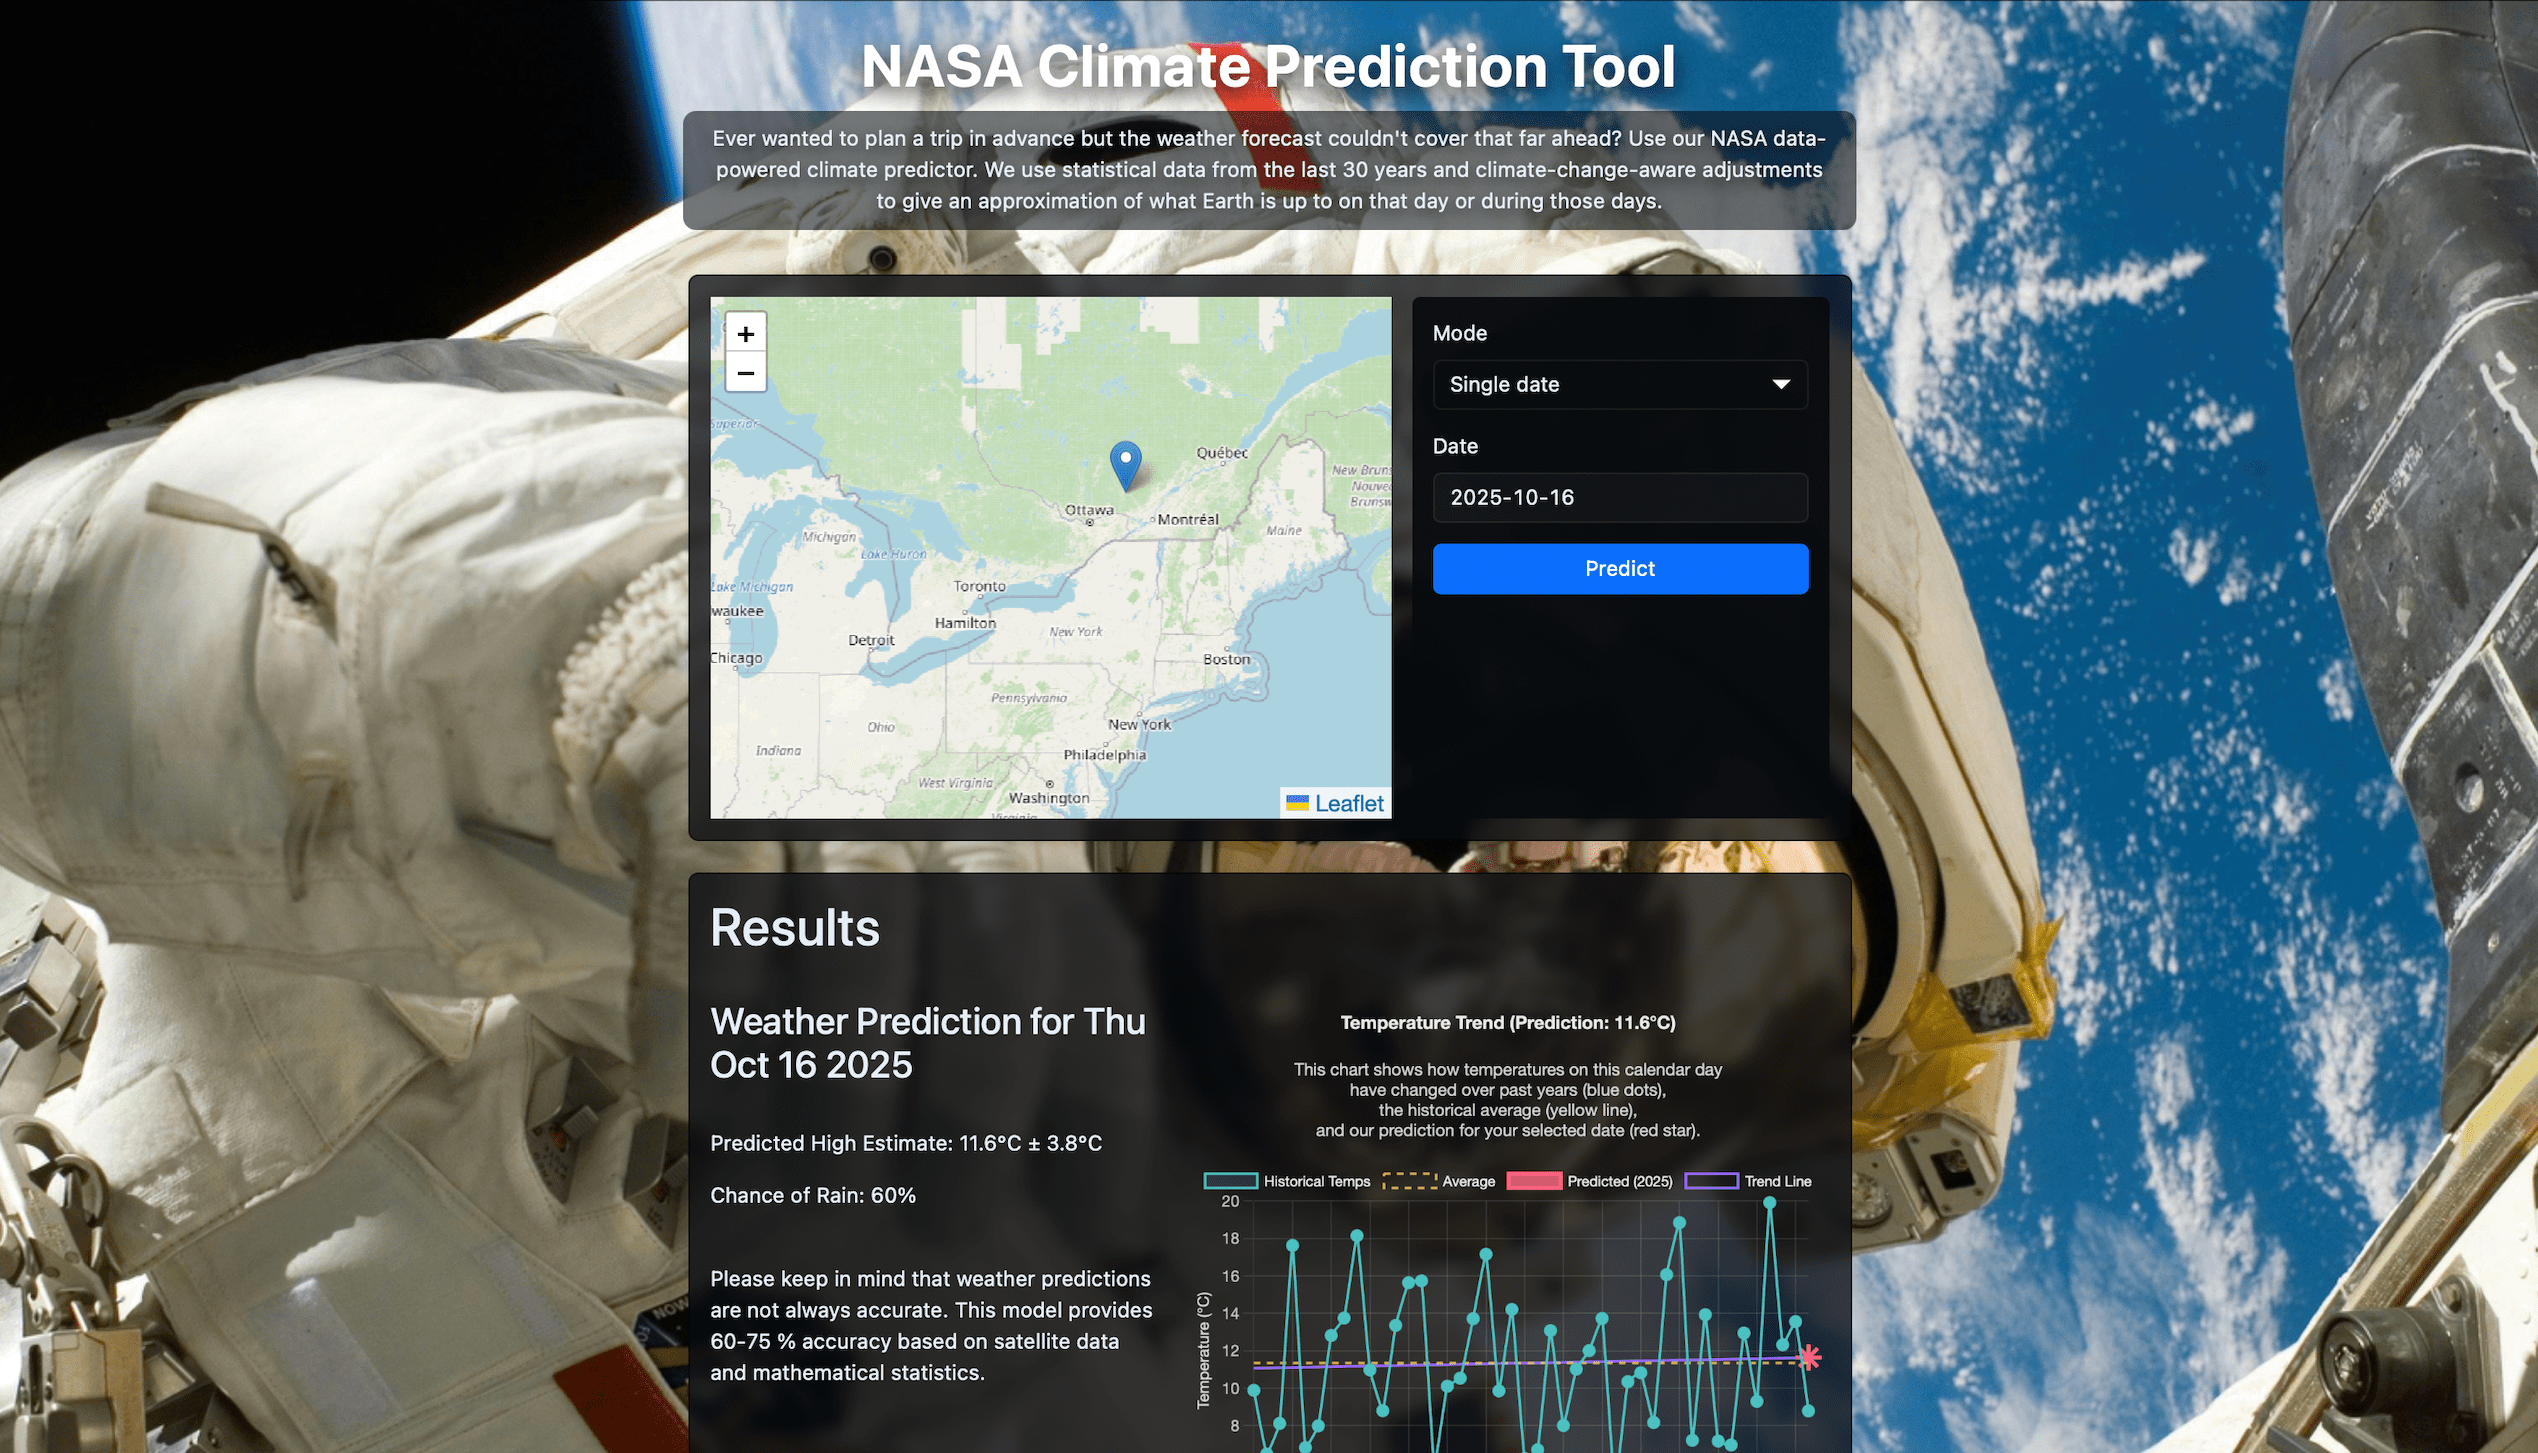
- Click "Predict" to see:
- Predicted temperature with confidence interval
- Rain probability based on historical data
- Chart showing historical temps and trend line
Date Range Prediction
- Select a location on the map
- Choose "Date range" mode
- Pick start and end dates (e.g., Oct 22 - Oct 31)
- Click "Predict" to see:
- Average temperature for that period
- Rain probability
- Temperature distribution histogram
📊 Example Results
Single Date: October 12, 2026 in Montreal
Predicted High: 15.8°C ± 3.6°C
Chance of Rain: 32%
Trend: +0.08°C per year (warming)
Date Range: October 22-31, 2026 in Montreal
Average High: 10.2°C
Chance of Rain: 35%
Data points: 250 (10 days × 25 years)
!!! Limitations
- Not a weather forecast - Predicts climate patterns, not specific weather
- Linear assumptions - Assumes trends continue linearly (climate is complex)
- No seasonal cycles - Doesn't model El Niño, La Niña, etc.
- Limited to 25 years - Dataset starts in 2000
- Data gaps - Some remote locations may have sparse data
🏆 Hackathon Journey
The Pivot
Initial Idea: Just calculate historical averages → Problem: Mentors told us this ignores climate change → Suggested: Use machine learning models → Reality Check: We had 48 hours and no ML experience → Solution: Statistical approach with OLS regression
Built for the 2025 NASA Space Apps Challenge


Log in or sign up for Devpost to join the conversation.