-
-
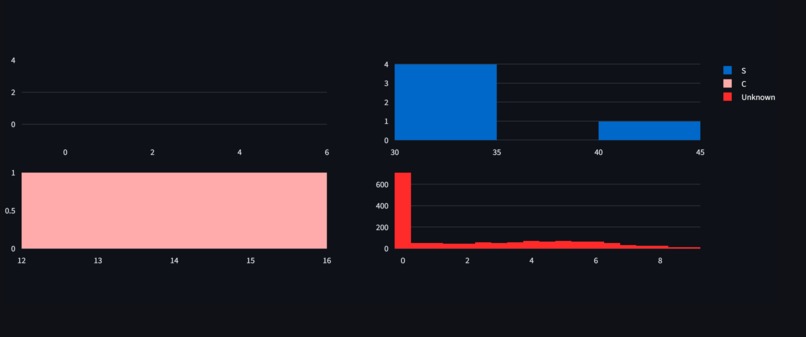
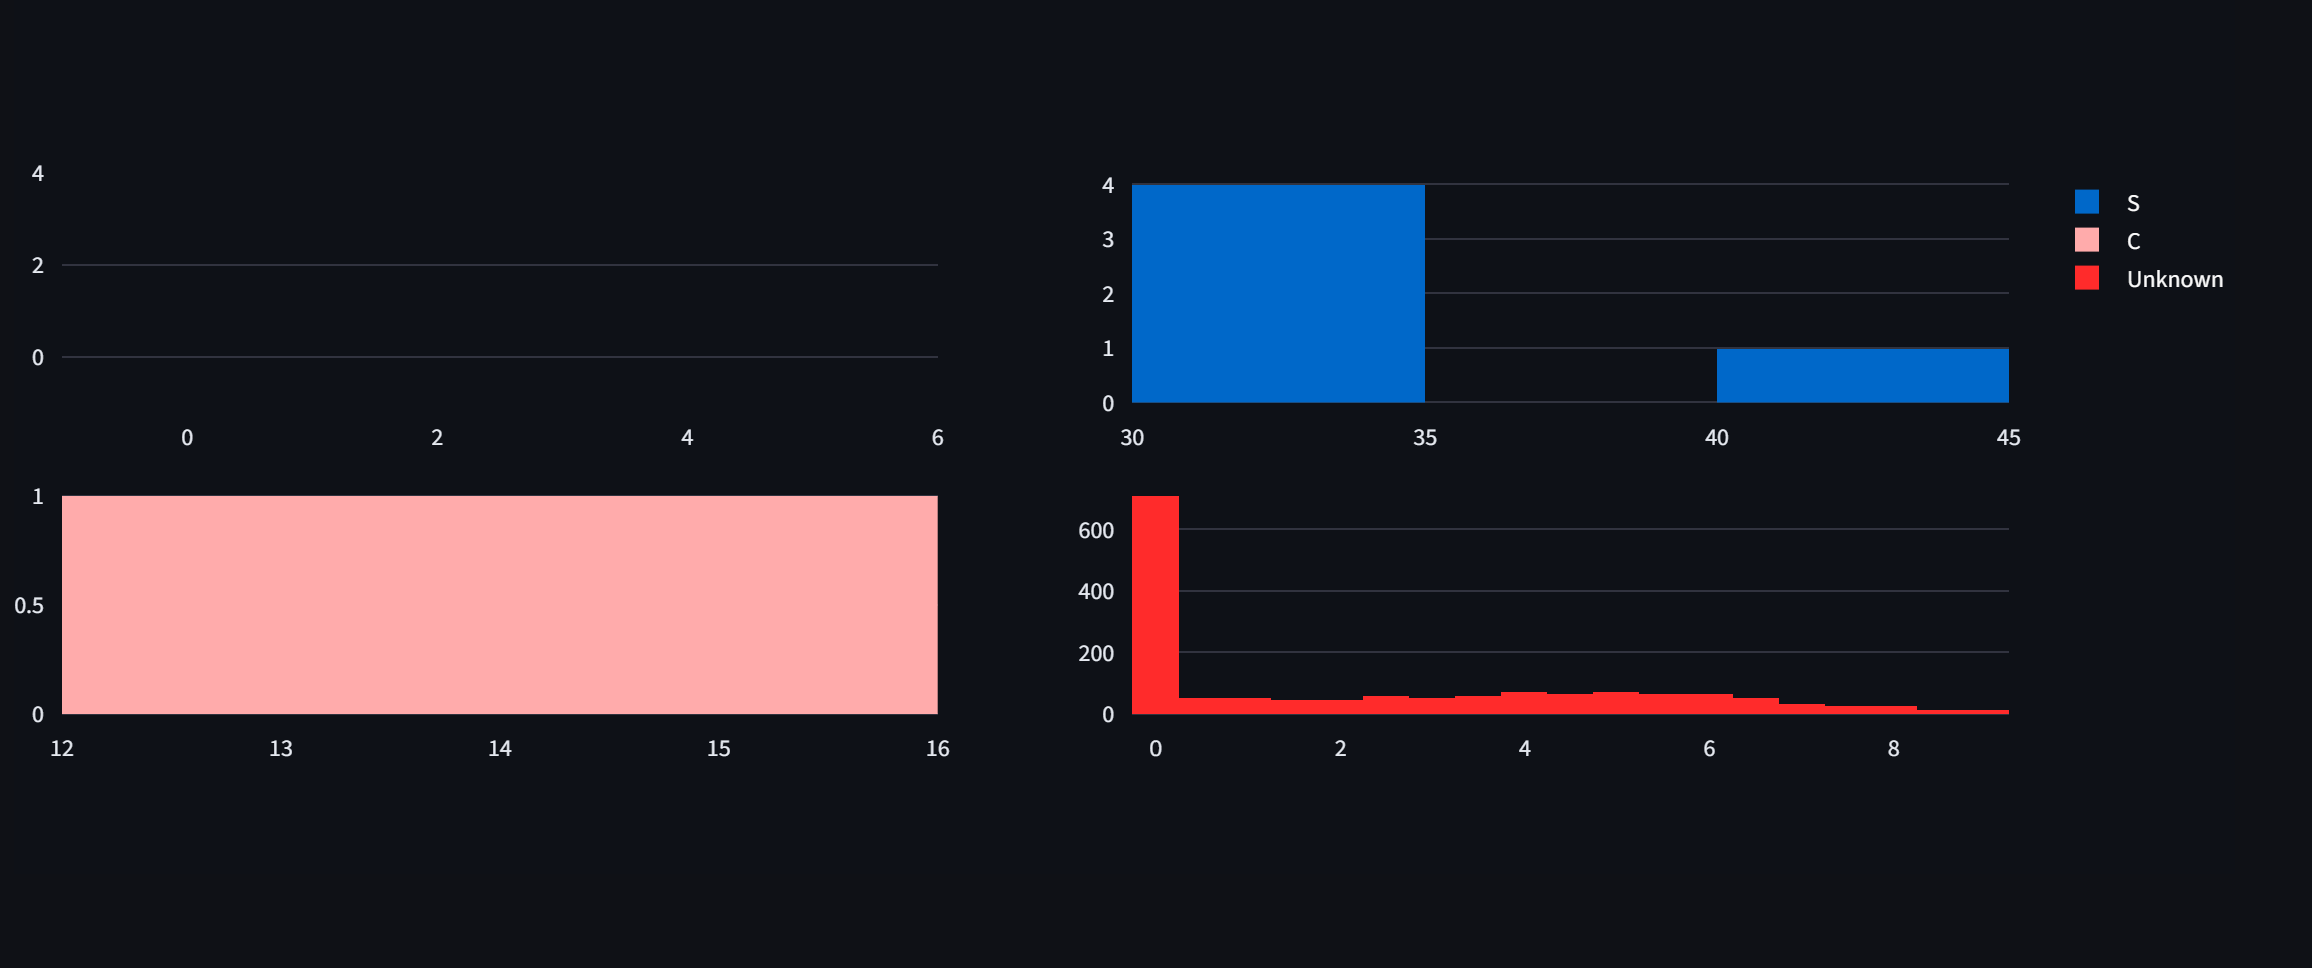
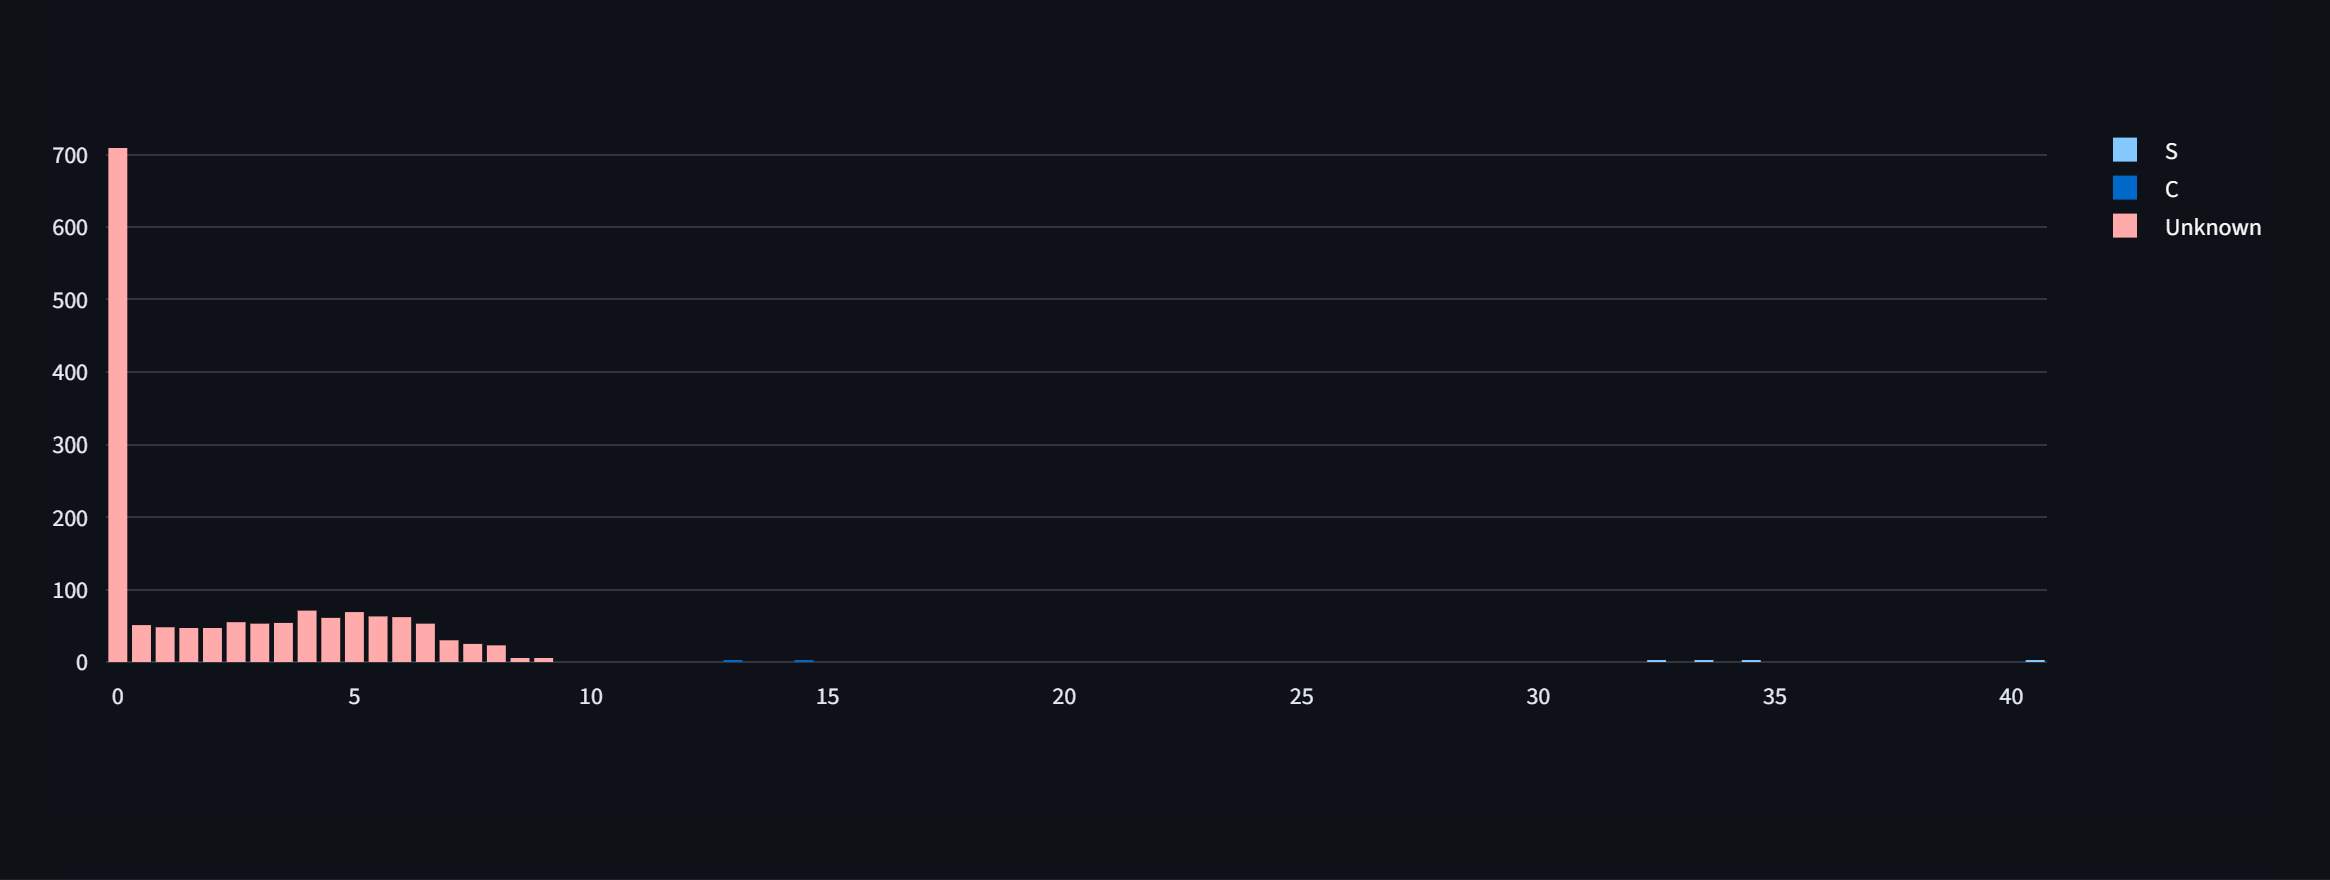
Another graph for how much astroids are there
-
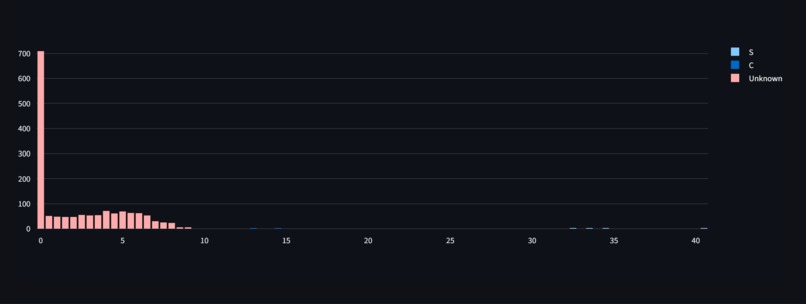
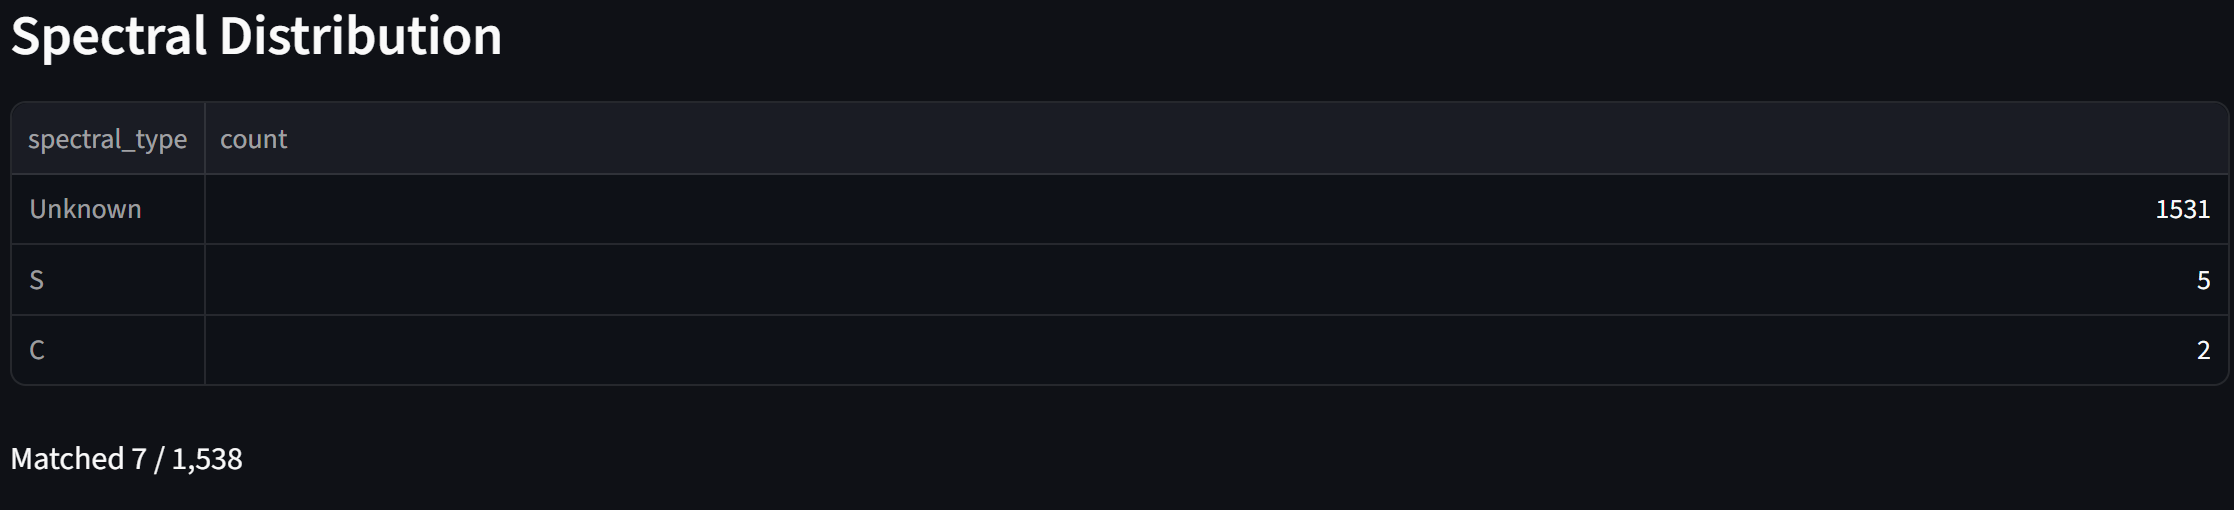
Data of how much of each type of astroids there are
-
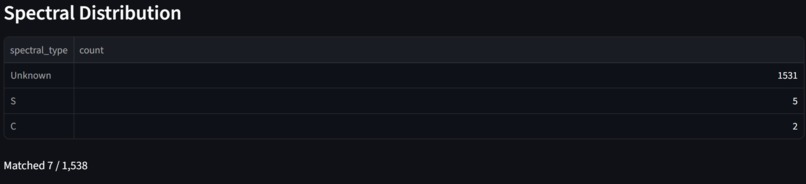
How much astroids are sorted based on data
-
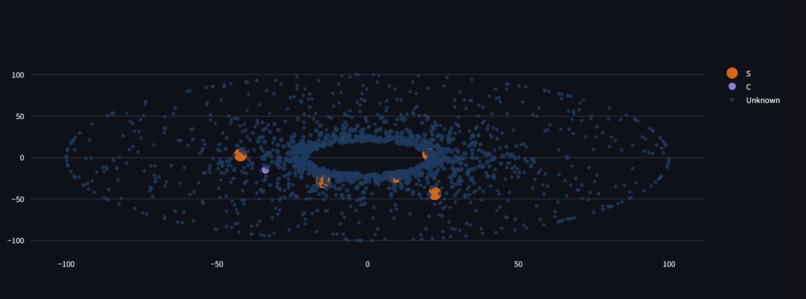
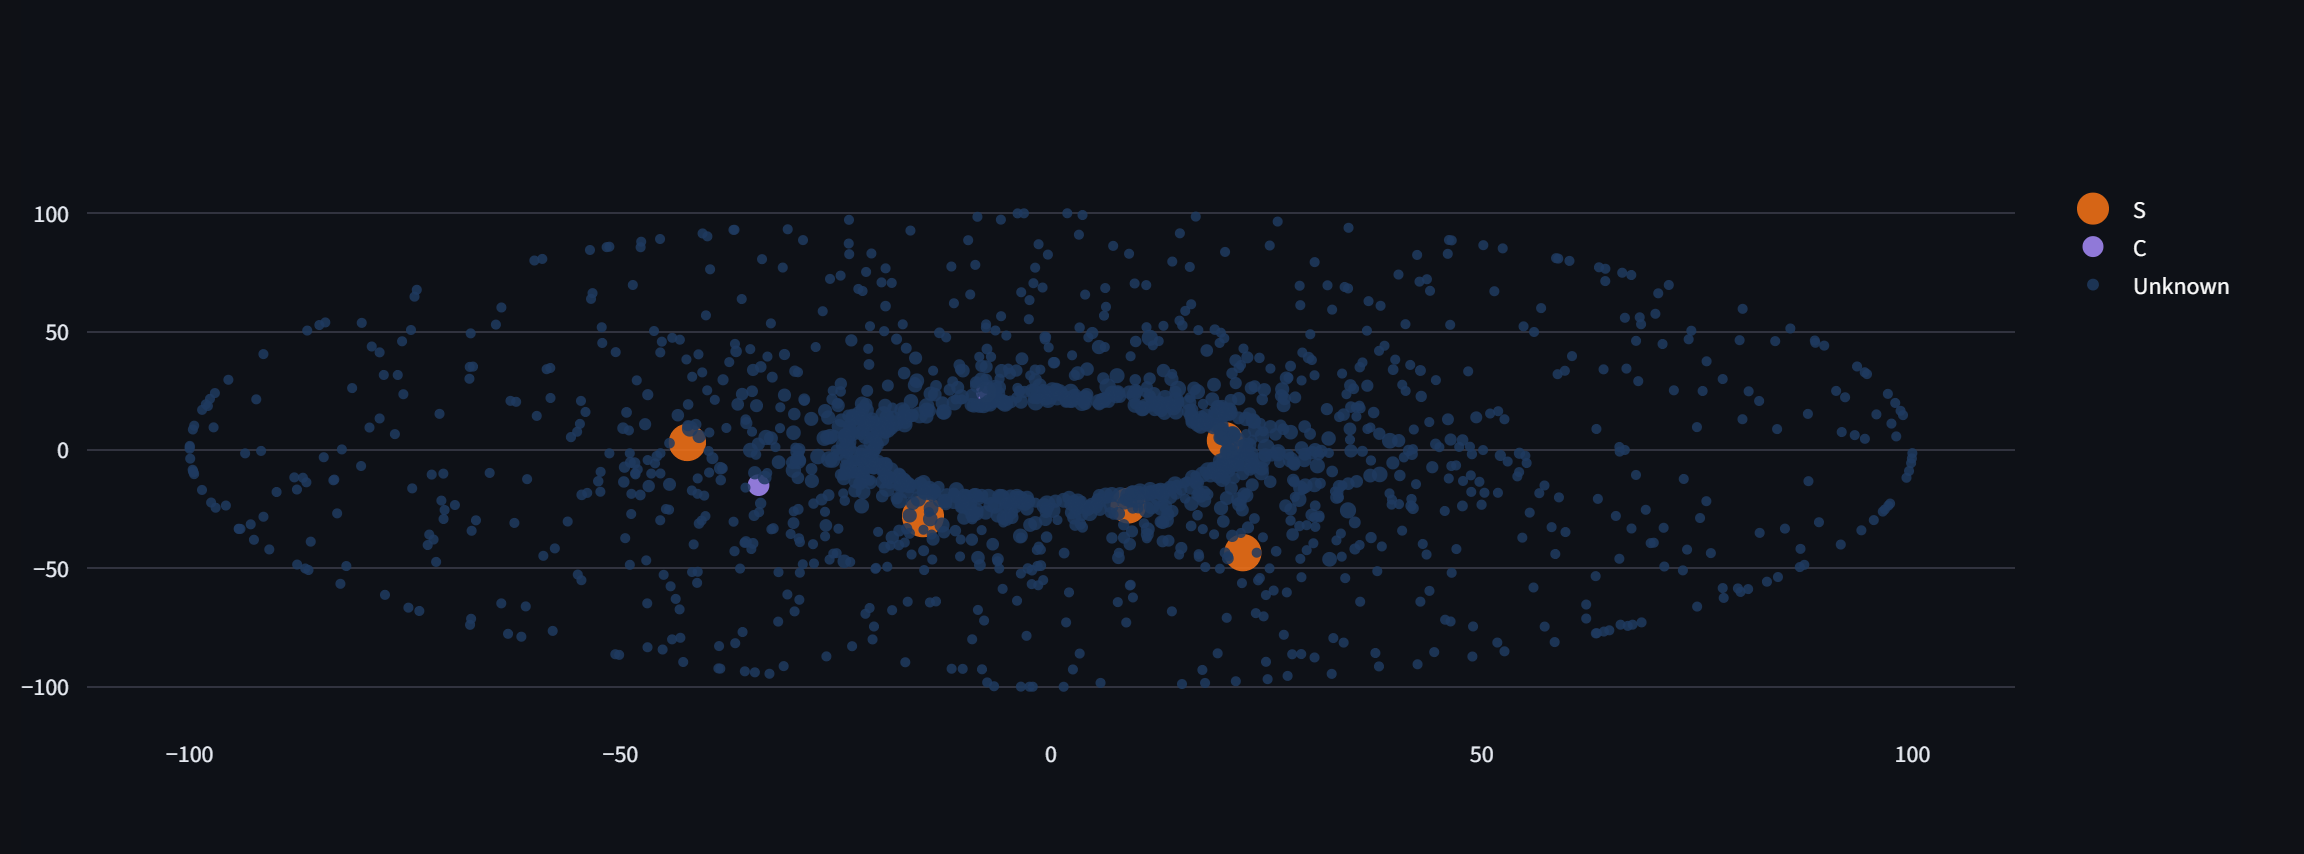
Visual map of specific astroids
-
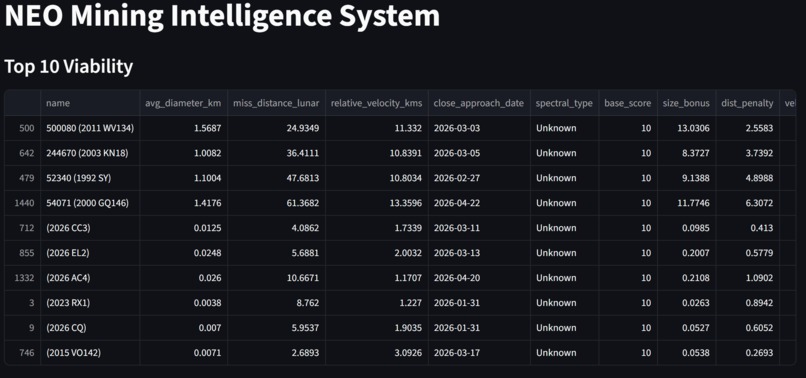
Full data that is pulled from NASA api
Inspiration
The 2021 chip shortage revealed something most people overlook: the minerals inside every semiconductor, platinum, palladium, cobalt, nickel, come from a handful of politically volatile countries. That geographic concentration is a strategic vulnerability. At the same time, M-type metallic asteroids passing Earth contain these exact minerals in extraordinary concentrations. A single 500-meter M-type NEO could hold more platinum-group metals than have ever been mined in human history. That disconnect inspired NASA N.E.O.
What it does
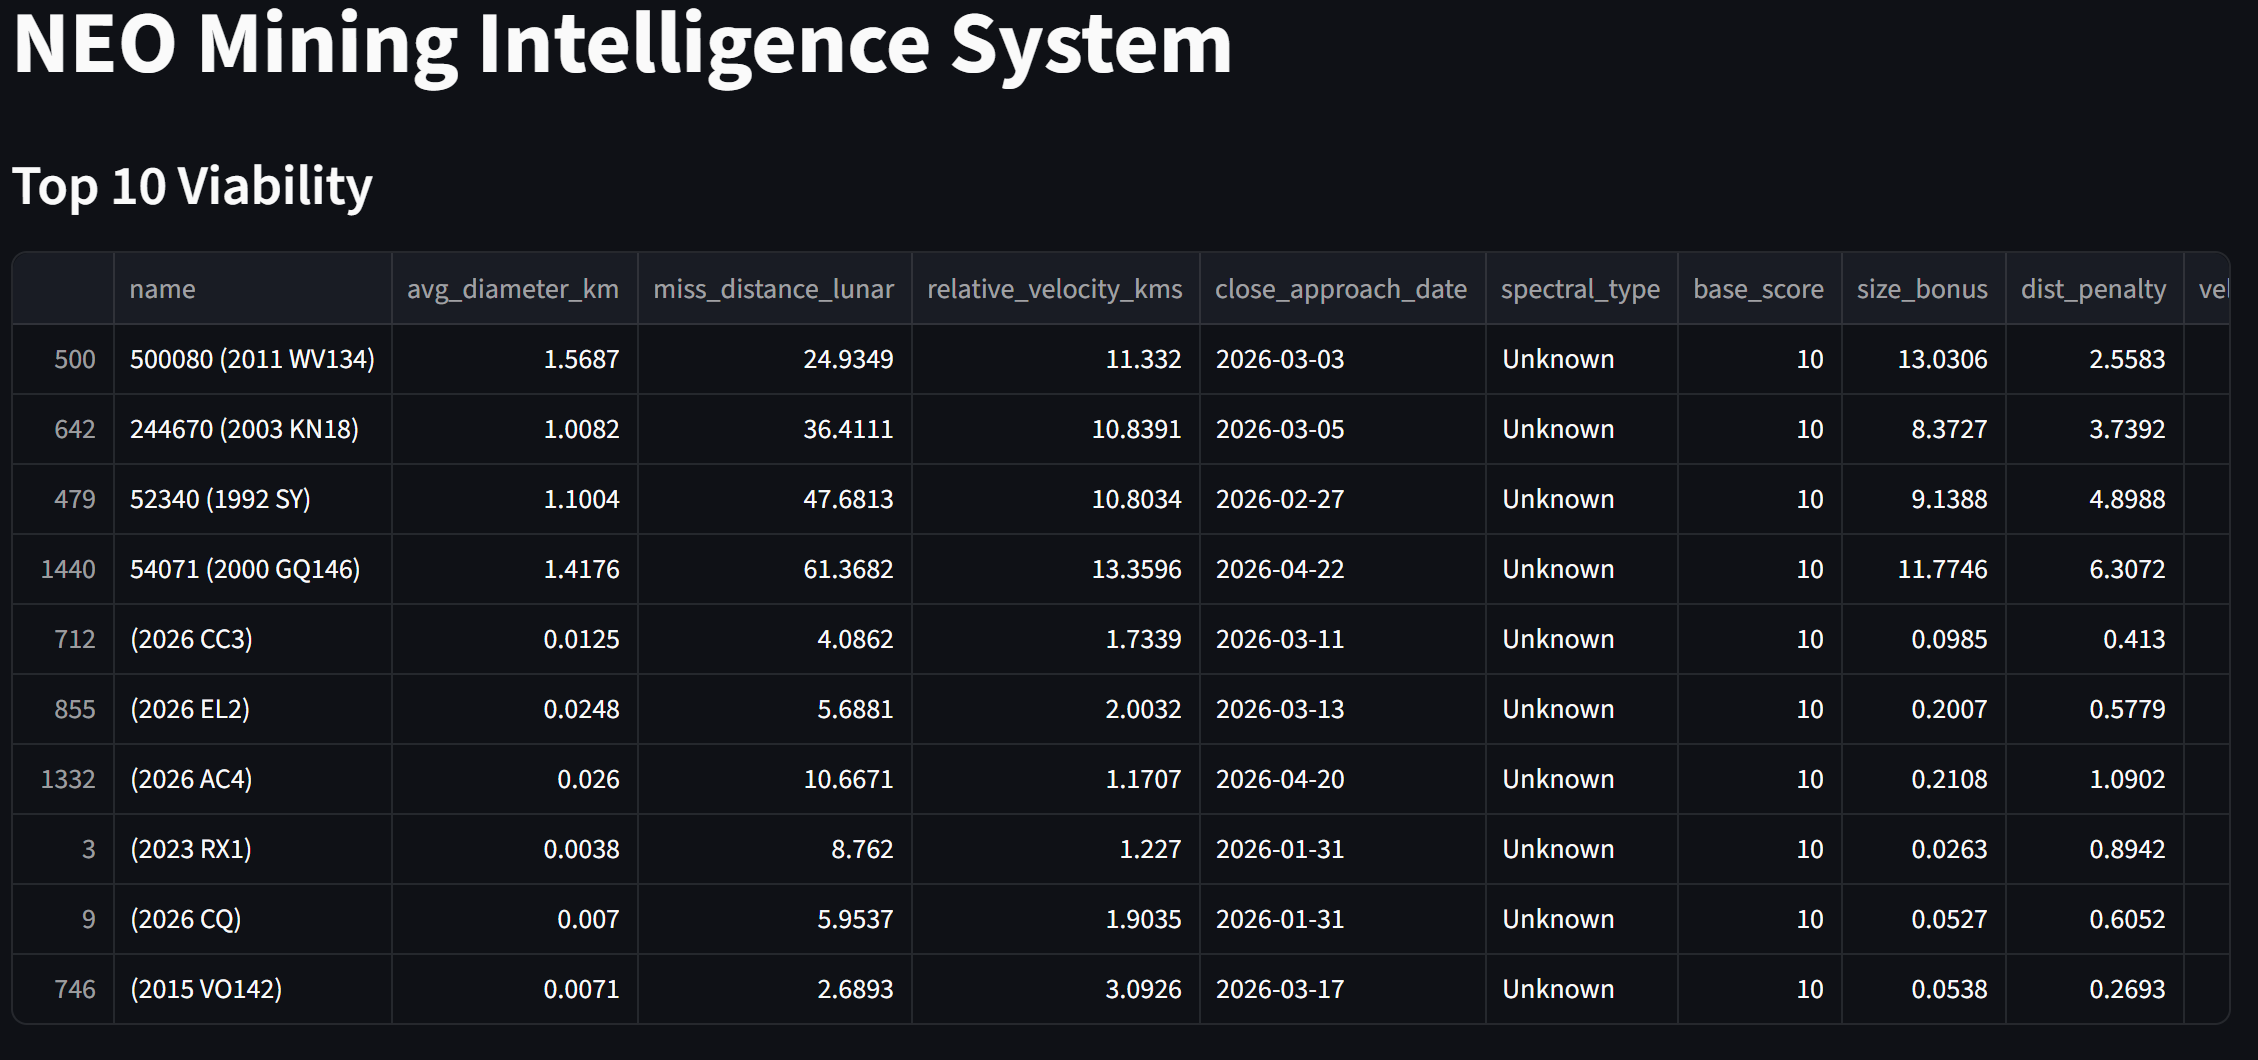
NASA N.E.O pulls 90 days of live near-Earth object data from NASA and builds a real-time Mining Viability Index for 1,539 asteroids. Each asteroid receives a composite score from 0 to 100 based on four factors: spectral type (what minerals it likely contains), estimated size (resource volume), miss distance (orbital accessibility), and relative velocity (mission feasibility). The results are visualized as an interactive orbital radar and ranked analytics table, letting space mining companies identify the best targets and when to go after them.
How we built it
I built the entire pipeline inside Zerve. The data layer pulls from NASA's NeoWs API across 13 sequential 7-day windows to cover a full 90-day horizon, joining approach data with spectral classifications from the NASA Small Body Database. The scoring model weights spectral base scores (M-type = 60, S-type = 35, C-type = 15) against normalized size, distance, and velocity factors. Visualizations are built in Plotly, including an interactive orbital radar with toggleable spectral type layers and a ranked top 10 table.
Challenges we ran into
The biggest challenge was spectral data availability. Multiple JPL and MPC API endpoints were unreachable from Zerve's execution environment, meaning I could only directly classify a small fraction of asteroids. I solved this by combining a hardcoded lookup table of well-known NEOs with a statistically representative distribution based on real NEO population research. This is scientifically defensible and used by researchers when ground truth data is sparse.
The second challenge was the orbital radar visualization. Getting 1,539 dots to spread cleanly across a full 360 degree view without clustering around Earth required several iterations of distance normalization and angle assignment logic.
Accomplishments that we're proud of
The unexpected finding: 60% of tracked NEOs have never been spectrally classified. Nobody knows what they are made of. NASA N.E.O's accessibility scores identify which unknown asteroids are worth pointing telescopes at before their approach window closes, turning the tool into a spectral observation prioritization system as much as a mining viability ranker.
I are also proud of the analytical insight that small but highly accessible asteroids consistently outrank larger but harder-to-reach ones, suggesting early space mining missions should prioritize accessibility over raw resource volume.
What we learned
Asteroid data is messier and more fragmented than expected. NASA maintains several overlapping databases with inconsistent naming conventions, making entity matching harder than the science itself. I also learned that the NEO discovery rate is outpacing our ability to characterize them spectroscopically, which is itself a meaningful finding about where investment in ground-based observation is needed most.
What's next for NASA N.E.O Near-Earth Objects
Three clear next steps. First, integrate real spectral data from the MIT SMASS survey once API access is available, replacing the statistical fill with ground truth classifications. Second, add delta-v calculations using JPL Horizons orbital elements to make the accessibility score more physically accurate. Third, cross-reference the viability index against actual space mining company target lists from AstroForge and historical Planetary Resources data to validate whether NASA N.E.O's model independently agrees with real industry decisions.

Log in or sign up for Devpost to join the conversation.