-

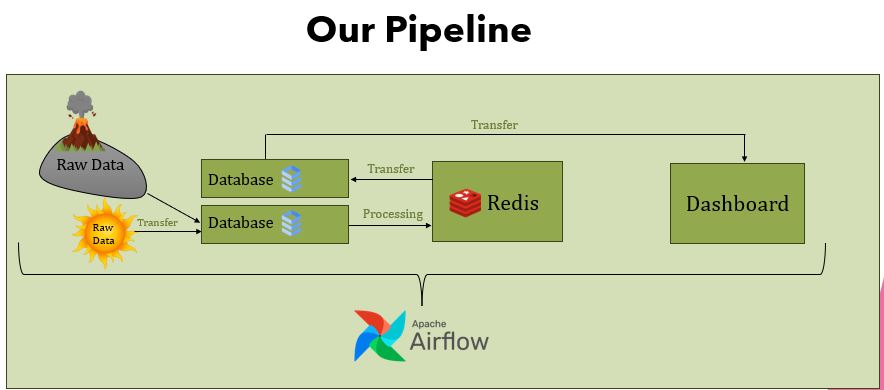
A diagram visualising our pipeline
-
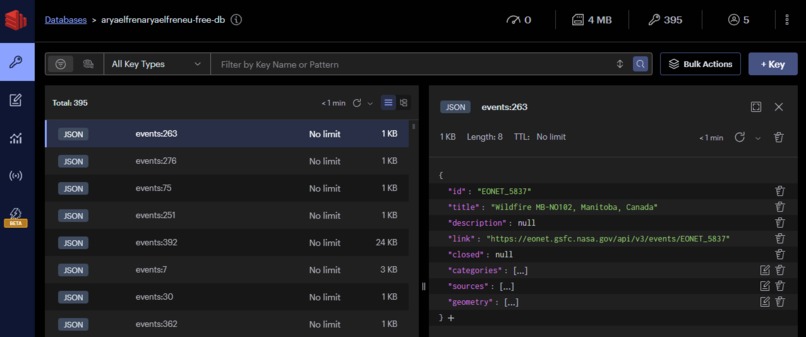
Screenshot of Redis
-
Our Program :3


Inspiration
We have a passion for data science and wanted put ourselves in the shoes of data analysts. Our pipeline is able to run indefinitely and so it is infinite
What it does
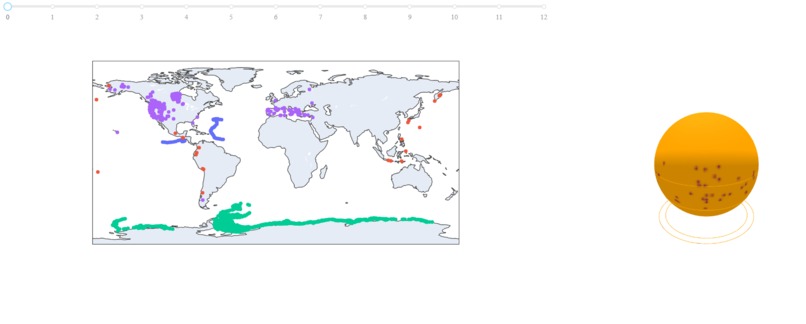
We receive data on natural disasters and coronal mass ejections from the NASA API and store it in our database. We then process it to make it more user friendly. From there it is sent to our python program which will visualise it in the form of either an interactive world map or a digital model of the sun. It continually updates in real time to give the impression of the sun being in your computer!
How we built it
We first created the python program which transforms the unreadable JSON data from the NASA API into readable tabulated words. Not long after, we were able to map points from the data set onto the world map. All that was left to do was be able to transfer the data into and out of the servers however we were not able to do this in the end due to issues on Google's server side. As a consequence we made a programme which will also read the Coronal Mass Ejection data and display the info on a model of the sun. We also managed to incorporate Apache Airflow into the pipeline which allowed us to repeatedly update our data points daily and automate our whole process.
Challenges we ran into
A large amount of time was spent trying to overcome hardware limitations of either the google database which we were trying to store data on or of our own laptops which could not run Apache Airflow. Another significant amount of time was dedicated to trying to incorporate docker into our pipeline which would allow the whole process to be repeatable.
Accomplishments that we're proud of
We are proud of our program which displays the coronal mass ejections. The more experienced programmers had never made something similar to this so it was new territory they delved into.
What we learned
We have all learned so much about how data pipelines are used in the real world. The less confident programmers of the team have also dramatically improved their programming skills.
What's next for NASA API Data Pipeline
Our program could very easily be scaled up to include more and more data to visualise. We could then make visuals of coronal mass ejections in real time or do statistical inference on the instances of natural disasters. As more and more data becomes inputted we could incorporate kafka to manage the data input.


Log in or sign up for Devpost to join the conversation.