-
-
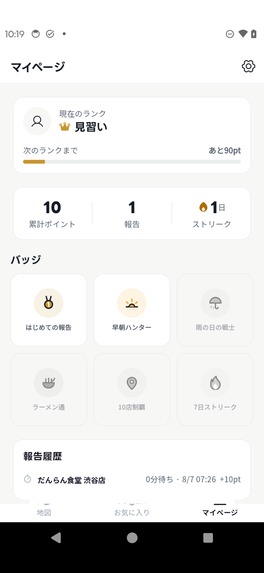
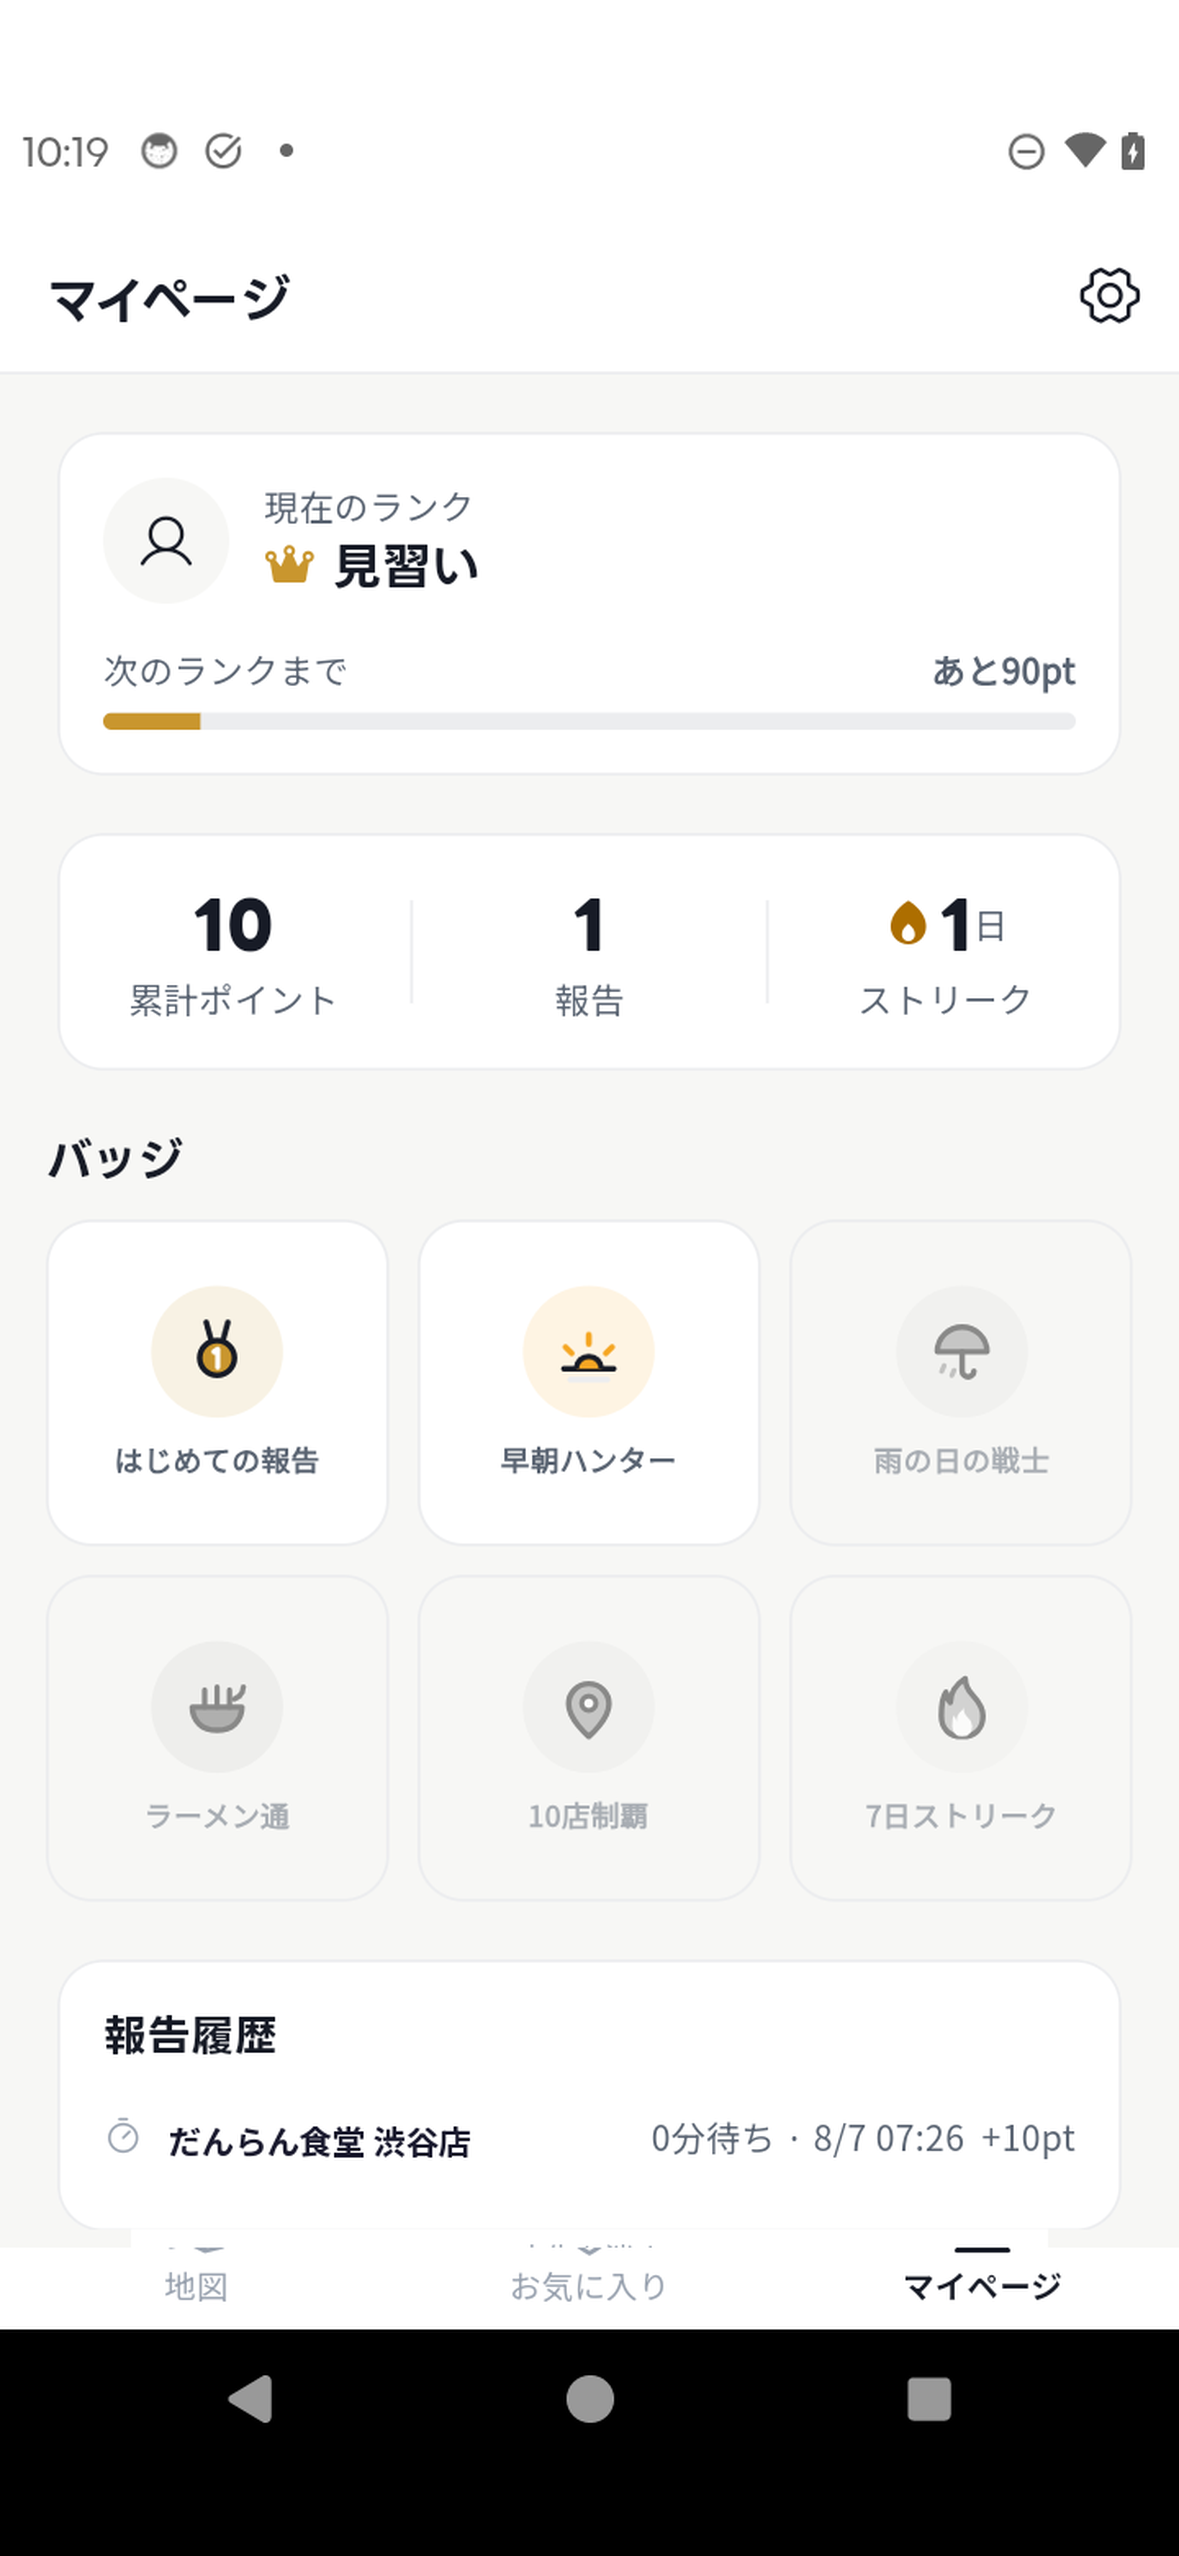
Reports earn points, streaks and badges. Contributors keep the predictions honest, so contributing is made rewarding.
-
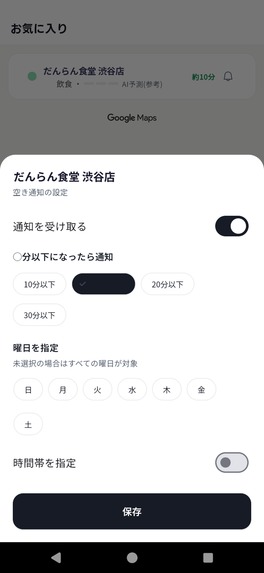
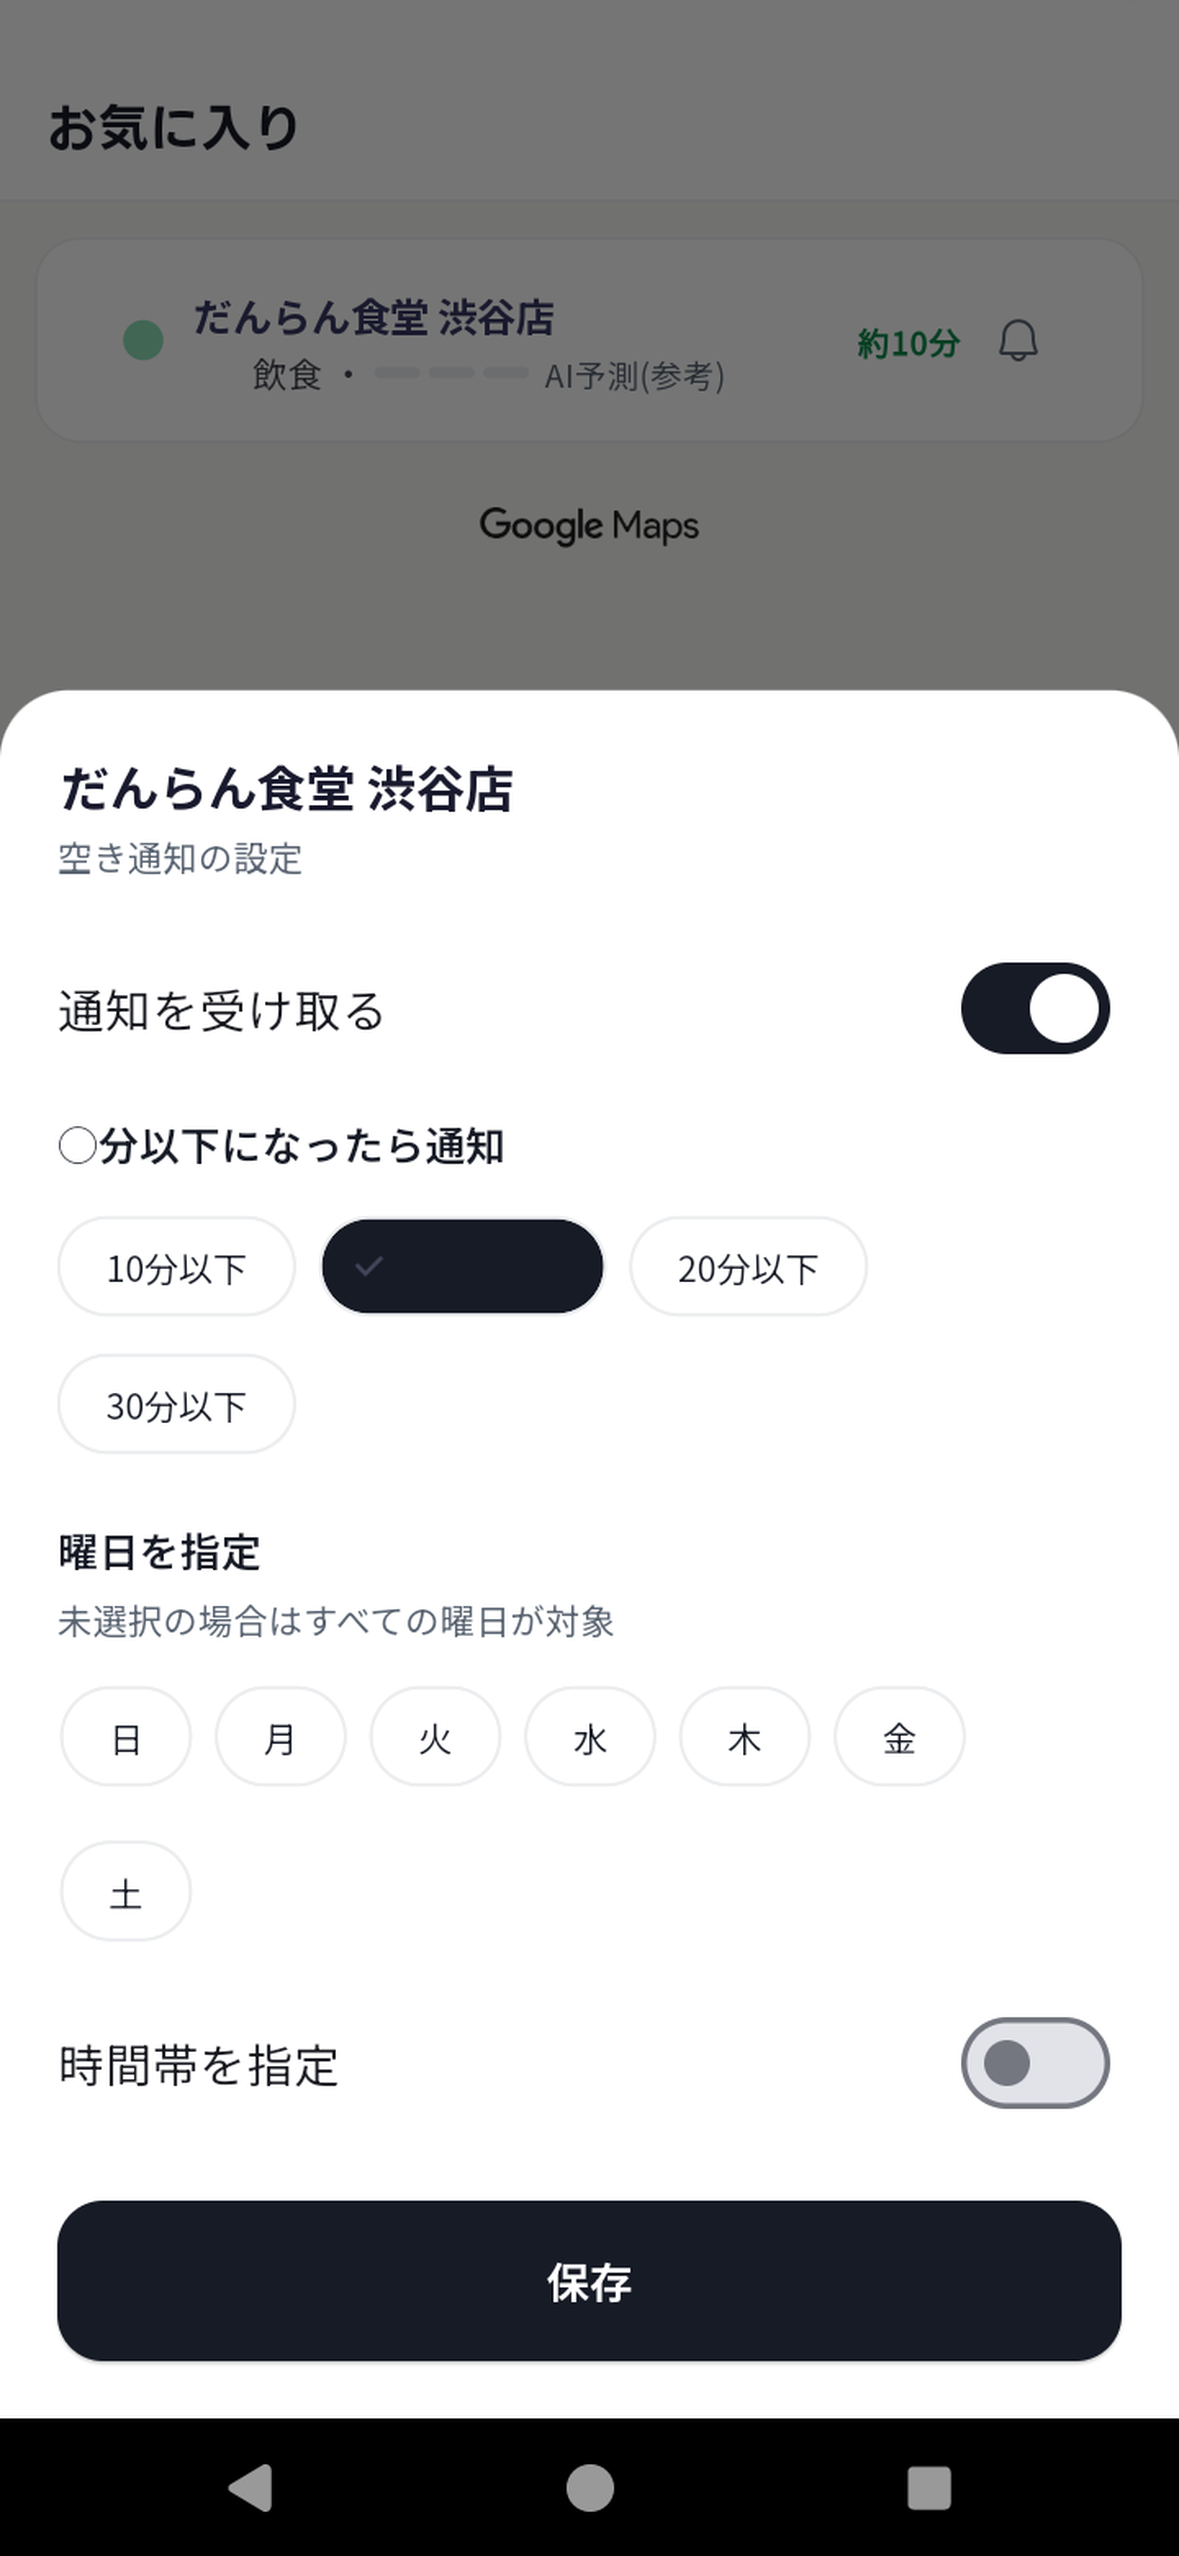
Premium adds a 3-hour lookahead, a weekly crowd heatmap, and a push notification the moment a favourite turns green.
-
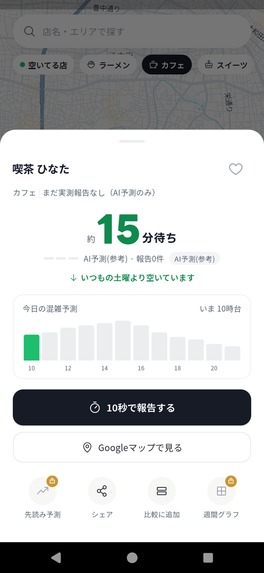
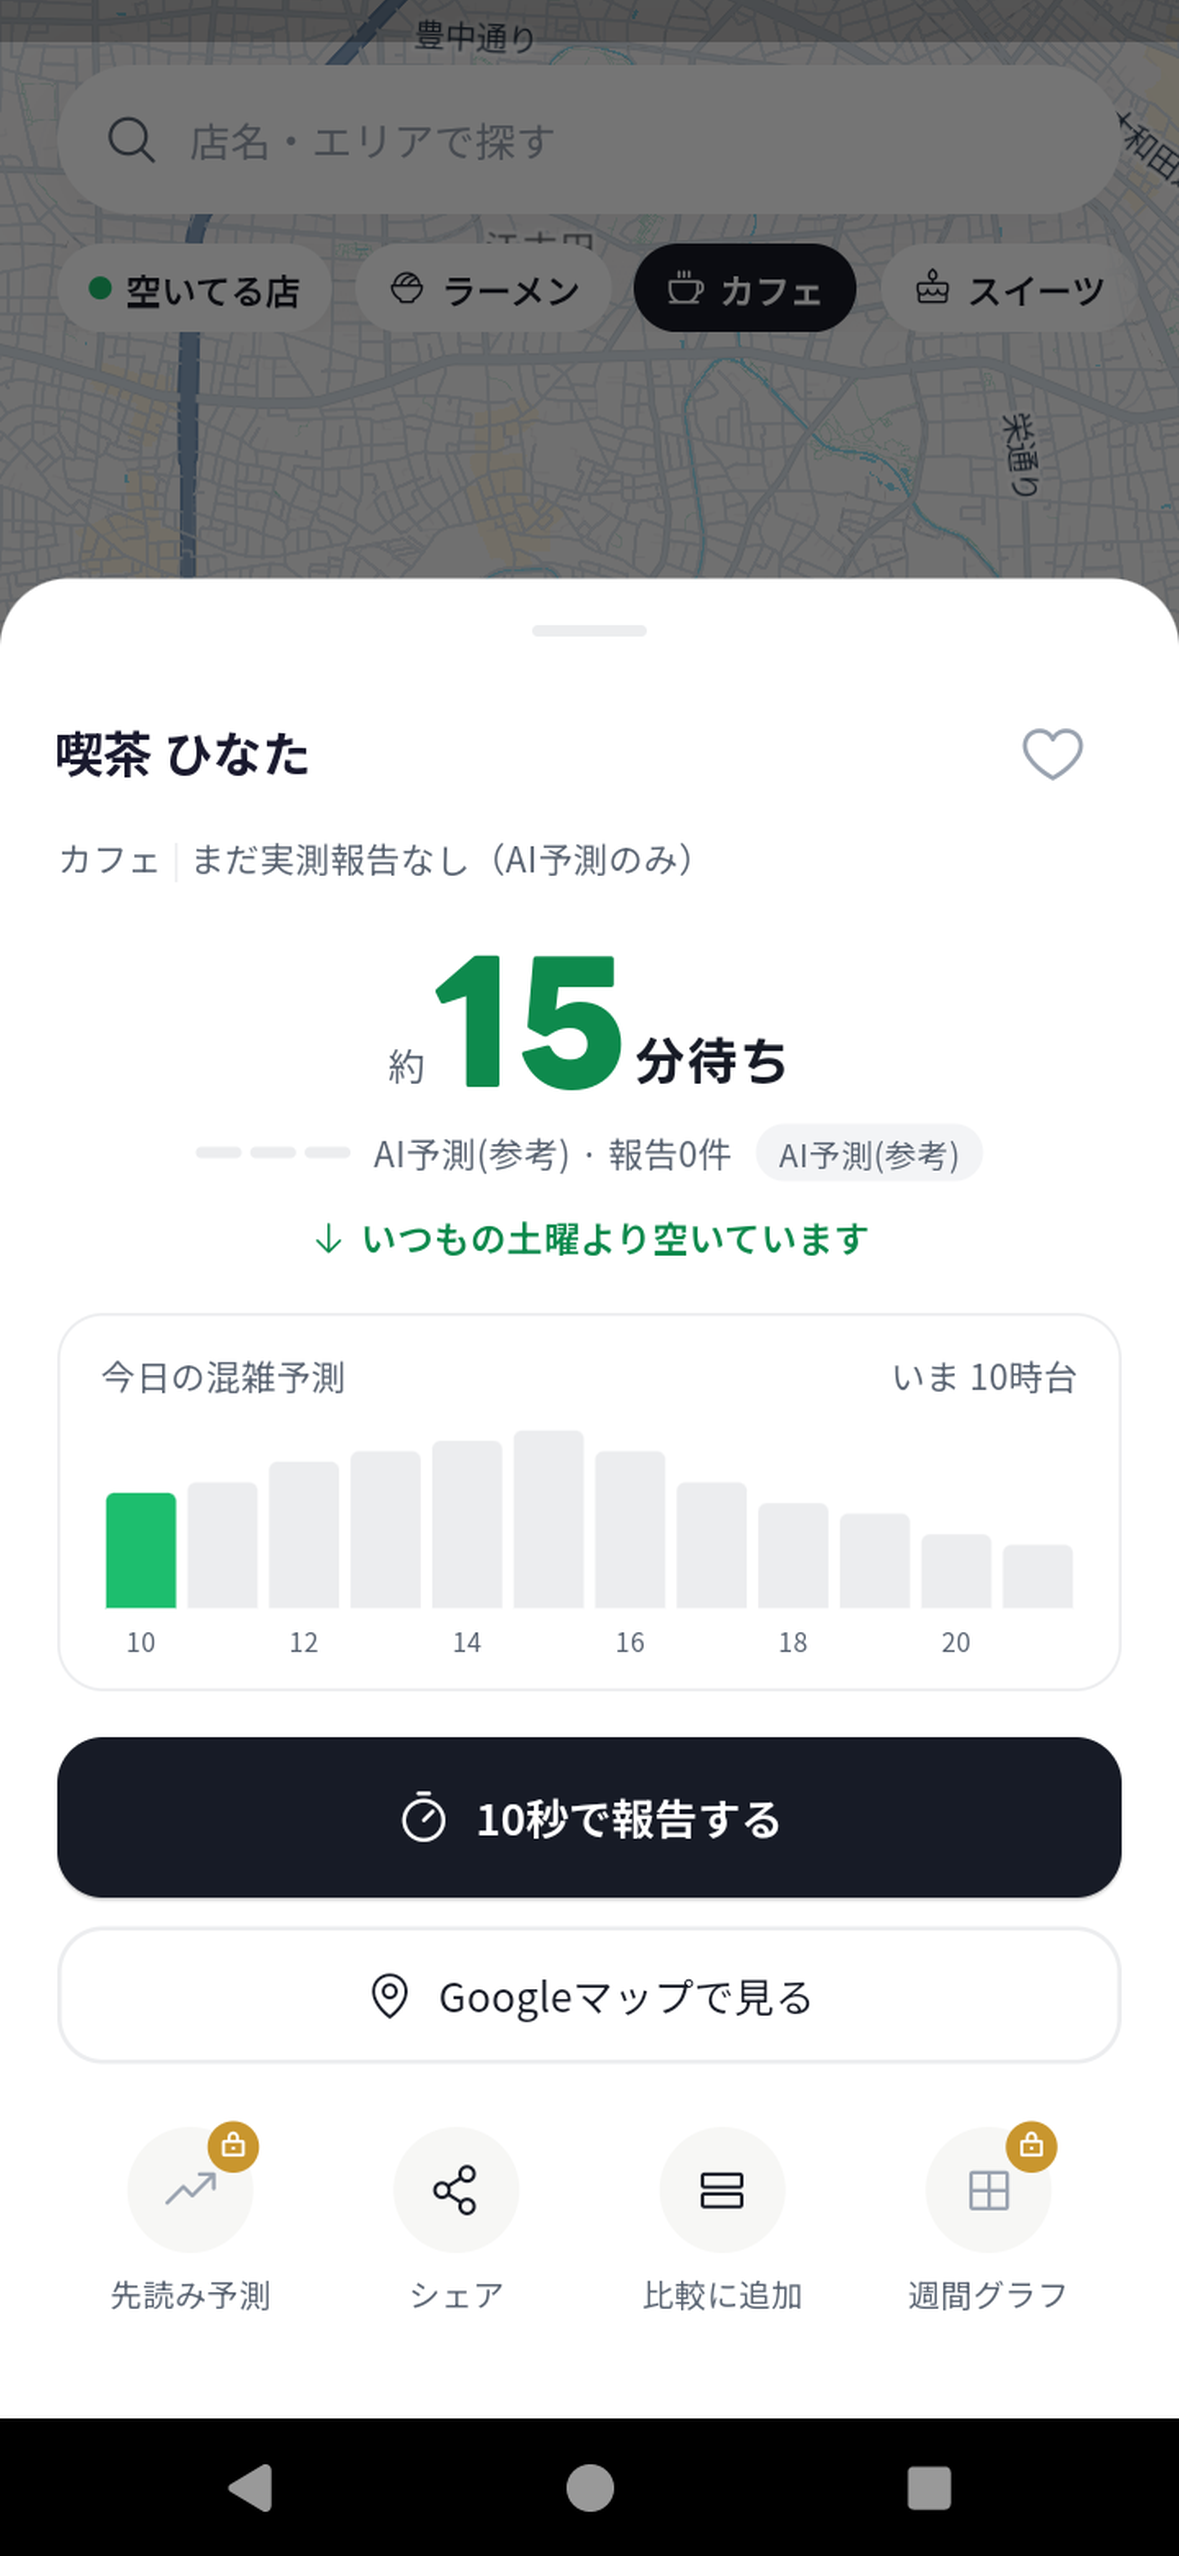
Tap a place for the predicted wait, how confident that estimate is, and whether today is busier or quieter than usual.
-
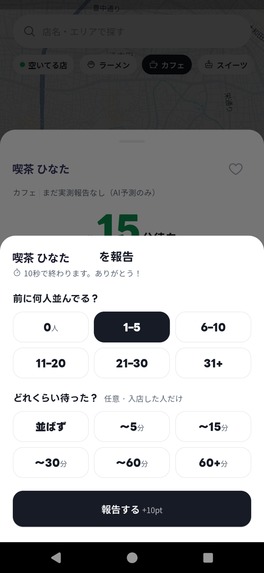
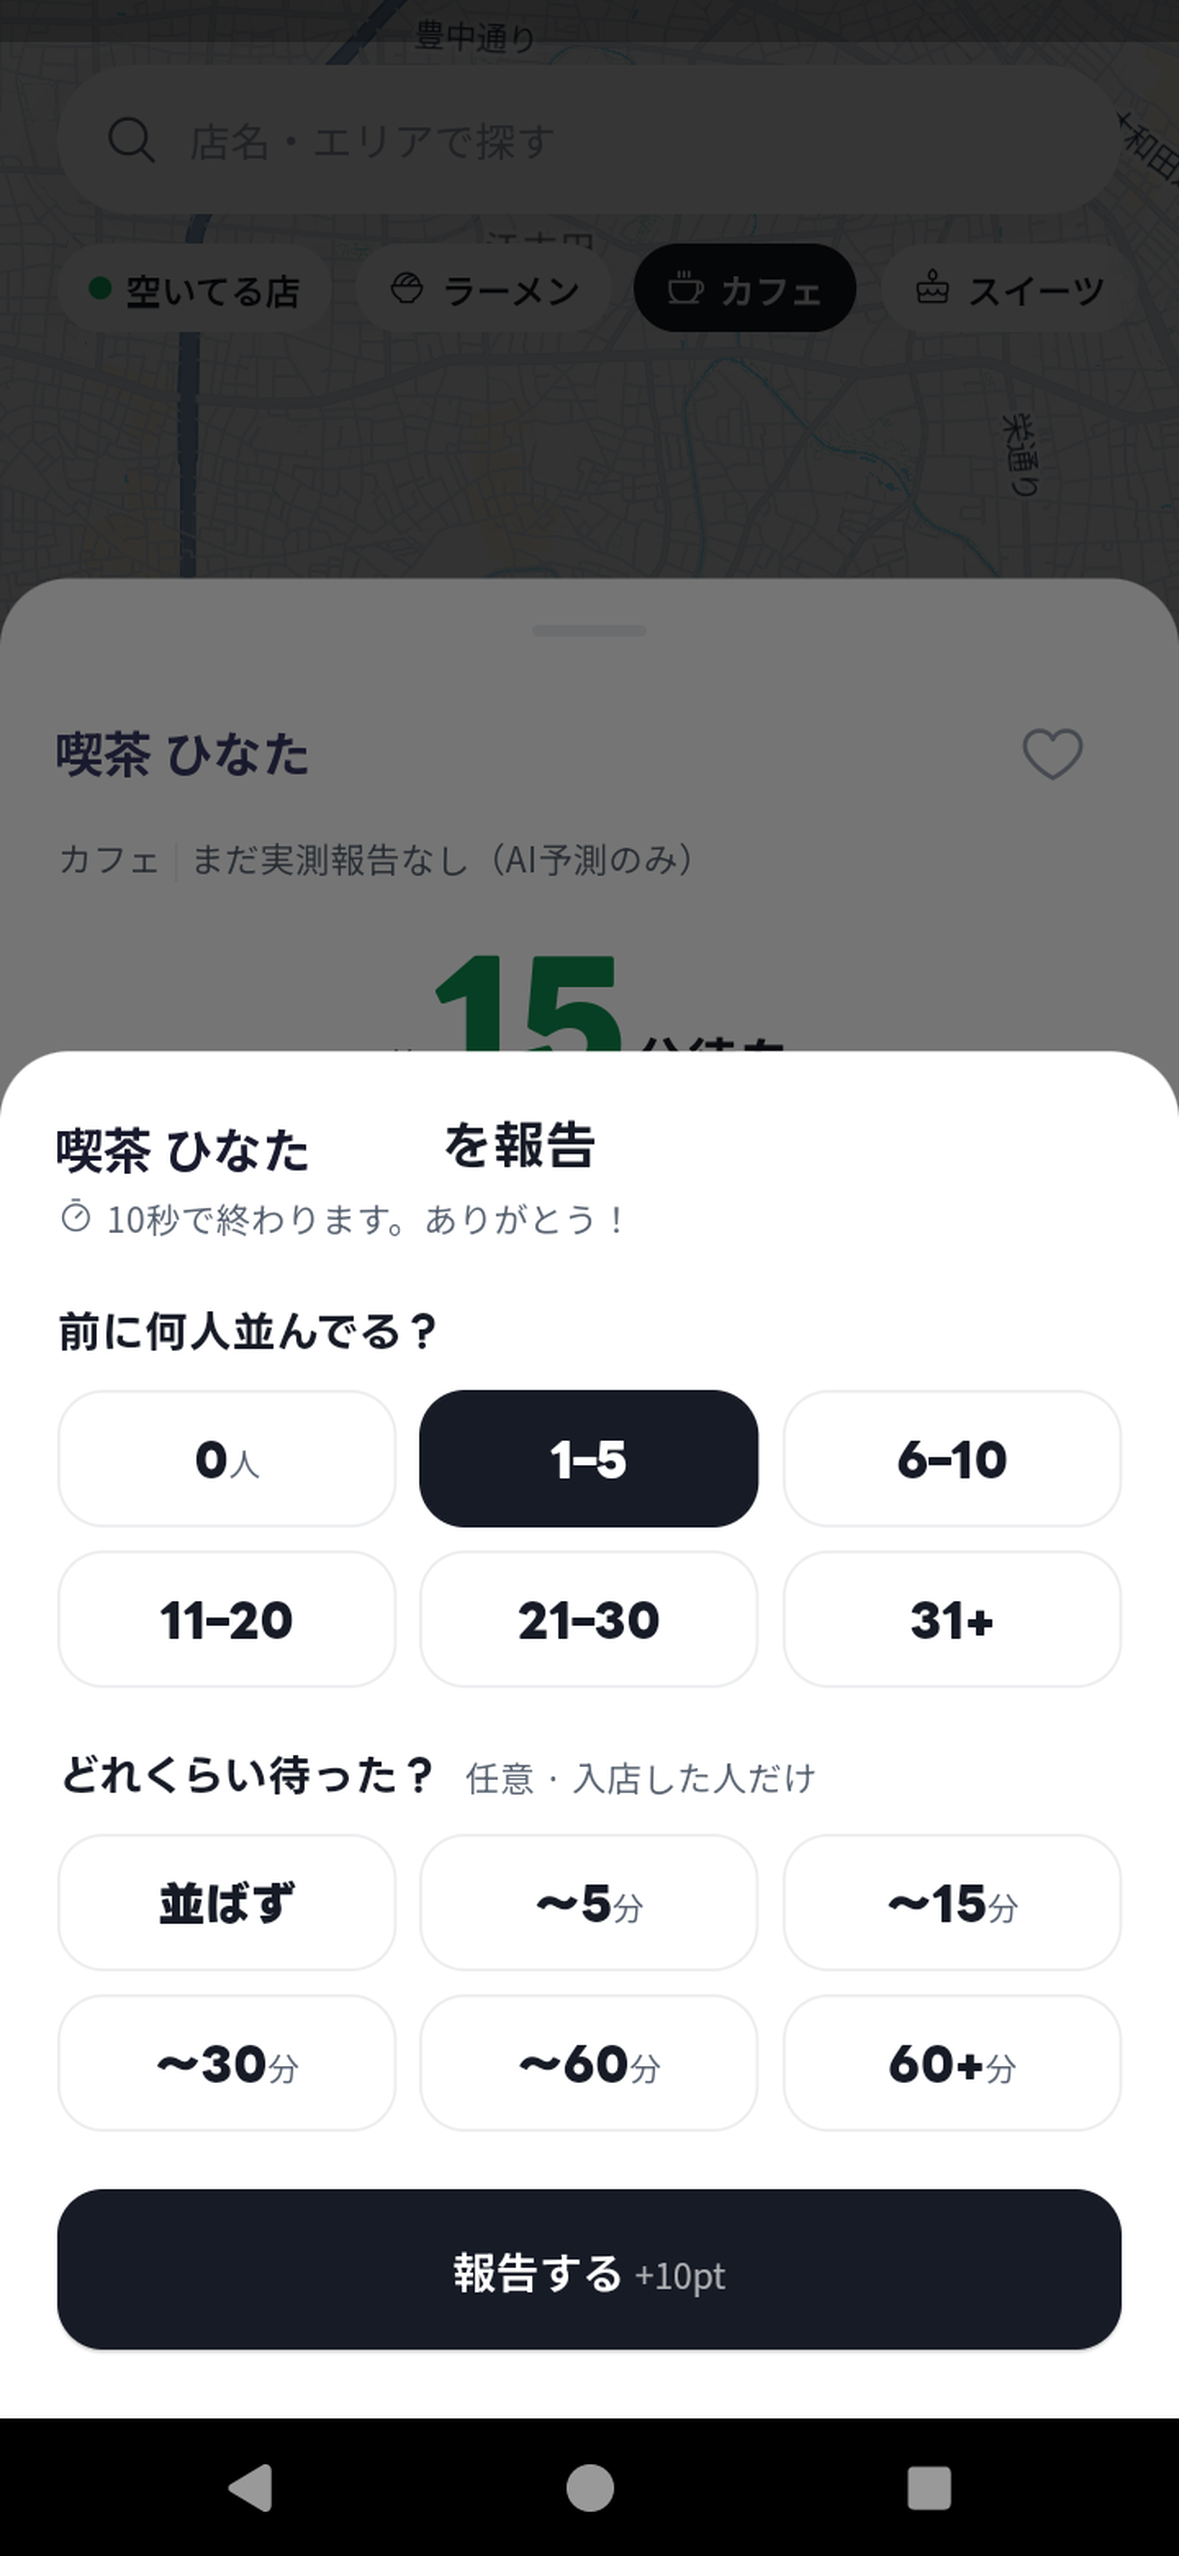
Reporting takes about 10 seconds. Tap how many people are ahead, tap how long you waited. No typing, no account needed.
-
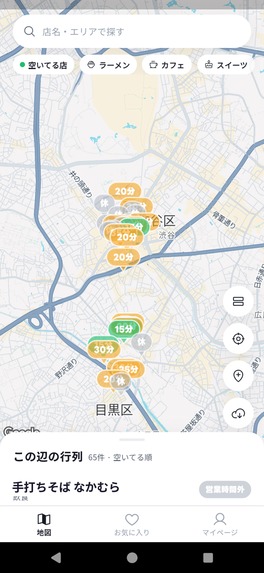
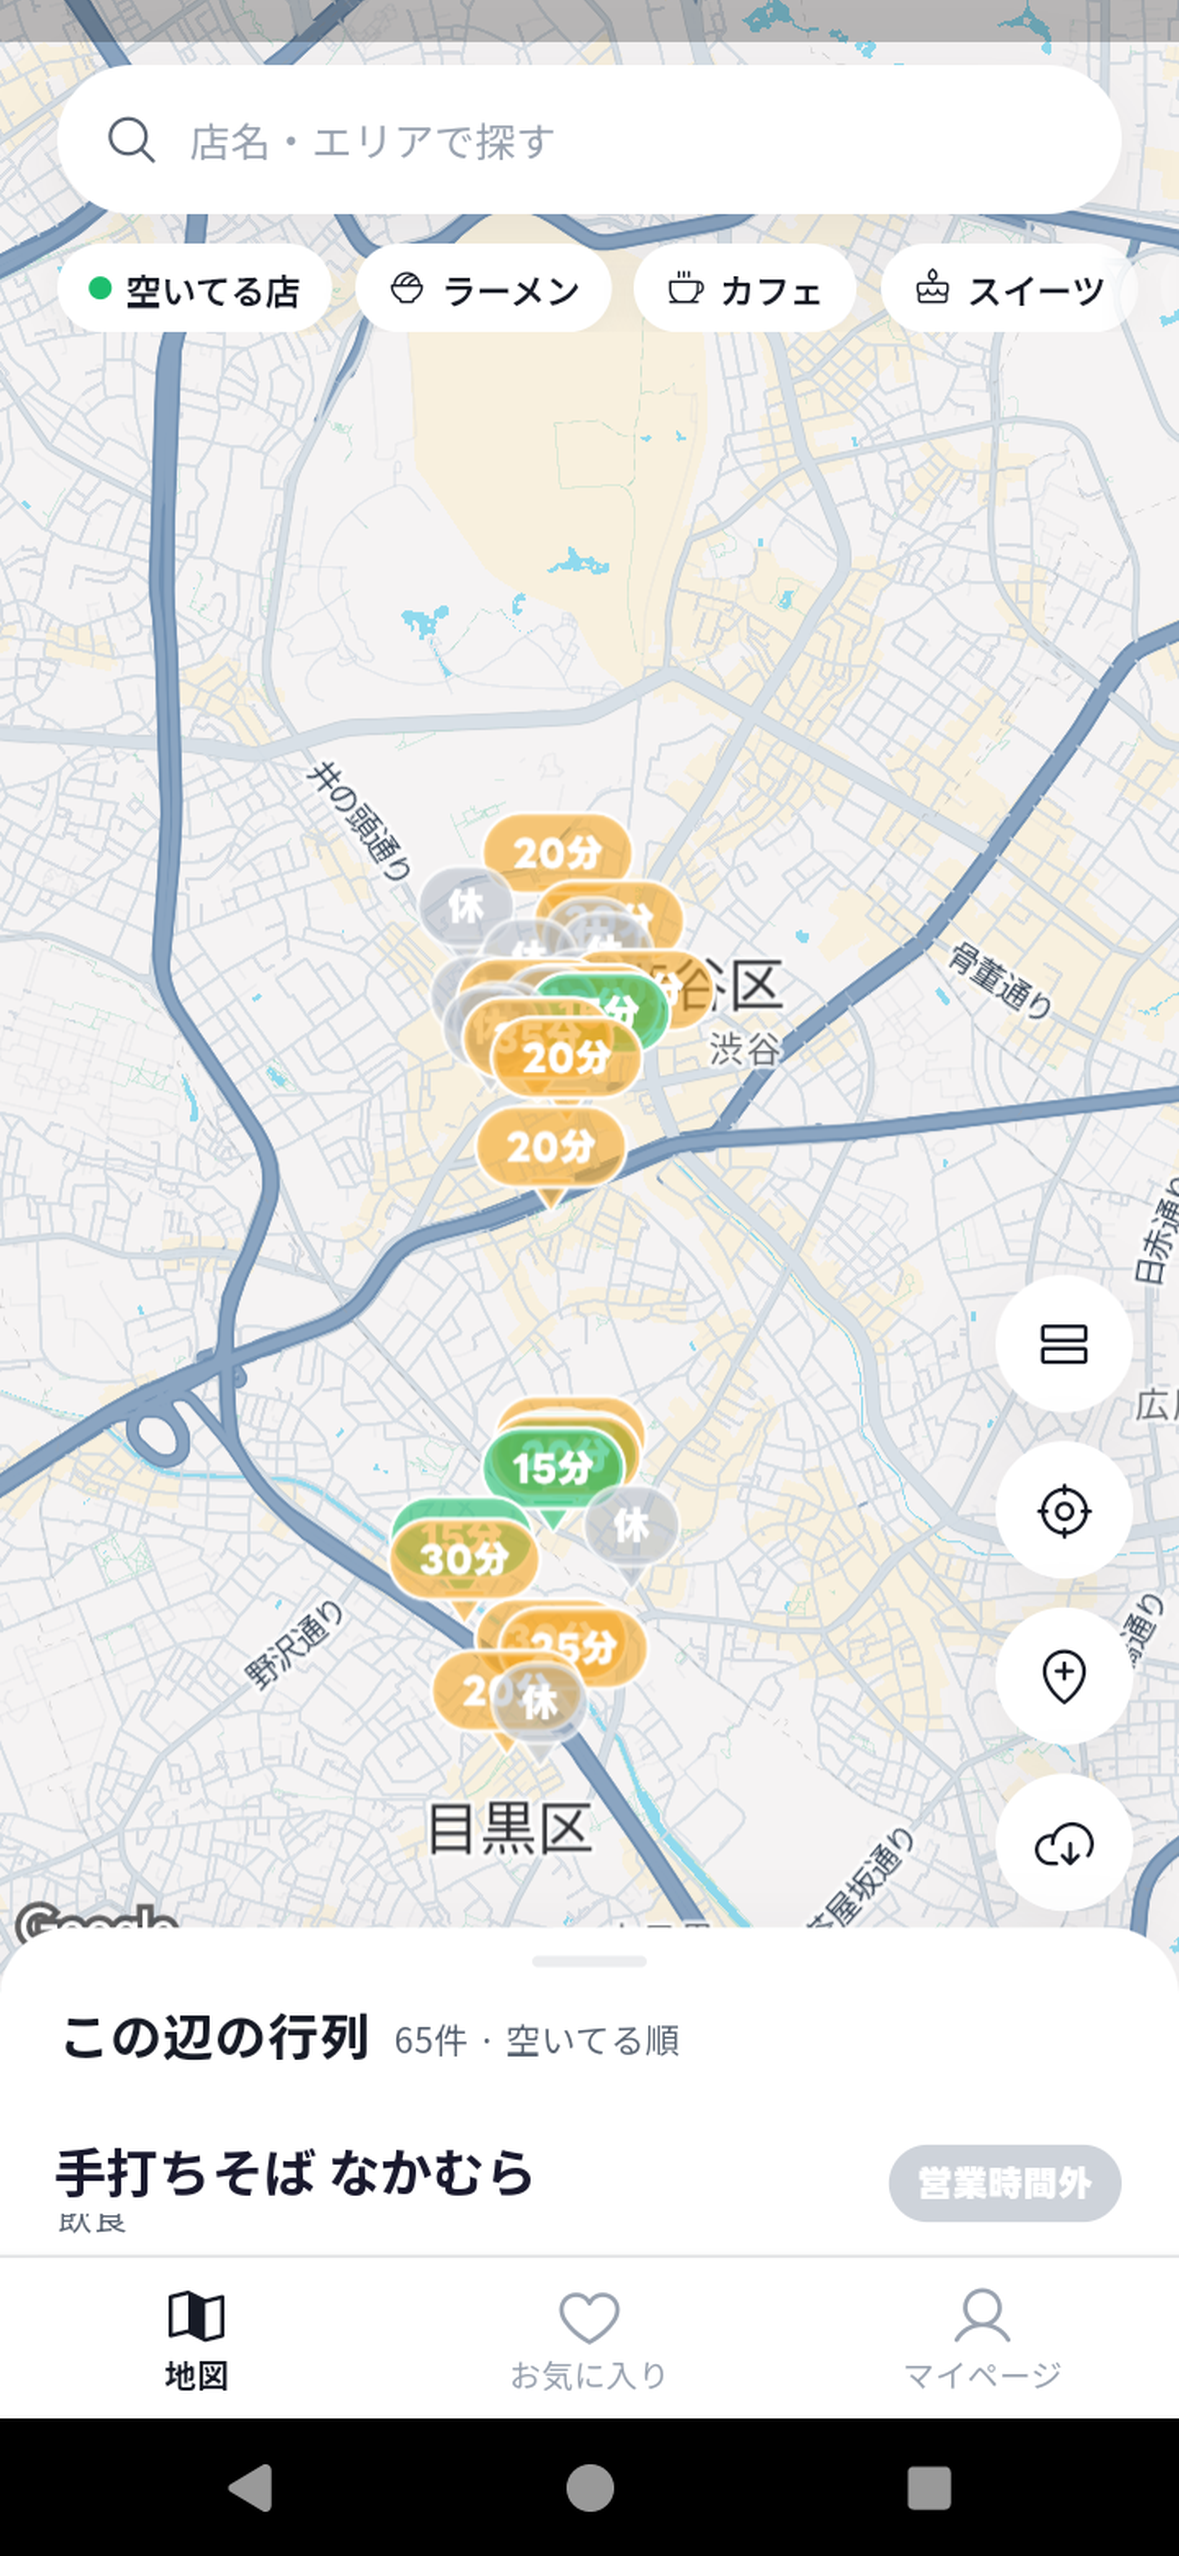
The map at a glance: green means walk in now, amber a short wait, red come back later. Each pin shows the predicted minutes.
-

Filter by genre, or show only places that are open now. The map redraws instantly.

Inspiration
Tokyo is full of restaurants worth queueing for — and you only find out how long the line is after you get there. I have walked 20 minutes to a ramen shop, seen 40 people outside, and gone home. Existing tools show "popular times" as a vague bar chart, averaged over months. Nobody tells you what the wait is today, right now.
I build apps alone, on weekends. I wanted to see if one person could turn that everyday annoyance into something genuinely useful — and be honest about its limits while doing it.
What it does
Narabu shows predicted wait times for restaurants on a map, color-coded so you can read it in one glance: green (0–15 min), amber (16–40 min), red (41+ min).
- Predict — a wait estimate for every candidate restaurant, computed from a genre baseline adjusted for time of day, day of week, weather, and holidays.
- Report — anyone can report an actual wait in about 10 seconds. No typing: tap how many people are ahead, tap how long you waited. Those reports continuously reshape the prediction.
- Show the uncertainty — every prediction carries a confidence bar. When confidence is low, the app says so explicitly instead of pretending. This was a deliberate product decision, not a disclaimer.
- Premium — 3-hour lookahead with "today's best time", a weekly crowd heatmap, compare up to 5 restaurants, unlimited favorites, and push notifications when a place you care about turns green.
How we built it
Client — Flutter with Riverpod. Google Maps native SDK for the map, custom-drawn pins that render the predicted minutes directly on the marker.
Backend — Cloud Functions in TypeScript. A scheduled crawler walks a grid of central Tokyo areas via the Google Places API and stores only derived values. Report writes trigger re-aggregation of statistics, confidence, and pin color.
The prediction engine is deterministic math, not a language model. A baseline (genre base × popularity × day-of-week × time-of-day × weather × holiday) is blended with the median of recent real reports, weighted by freshness. Confidence is derived from report count, recency, and variance. Every constant is tunable and documented, so a wrong prediction can be traced to a specific factor rather than a black box.
Monetization — RevenueCat for subscriptions (monthly / yearly with a 3-day free trial). A RevenueCat webhook mirrors entitlement into Firestore so the server decides who gets premium push notifications — the client is never the authority. AdMob runs a single anchored adaptive banner for free users, deliberately excluded from the map and the reporting flow so the core experience is never interrupted.
Challenges we ran into
Google Places terms vs. our database design. The Places terms permit caching Place IDs indefinitely and coordinates for 30 days, but not ratings or review counts. Our original schema stored them. We rebuilt it: the crawler computes a rank and popularity factor at crawl time, writes only those derived values, and discards the raw numbers. The app never displays a raw rating.
Cold start. A prediction app with zero reports is useless on day one. We seeded per-store hints for a handful of famously busy restaurants and built genre-level baselines, so the map is informative before a single user reports anything — and real reports progressively take over as confidence rises.
Bad data. People misreport. We layered four defenses: hard range limits at the security-rules level, median-absolute-deviation outlier rejection, de-duplication of rapid repeat submissions, and a "still in line?" thumbs up/down cross-check on recent reports.
A permission error that survived three rebuilds. Uploads kept failing on a missing AD_ID declaration even though the manifest demonstrably contained it. The cause was a build from before we added ads, still active on a different test track — AD_ID is evaluated app-wide across every track, not per-upload. Replacing that stale build fixed it instantly.
Keeping the bill near zero. We modeled the cost curve and found the only real driver is crawl scope × frequency; the native Maps SDK is free, and derived-value storage keeps documents tiny. At our current scope the monthly cloud bill is fully absorbed by the free tier.
Accomplishments that we're proud of
- Shipped to production in 177 countries, through a full 12-tester / 14-consecutive-day closed test.
- Two revenue streams that don't fight each other — subscription and ads, with the ad placement rules written to protect the core flow rather than maximize impressions.
- Server-authoritative entitlements. Premium push notifications are decided by Cloud Functions reading a webhook-maintained mirror, so a modified client cannot grant itself premium.
- We never fake precision. Low-confidence predictions are visibly marked as such. It costs us a little polish and buys us trust.
What we learned
Honesty is a feature. The instinct is to hide uncertainty because it looks weak. Showing a confidence bar turned out to be the thing that makes the number believable at all.
Read the terms before designing the schema. The Places caching rules forced a rewrite that would have been a five-minute decision if made on day one.
Free tiers are an engineering constraint worth designing around. Choosing the native Maps SDK over the JavaScript one, and storing derived values instead of raw payloads, is the difference between a zero-yen bill and an unsustainable one.
What's next for Narabu
- Beyond central Tokyo. Expansion is gated on crawl cost, so the next build adds per-area crawl tiers (weekly / monthly / quarterly) and a budget-triggered kill switch, letting coverage grow without the bill growing with it.
- Publish the accuracy numbers. We already log every prediction alongside the actual reported wait. Publishing that gap — including where we are wrong — is the most honest form of marketing available to a prediction app.
- Let the data pick the tuning. The engine's constants are hand-set today; with enough paired predictions and outcomes they can be fit instead of guessed.
Built With
- admob
- cloud-firestore
- cloud-functions
- dart
- firebase
- firebase-analytics
- firebase-auth
- firebase-cloud-messaging
- flutter
- google-cloud
- google-maps
- google-places
- open-meteo
- revenuecat
- riverpod
- typescript

Log in or sign up for Devpost to join the conversation.