-
-
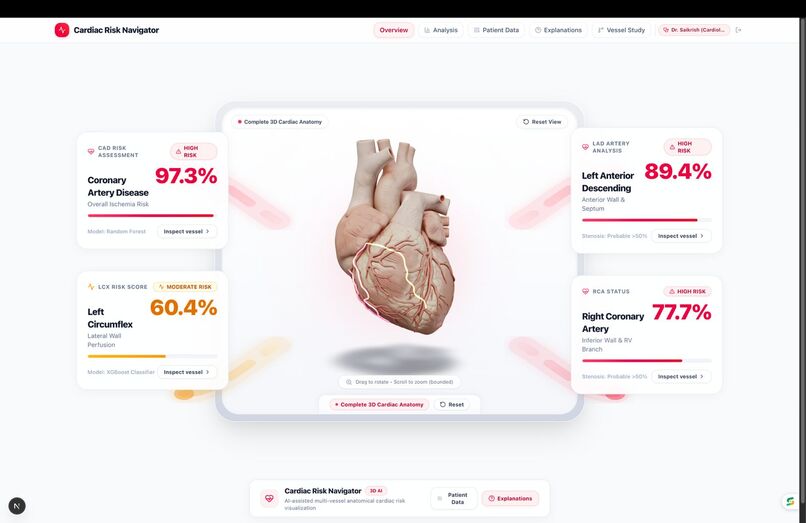
The dashboard
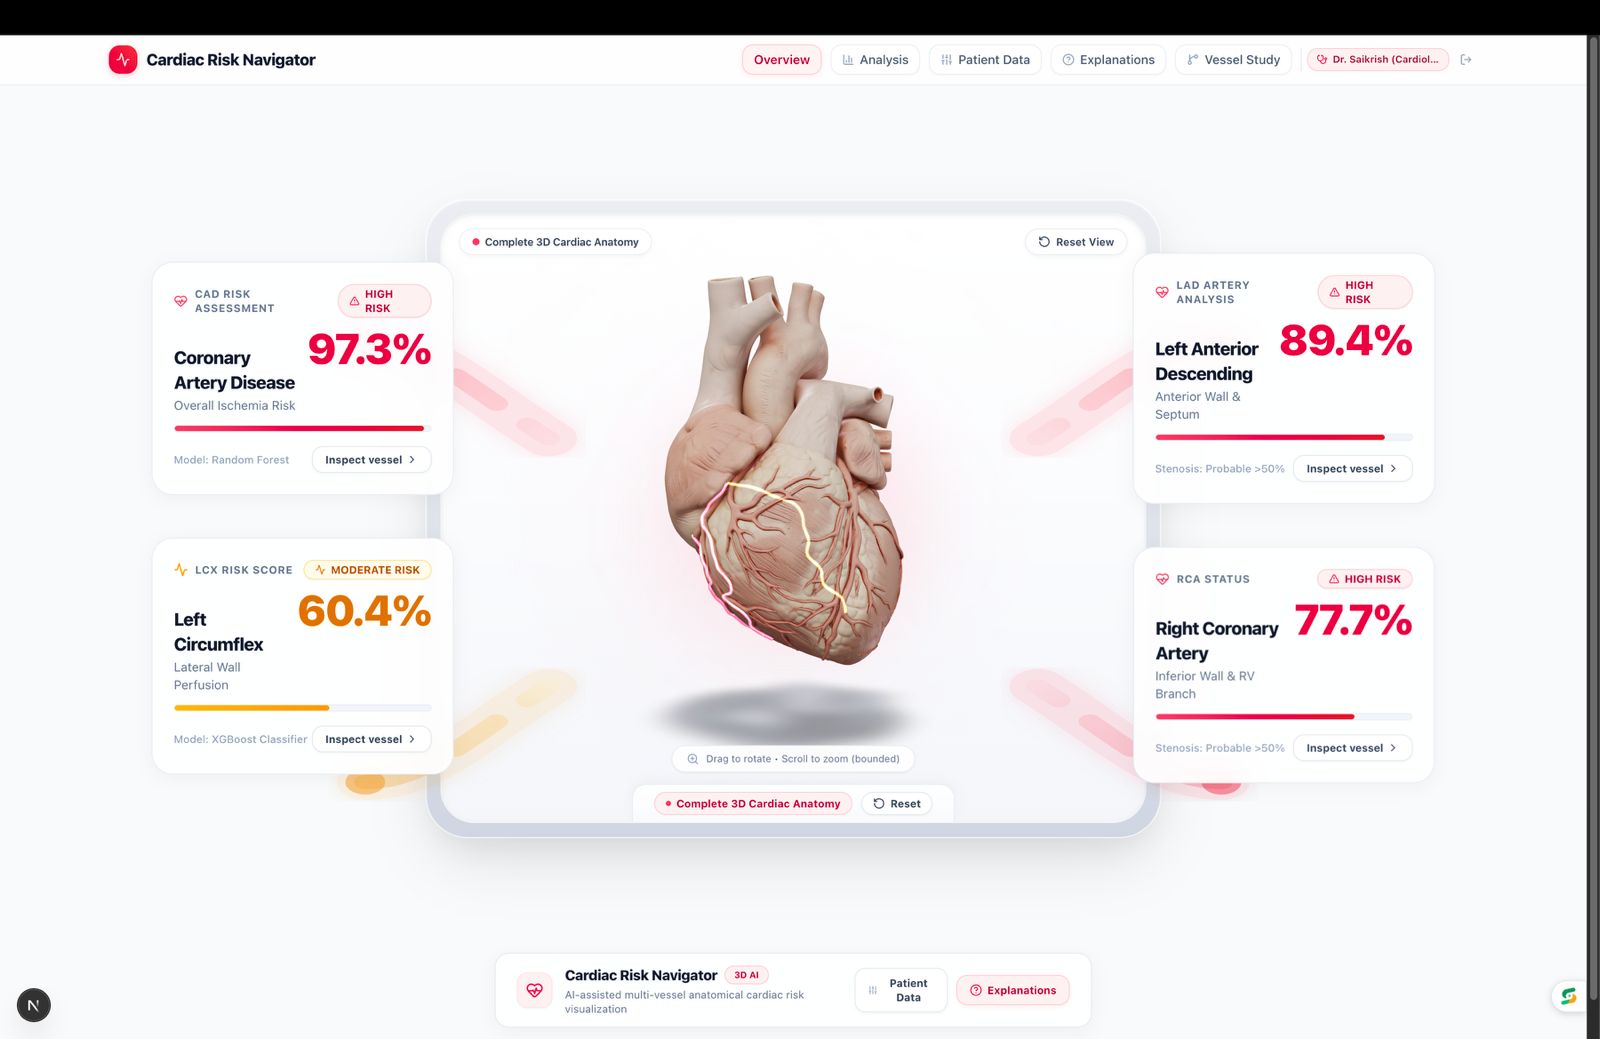
Cardiac Risk Navigator: Beyond Prediction. Into the Heart of Risk.
Inspiration:
Cardiovascular diseases remain a major global health challenge, and understanding coronary artery disease (CAD) often involves interpreting multiple clinical parameters and complex cardiac findings. Although machine learning can identify patterns in clinical data, its predictions can be difficult to interpret, especially when presented as probabilities without clear explanations.
We wanted to explore a different approach: What if an AI system could not only estimate cardiac risk, but also help users visualize where the risk is being assessed and understand why the model made its prediction?
This inspired us to develop Cardiac Risk Navigator, an Explainable AI-powered platform that combines machine learning, clinical information extraction, SHAP-based explanations, and interactive 3D coronary artery visualization in a unified interface.
What it does
Cardiac Risk Navigator is a web-based research prototype that brings together four key capabilities:
- AI-powered risk prediction: Estimates overall CAD risk and generates separate predictions for the left anterior descending (LAD), left circumflex (LCX), and right coronary artery (RCA).
- Comprehensive clinical assessment: Processes 55 clinical input features covering patient demographics, medical history, cardiovascular risk factors, symptoms, ECG findings, laboratory measurements, and cardiac function.
- Interactive 3D visualization: Allows users to rotate, zoom, and explore a 3D heart model, select individual coronary arteries, and view colour-coded representations of the model's predicted risk categories.
- Explainable AI and reporting: Uses SHAP to identify clinical features influencing individual predictions and generates structured PDF reports containing prediction results, available explanations, and model-performance information. The platform supports both manual clinical data entry and clinical report uploads in TXT, PDF, and DOCX formats. Extracted information can be reviewed before it is used for prediction. By integrating these capabilities, Cardiac Risk Navigator aims to make machine learning outputs easier to explore and interpret, rather than presenting risk estimates as unexplained numbers.
How we built it
We developed the prototype using a modular architecture that connects a web-based interface with a dedicated machine learning backend.
- Machine learning: We used the Z-Alizadeh Sani dataset, containing 303 patient records, to develop separate classification pipelines for CAD, LAD, LCX, and RCA prediction. The pipelines incorporate numerical and categorical preprocessing, stratified cross-validation, and model evaluation using accuracy, precision, recall, F1-score, and ROC-AUC. Random Forest and XGBoost are among the techniques used in our modelling workflow.
- Explainable AI: We integrated SHAP to examine feature contributions to individual model predictions. This helps connect the numerical output with the clinical input features that influence the model's behaviour.
- Interactive visualization: We built the frontend using Next.js and React, incorporating an interactive 3D heart model with selectable coronary artery views and colour-coded vessel overlays. The visualization links the model's output to an anatomical representation.
- Backend and clinical data processing: We used Python and FastAPI to handle prediction requests, load trained models, process clinical inputs, and connect the frontend to the machine learning pipeline. A document-processing workflow extracts readable text and maps supported clinical information to the model's input schema.
- Automated reporting: We incorporated PDF report generation to consolidate the available patient information, predictions, risk categories, explanations, and model-performance details into a structured document. Each component was designed to work as part of a single workflow, from data entry to prediction, interpretation, visualization, and reporting.
Challenges we ran into
One of our biggest challenges was integrating several technically different components into a coherent application. Machine learning predictions, clinical text extraction, explainability, 3D rendering, and PDF generation each have different data requirements and needed to communicate reliably.
Working with a relatively small dataset of 303 records also presented challenges. We needed to consider preprocessing, class distributions, model selection, cross-validation, and the possibility of overfitting. We also had to ensure that target variables were excluded from model inputs to reduce target leakage.
Another challenge was translating clinical information from uploaded reports into structured model inputs. Clinical documents may use different terminology, omit important parameters, or contain ambiguous values. Our current workflow therefore supports review of extracted, missing, and uncertain information, rather than assuming that every extracted value is correct. Scanned image-only PDFs are not currently supported through OCR.
Finally, connecting vessel-specific predictions to the 3D heart required careful communication of what the visualization represents. The vessel overlays are approximate anatomical representations of model outputs, not measurements of actual arterial narrowing or patient-specific plaque locations.
These challenges helped us distinguish between building an engaging demonstration and developing a system that would eventually require rigorous clinical validation.
Accomplishments that we're proud of
We are proud to have brought multiple AI and software components together in a functional research prototype.
Our key accomplishments include:
- Developing four separate prediction targets for overall CAD and three major coronary arteries.
- Integrating 55 clinical input features into a unified assessment workflow.
- Connecting model predictions with SHAP-based feature explanations.
- Building an interactive 3D interface for exploring coronary artery-specific outputs.
- Supporting both manual entry and clinical document-based data extraction.
- Generating structured PDF reports from the analysis workflow.
Designing a modular frontend and backend architecture that can be developed and deployed independently.
Most importantly, we moved beyond a conventional prediction dashboard and created an integrated experience in which users can examine the estimated risk, explore its anatomical context, and investigate the model's reasoning.
What we learned
This project taught us that building an AI-powered healthcare application involves much more than training a model.
We learned how to connect data preprocessing, classification, model evaluation, explainability, API development, frontend engineering, and interactive 3D visualization into a single workflow. We also gained a better understanding of the challenges associated with limited datasets, clinical terminology, uncertain inputs, and responsible communication of AI predictions.
SHAP helped us explore how individual features influence model outputs, while the 3D interface taught us how visualization can make complex information more accessible. At the same time, we learned that an explanation is not proof of causation, a predicted probability is not automatically a calibrated clinical risk, and a vessel highlight does not establish the presence or location of stenosis.
These lessons reinforced the importance of transparency, careful evaluation, and clear limitations when applying machine learning to healthcare.
What's next for Cardiac Risk Navigator?
Our next goal is to strengthen the prototype's reliability and move towards a more robust, clinically meaningful research platform.
Planned improvements include:
- Evaluating the models through more rigorous validation and, where possible, independent external datasets.
- Assessing probability calibration and the clinical relevance of vessel-specific predictions.
- Improving clinical document extraction to handle more terminology, uncertainty, and scanned documents.
- Refining the 3D anatomical visualization and clearly distinguishing predicted risk categories from confirmed anatomical findings.
- Expanding the evaluation of SHAP explanations for consistency and interpretability.
- Improving security, privacy, testing, and deployment readiness.
- Exploring collaboration with clinical experts to assess usability and identify appropriate validation requirements. Cardiac Risk Navigator is currently a research prototype, not a clinically validated diagnostic tool. Its predictions and visualizations are intended for exploration and research, not for making medical decisions.
Our vision is to make cardiac AI more transparent, interactive, and understandable — moving beyond prediction towards meaningful interpretation.
Built With
- 3d-visualization
- artificial-intelligence
- cardiology
- clinical-data-analysis
- computer-vision
- data-science
- data-visualization
- explainable-ai
- fastapi
- healthcare
- html/css
- javascript
- machine-learning
- medical-ai
- next.js
- pdf-generation
- predictive-analytics
- python
- react
- rest-api
- scikit-learn
- shap
- web-development
- xgboost

Log in or sign up for Devpost to join the conversation.