-
-
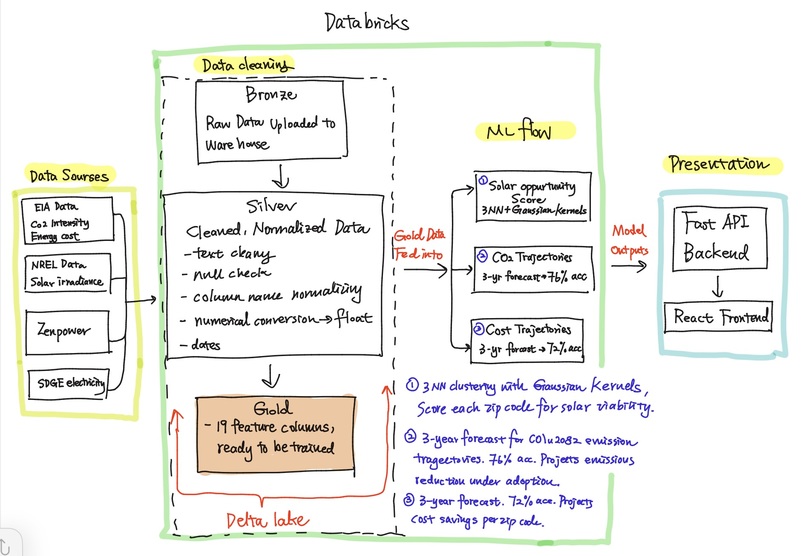
Project architecture
-
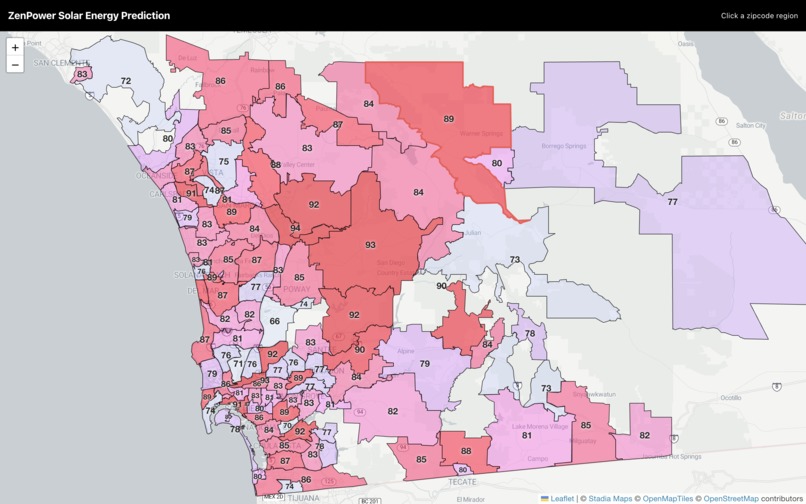
Demo1
-

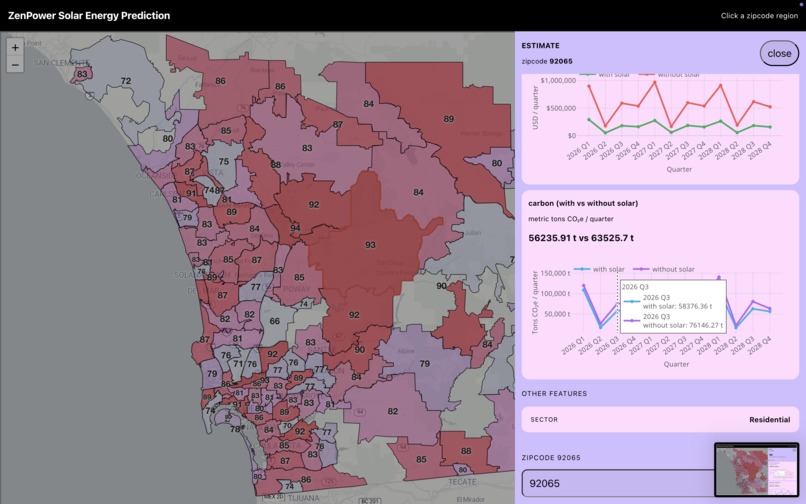
Demo2
-
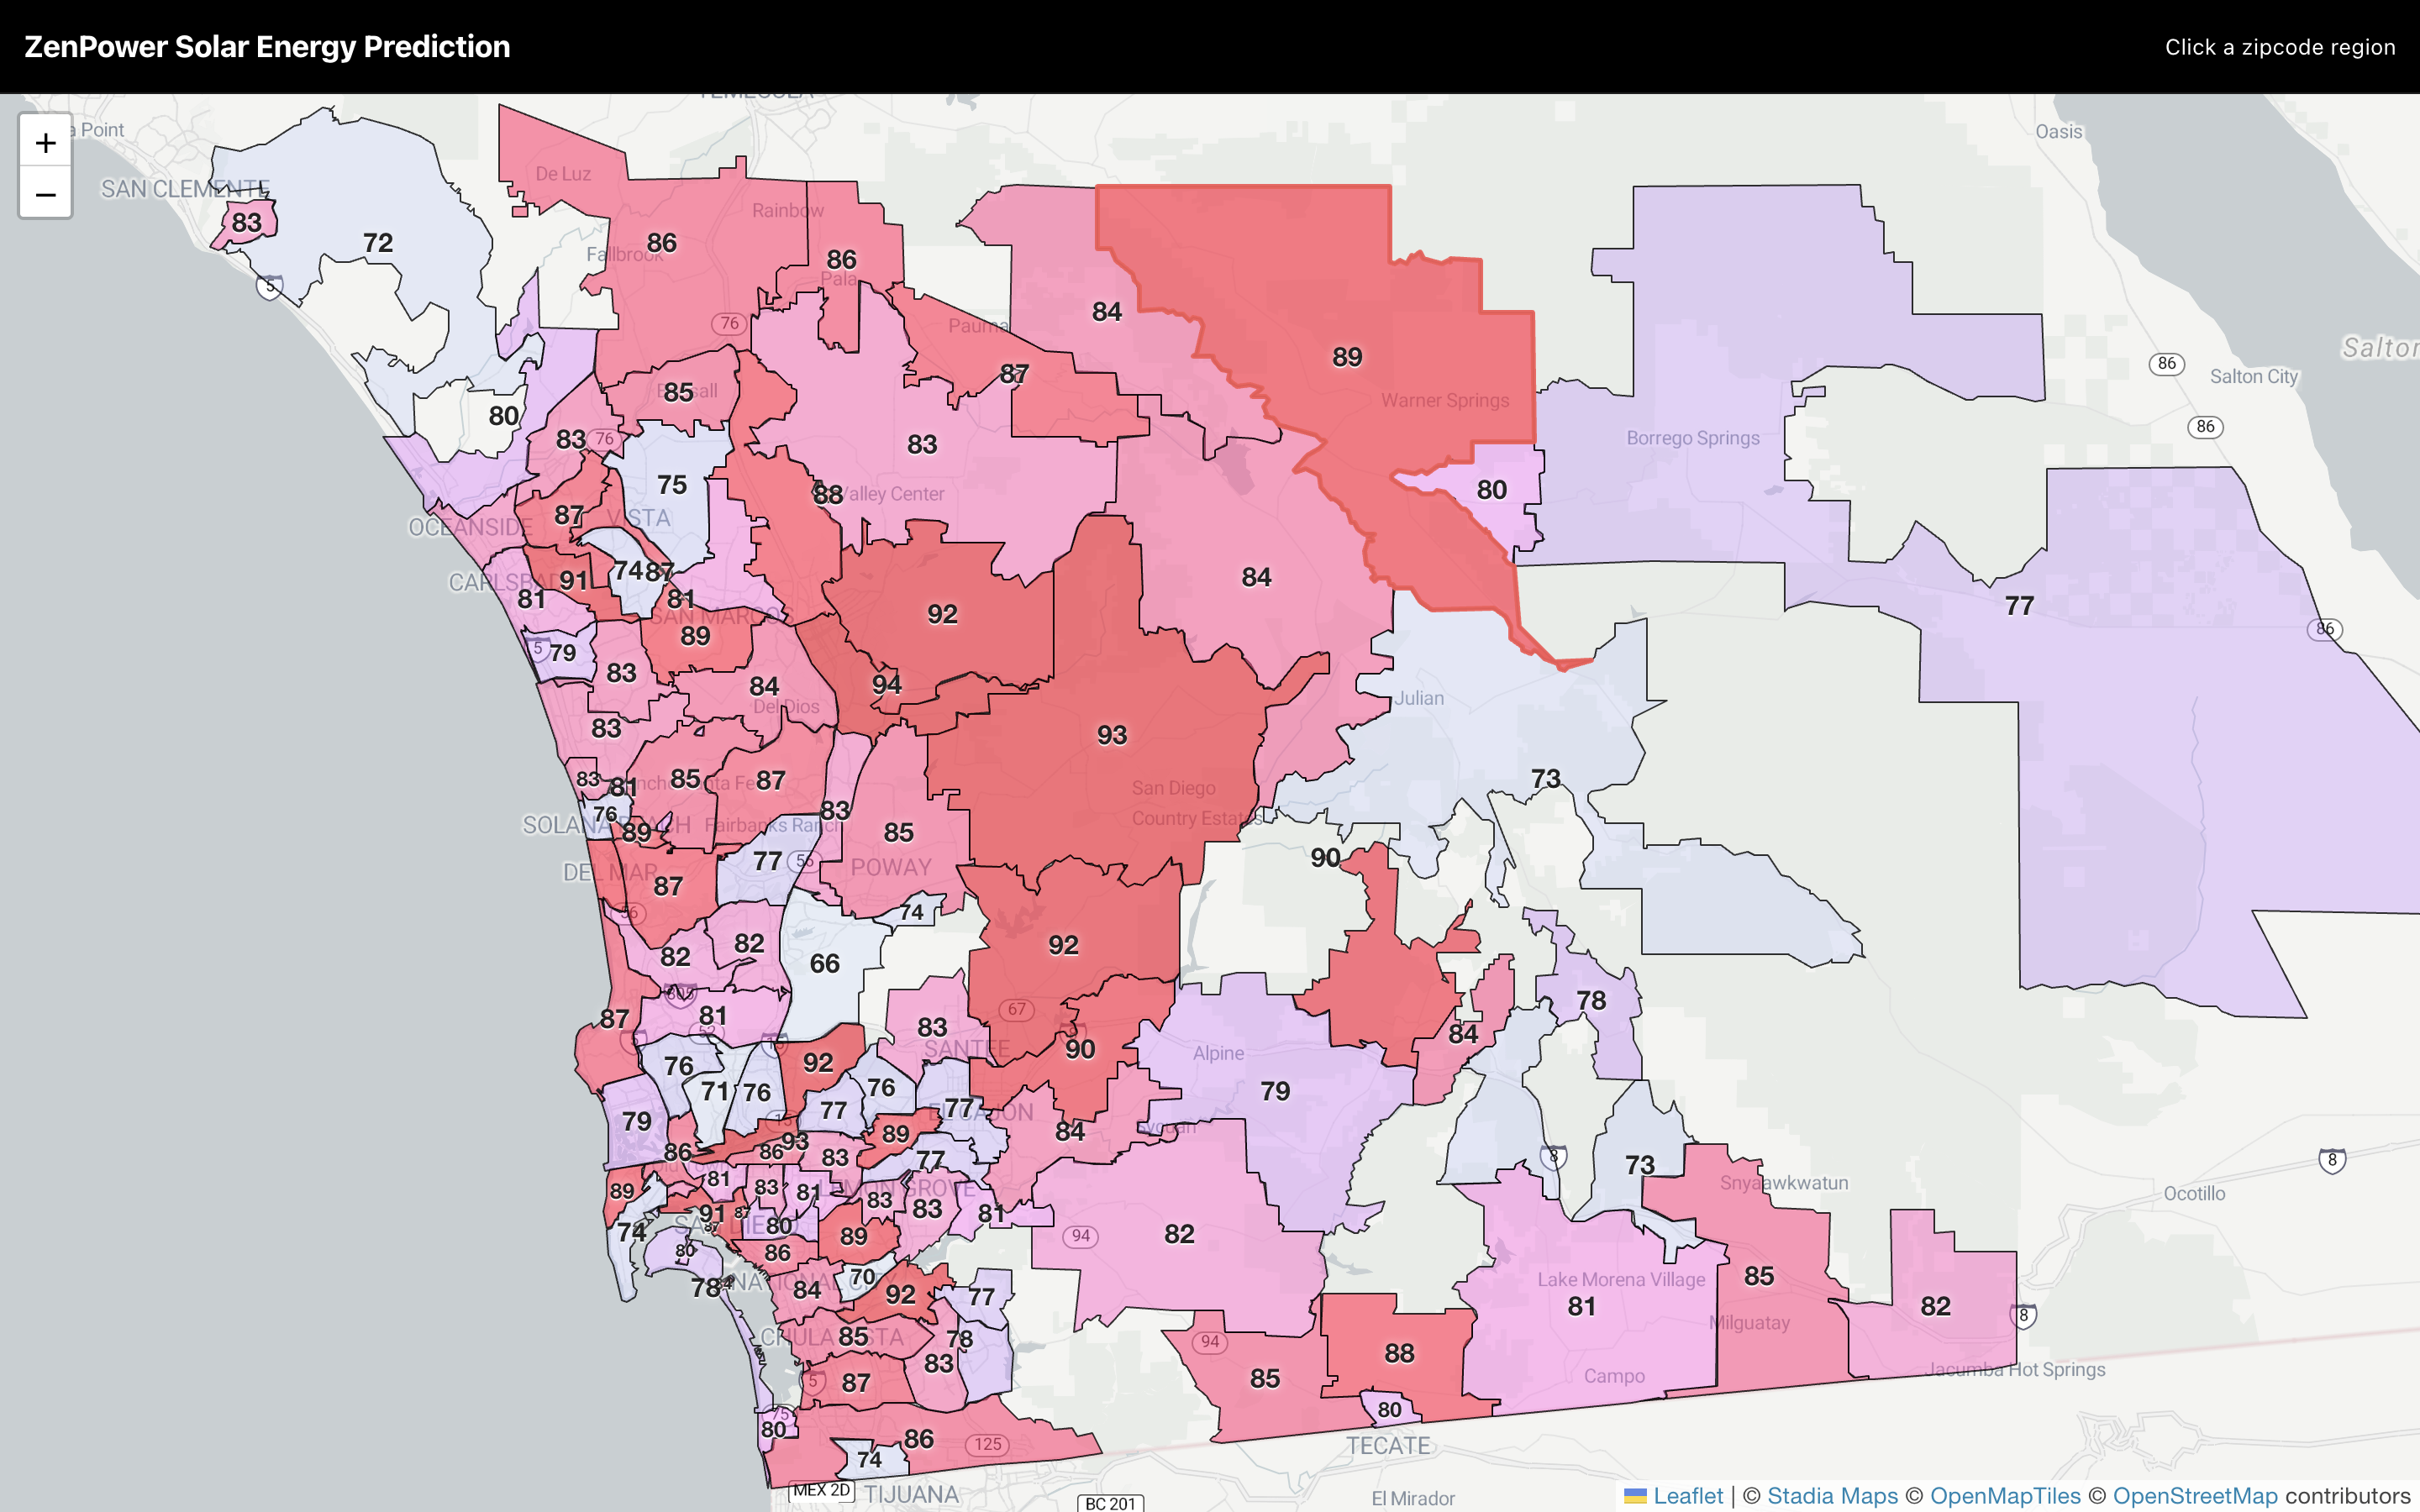
Demo3

Inspiration
San Diego has the most expensive electricity in the United States, with the average household paying nearly $400 /month. Solar energy is the obvious solution, but the tools to act on it have always been scattered across different platforms. We bring solar placement, savings estimates, and environmental impact together in one place, so you can see the full impact of your decisions.
What it does
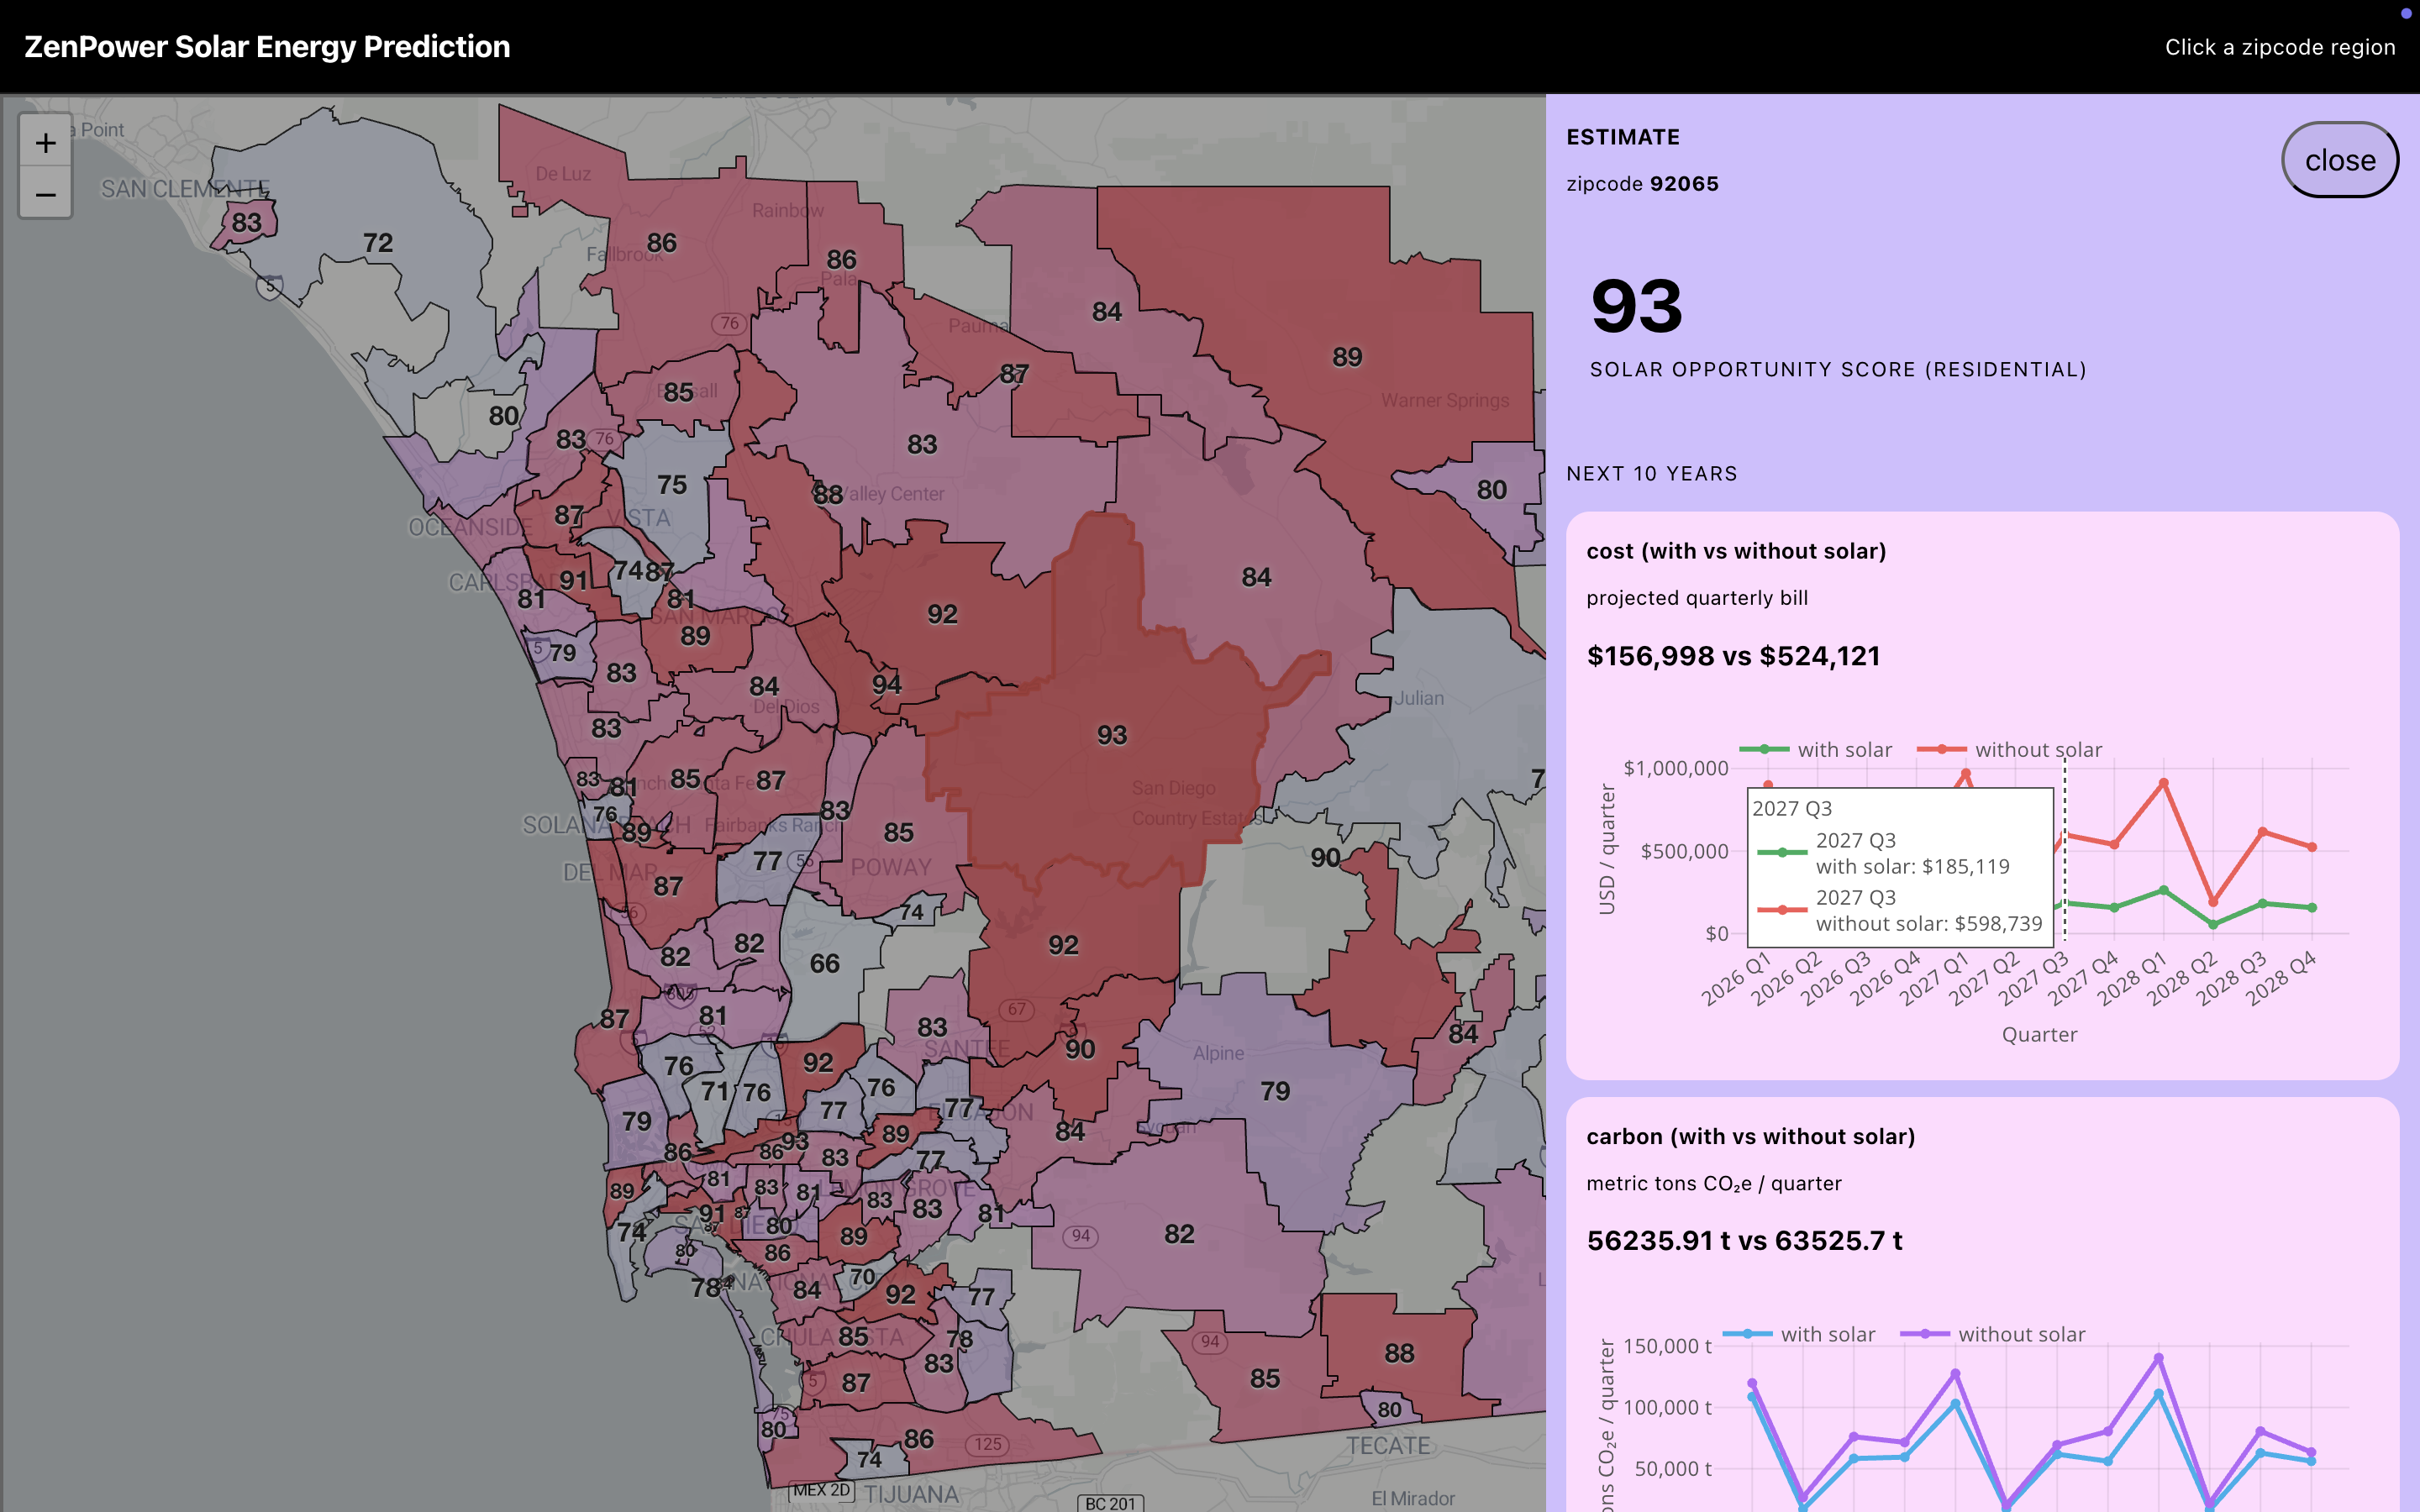
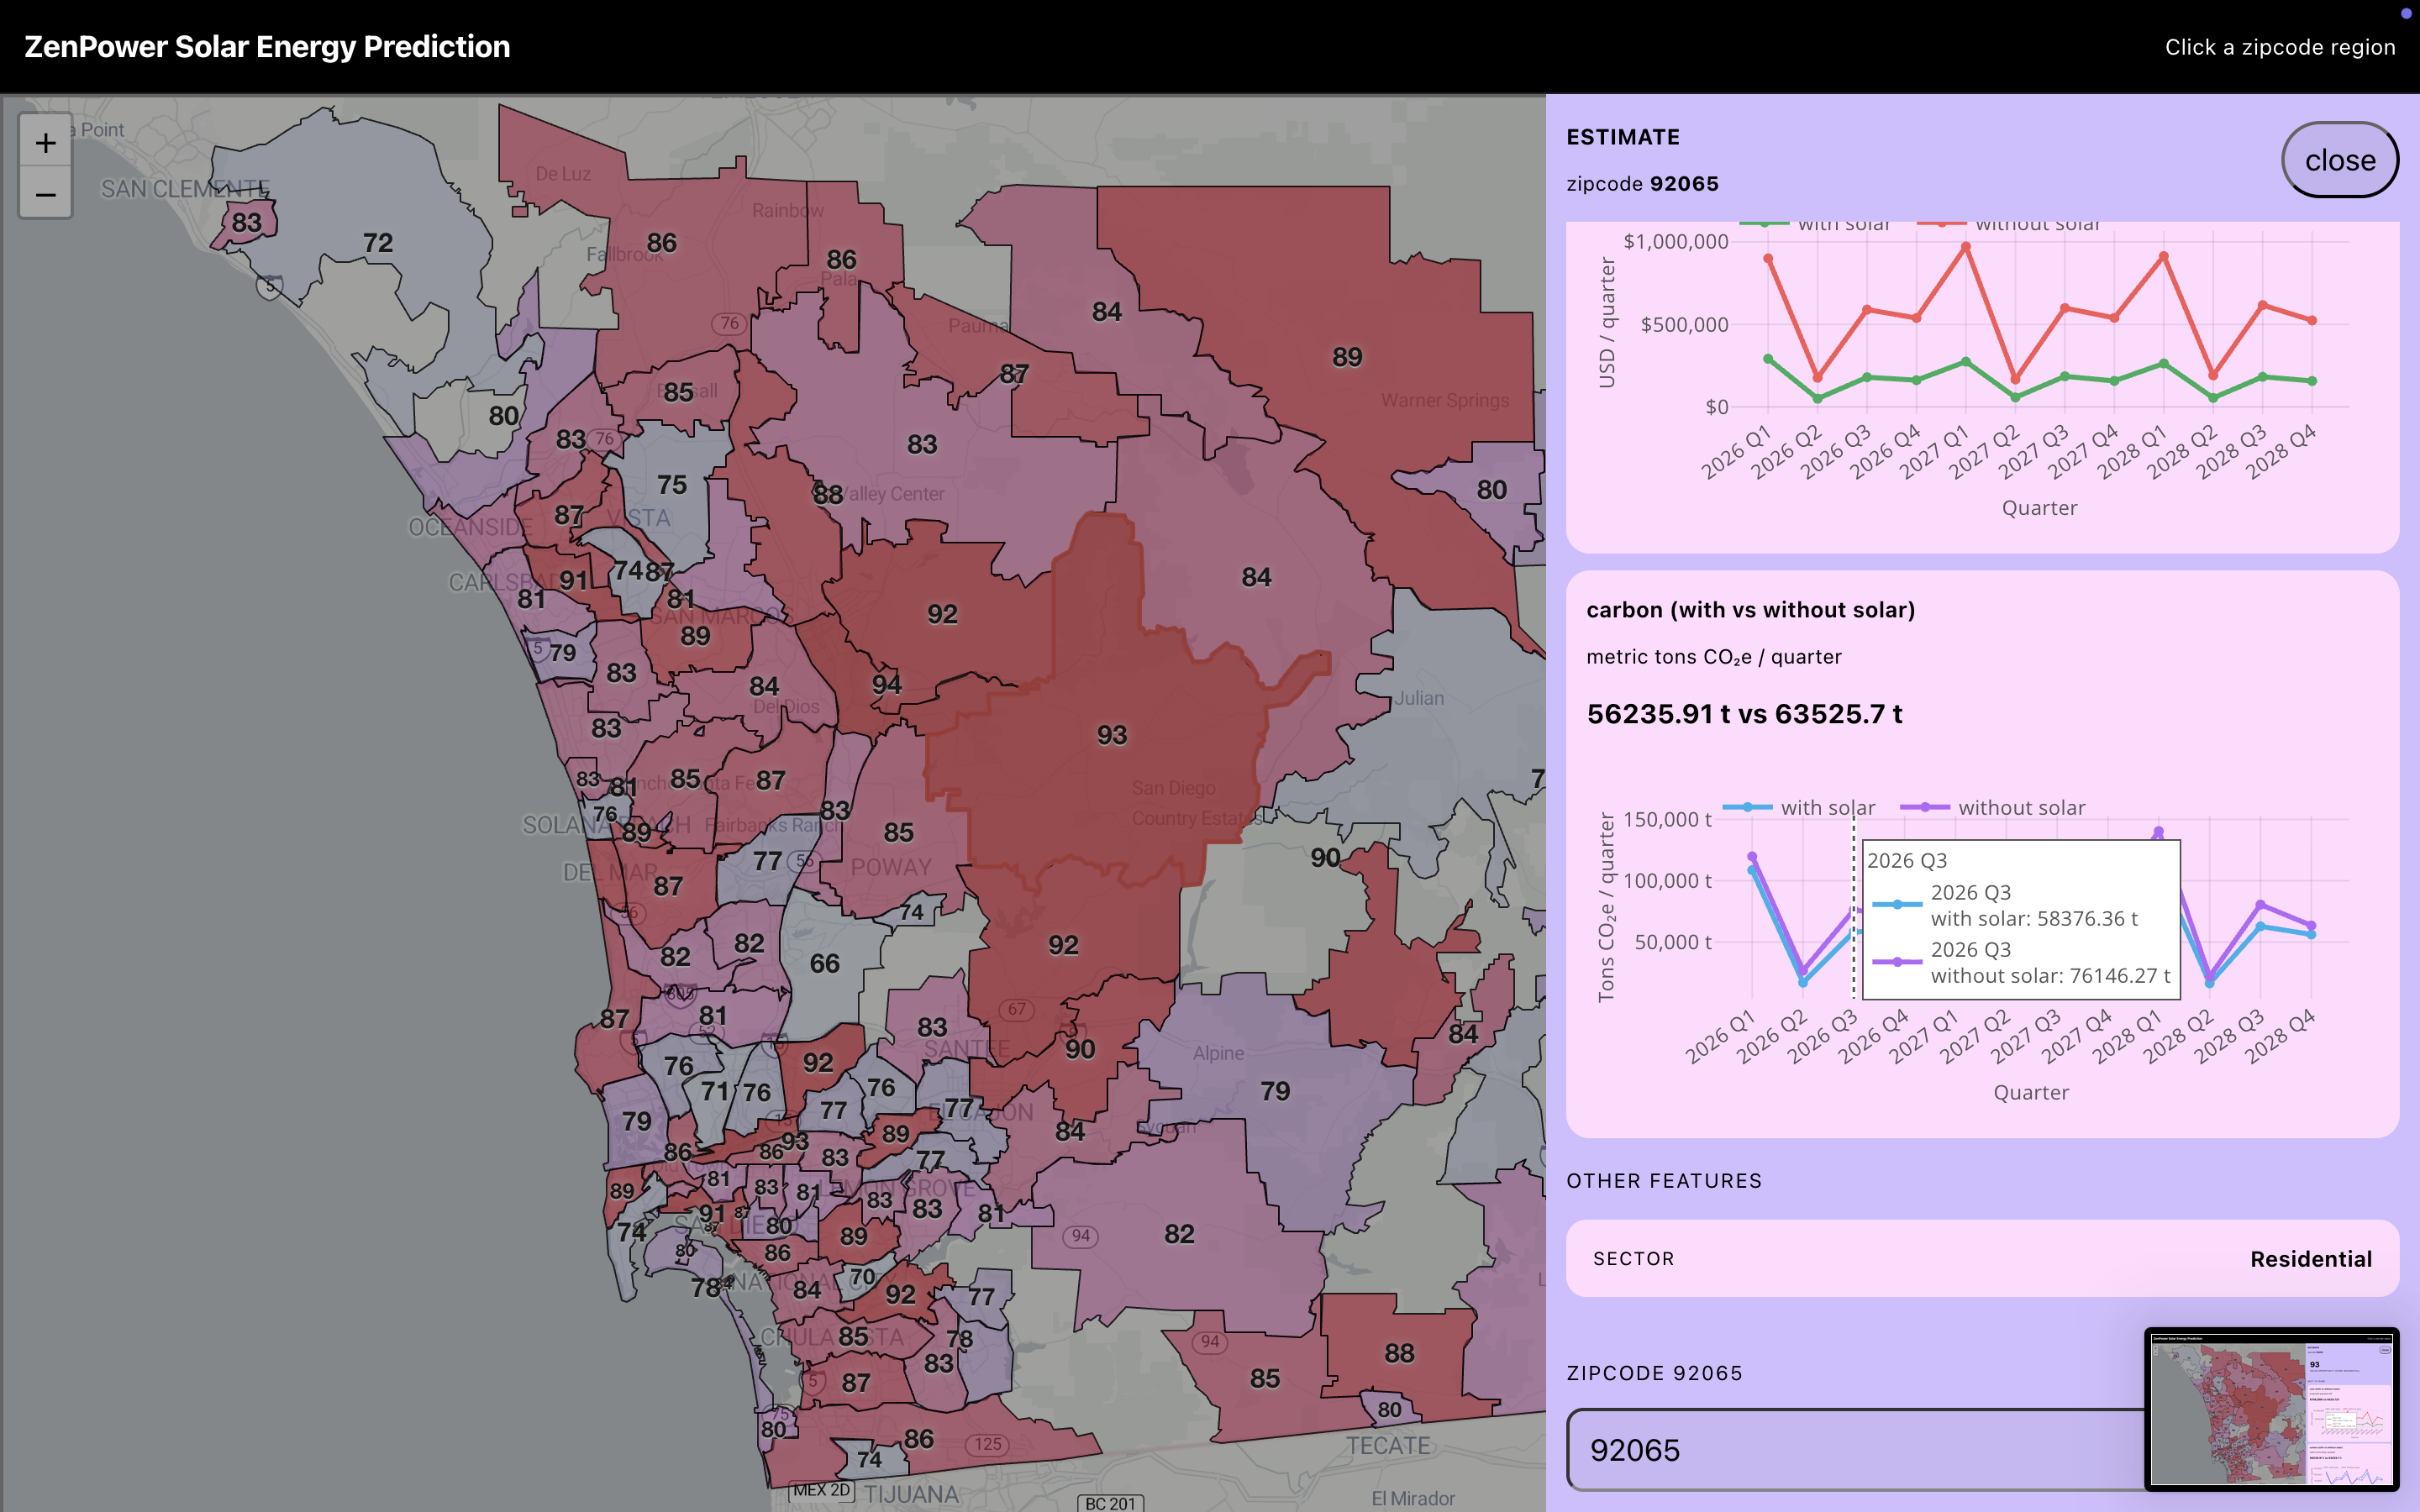
Solarify maps solar opportunity across every zip code in San Diego. Click any zip code to see a 10-year savings projection, CO2 impact, and a side-by-side energy bill forecast with and without solar. A what-if simulator lets you drag a slider to see in real time what happens as solar adoption increases — and a scoring system ranks every zip code by priority so you always know where to act first.
How we built it
We built a full end-to-end data pipeline across four real-world datasets - SDG&E for electricity consumption by zip code, EIA for commercial pricing, CO2 emissions intensity, and facility-level emissions across San Diego, NREL for Solar Irradiance data across ZIP Codes in San Diego, and ZenPower's own solar permit data for ground truth on where installations already exist.
All of this flowed into Databricks, where data was ingested, cleaned, for two ML models to do the heavy lifting. The first scores every zip code by solar opportunity - a new metric that we used to help ZenPower’s customer acquisition funnel, using consumption, cost, heat intensity, and adoption gaps. The second runs two forecasts - status quo predictions vs. solar-based predictions - so you can see exactly where the lines diverge. The output feeds a FastAPI backend serving our React frontend in real time.
Challenges we ran into
This project was not easy. We hit broken government APIs, We dealt with datasets that were too broad and non granular, and we had 52 quarterly CSV files to wrangle, four completely different data schemas to work across and combine, and a scope that honestly could have been a semester-long project. Oh, and there were two of us. Two people, four datasets, two ML models, a full backend, and a map-based frontend - all in one hackathon. But we were ambitious and quick to learn.
Accomplishments that we're proud of
Delivering a fully functional, end-to-end AI-powered analytics platform within the constraints of a single hackathon. The final product integrates four real-world datasets, two machine learning models, a FastAPI backend, and a map-based React frontend, built by a two-person team from the ground up.
What we learned
We learned Databricks from scratch during this hackathon: Delta Tables, Spark DataFrames, Mosaic AI - building on top of what we were already familiar with (i.e. Jupyter Notebooks). We learned that real-world data is messy, government APIs go down, and scoping a data project is genuinely hard when you have too many interesting datasets and not enough time. Most importantly, we learned that the data tells a compelling story on its own. Our job was just to make it visible, and we hope we did exactly that!
What's next for Solarify
Expanding beyond San Diego to other high-cost electricity markets, integrating real-time utility pricing, and building a direct path from insight to action — connecting users with installers, incentives, and financing options so a zip code click becomes the first step toward actually going solar.
Built With
- databricks
- fastapi
- leaflet.js
- mosaicai
- pandas
- prophet
- python
- react
- scikit-learn

Log in or sign up for Devpost to join the conversation.