Our Mission
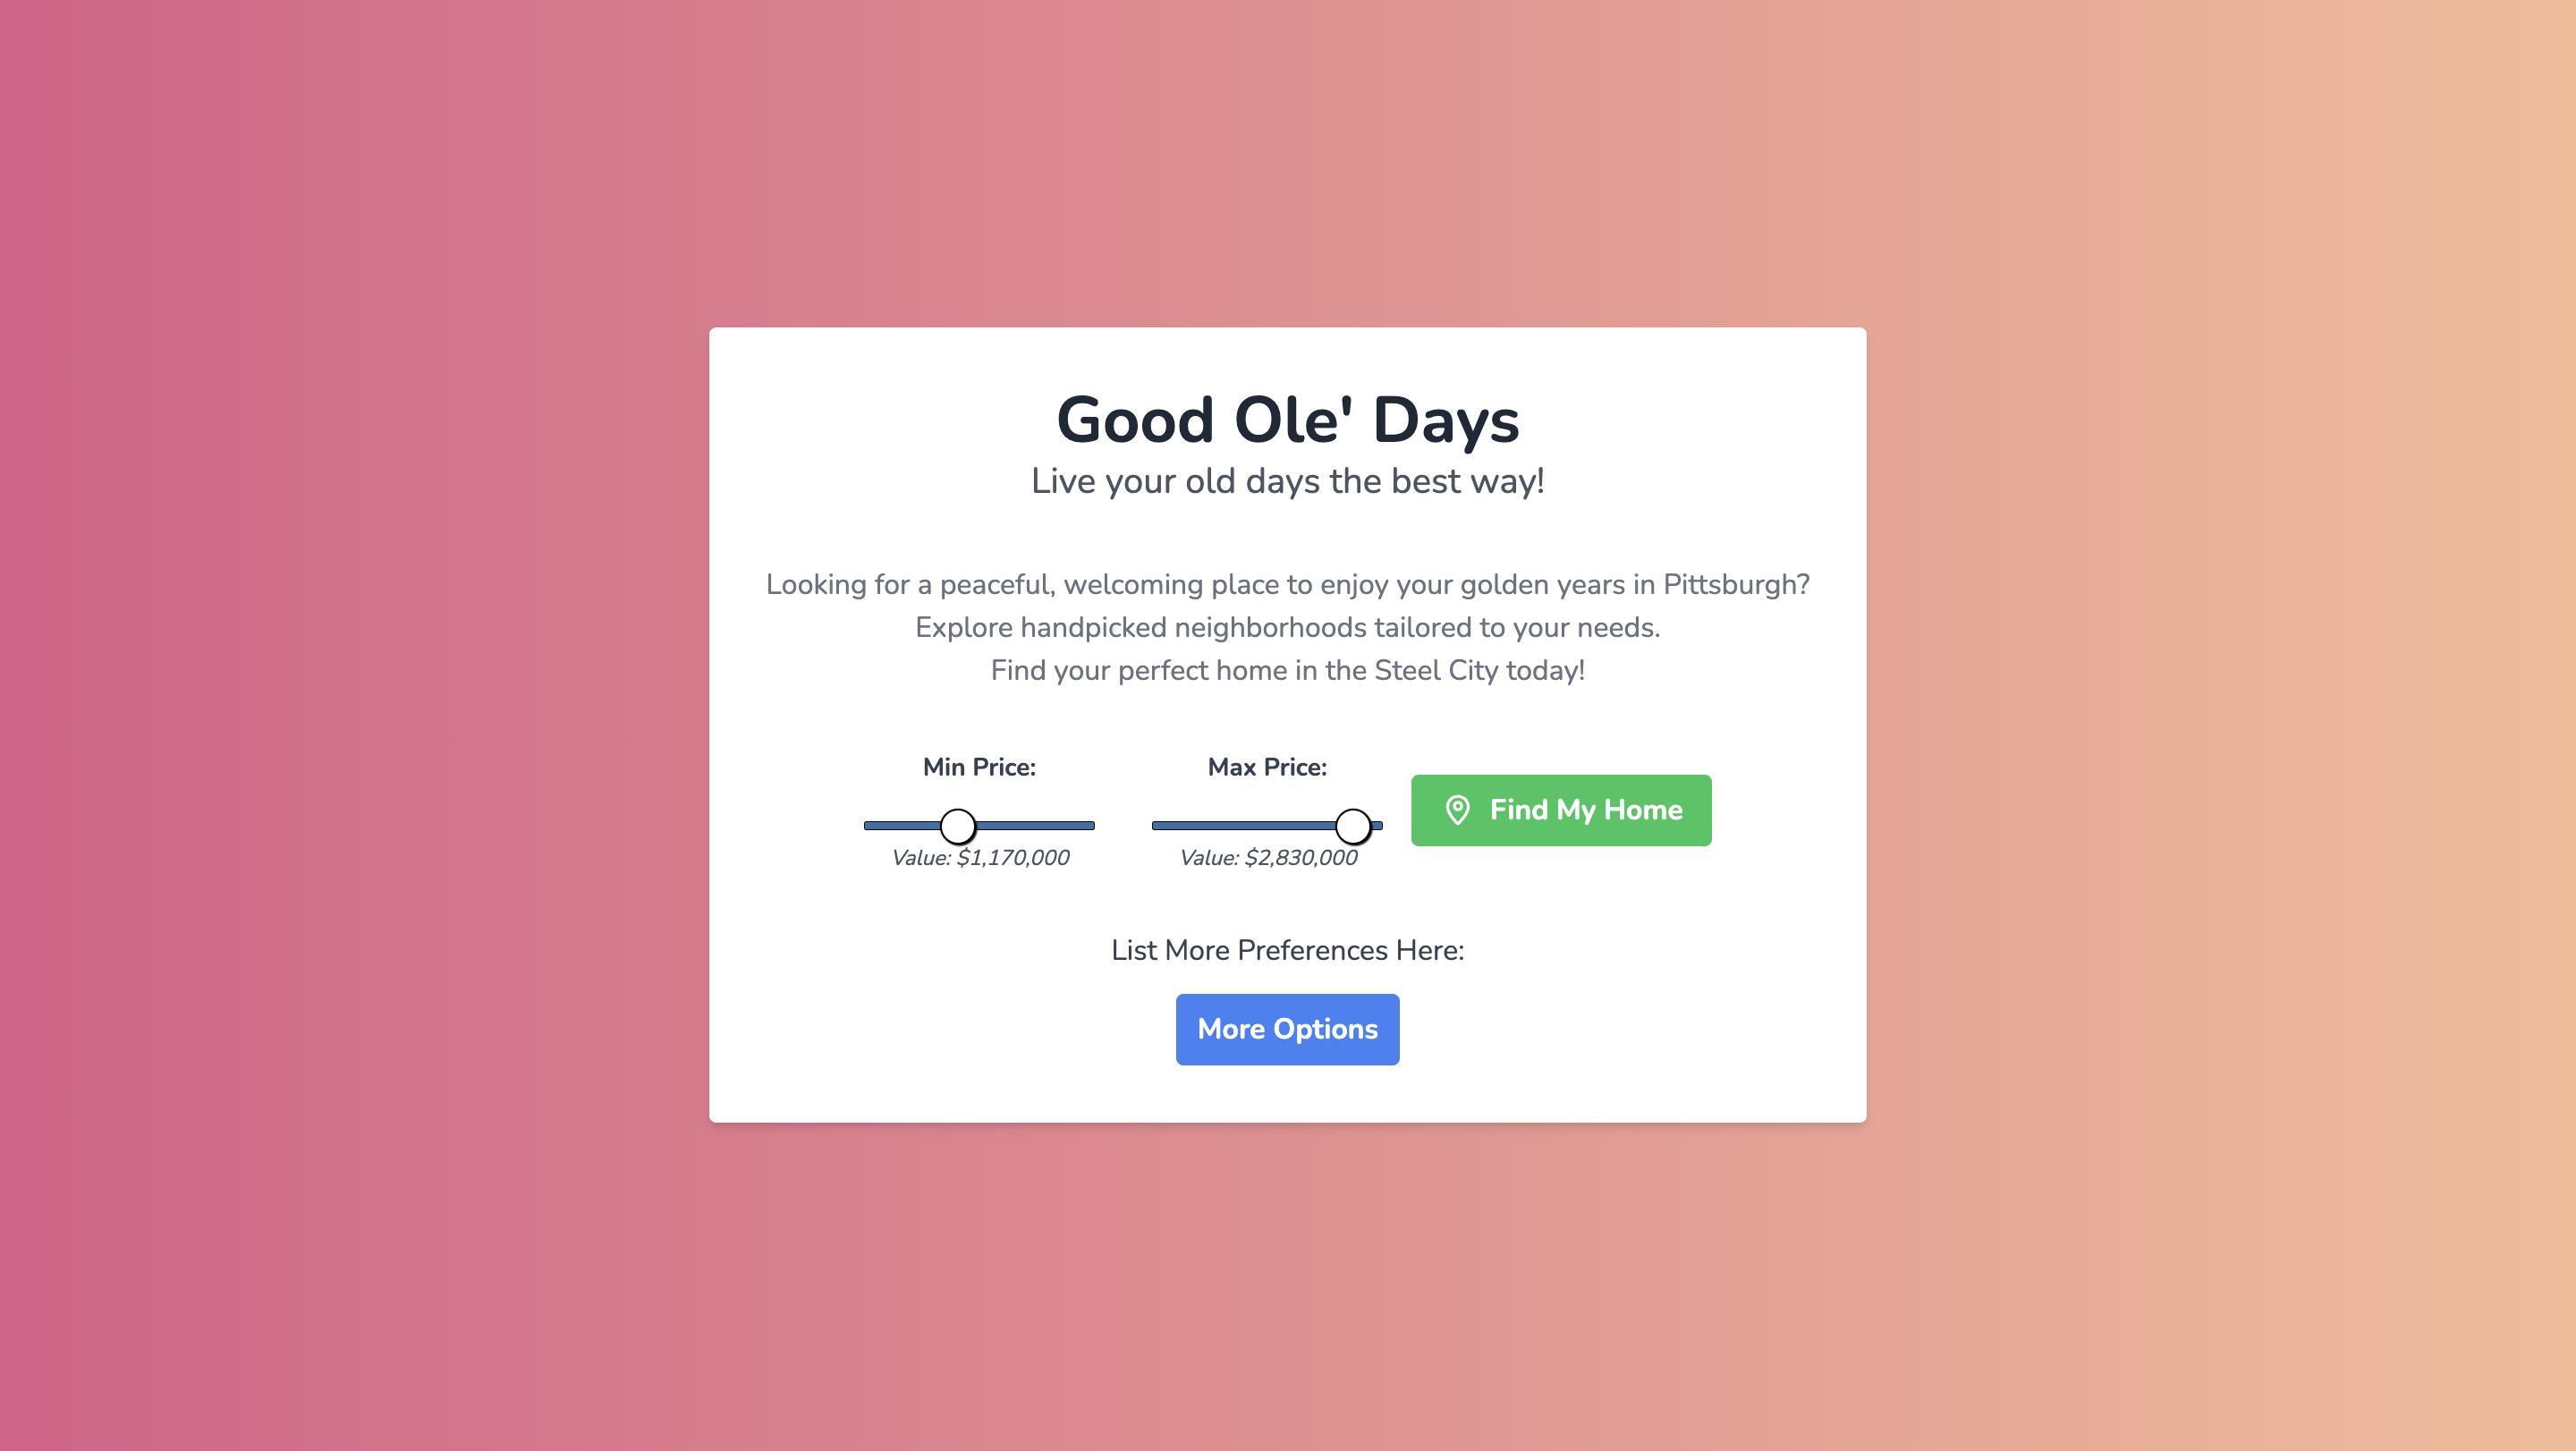
We set out to create a project focused on helping seniors find suitable places to live. We took into account various factors including proximity to necessities like healthcare facilities and grocery stores, home size, price and layout.
We used open source datasets and Python's data science and ML libraries to create a "senior livability score" of over 93,000 Pittsburgh residences.
How it Works
Our application uses machine learning to evaluate residential properties for senior living suitability:
Data Collection
We gathered comprehensive data on over 93,000 Pittsburgh residential properties, including:
- Property characteristics (size, condition, number of stories, fair market value)
- Geographic coordinates for proximity calculations
- Neighborhood and facility data from the Western Pennsylvania Regional Data Center
Proximity Score
Using the Overpass API, we calculate proximity scores for essential amenities within a 5-mile radius of each property:
- Medical facilities: Hospitals, clinics, pharmacies, urgent care centers
- Grocery stores: Supermarkets, drugstores
- Recreation: Parks, community centers, gyms, fitness facilities
- Entertainment: Libraries, theaters, museums, cultural venues
Our proximity score uses inverse distance weighting, giving higher scores to properties with both nearby amenities and a good variety of options.
Senior-Focused Livability Score
We developed a composite "livability score" using Principal Component Analysis (PCA) that weighs multiple factors important to seniors:
- Accessibility: Preference for single-story homes and good property condition
- Affordability: "Bell curve" scoring that favors homes near the median price point
- Right-sizing: Preference for moderately-sized homes (not too large to maintain) with less stories (easier for seniors to move around)
- Convenience and Access: High proximity scores for medical, grocery, recreation, and entertainment amenities
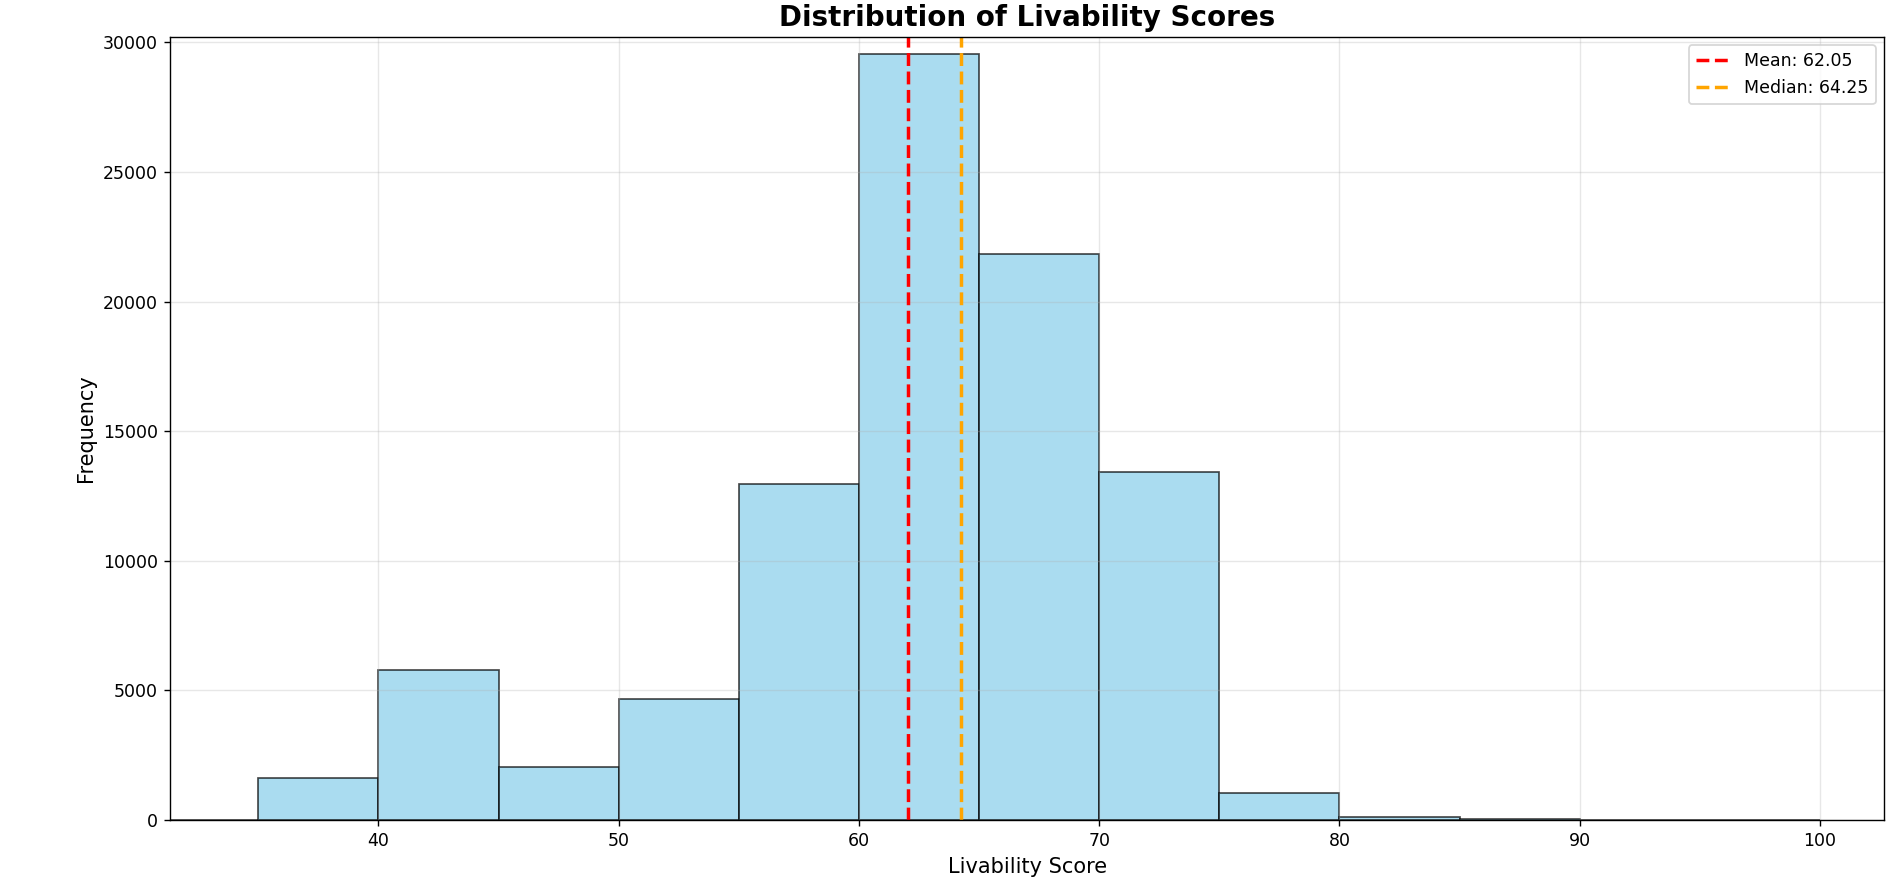
The final livability score is scaled from 0-100, with higher scores indicating properties better suited for senior living.
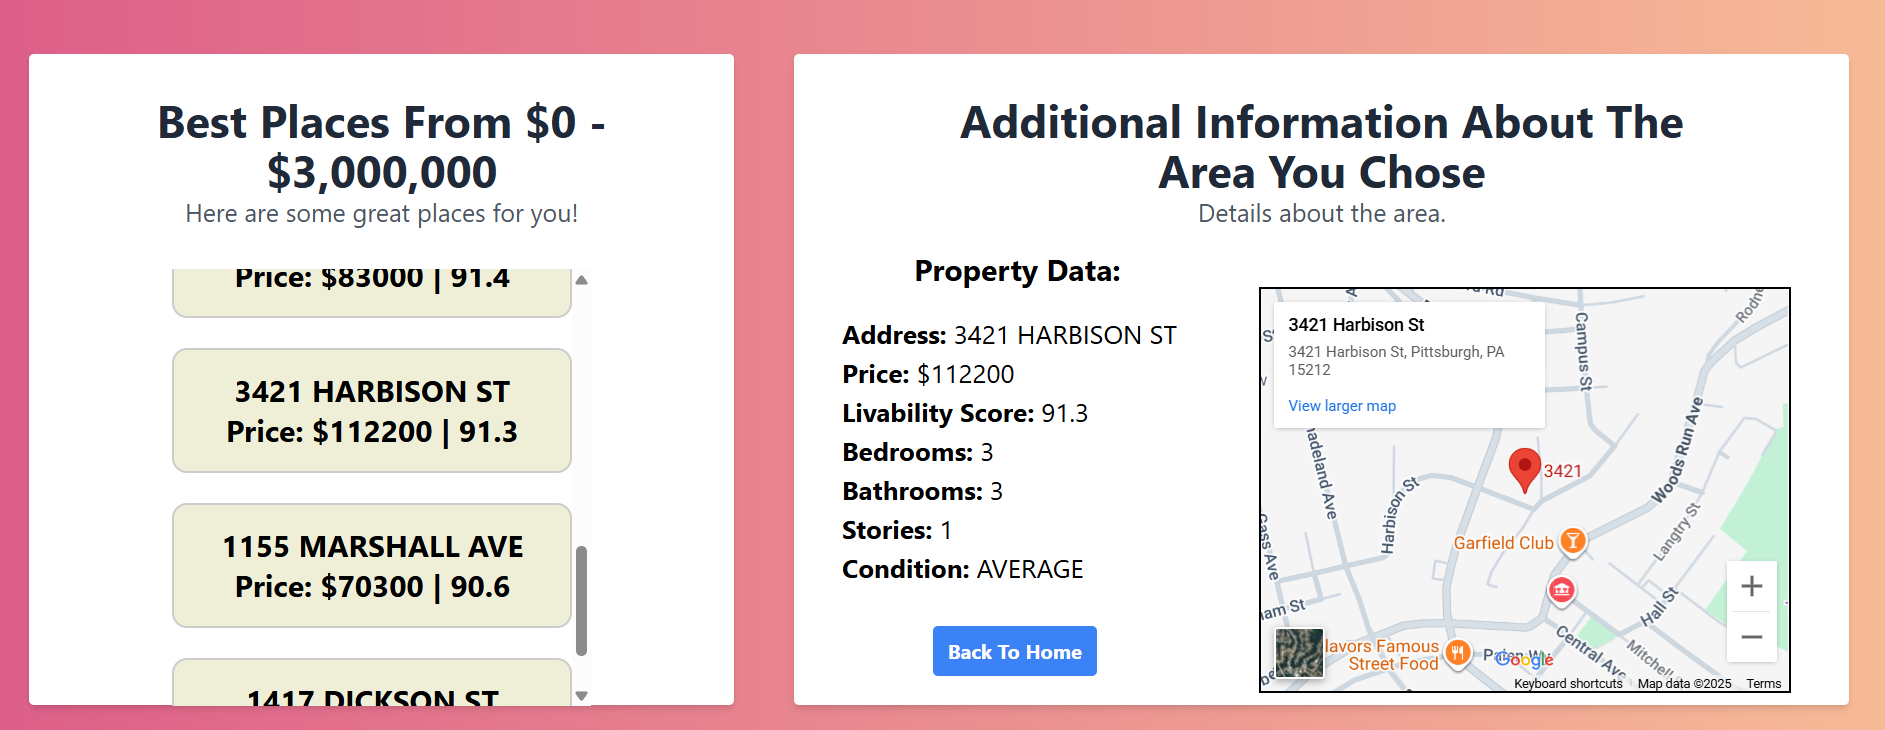
The score allows users to quickly identify the most suitable options from thousands of available properties.
Technical Details
Tech Stack
The backend for this project is a simple Flask app. The frontend was coded in HTML, JS, and CSS, with some Tailwind styles added.
Data Collection and Cleaning
The main dataset we used for this project consists of residential addresses with a "Pittsburgh" zip code (~93K houses) as of September 2025. See the README in backend/datasets for the complete list.
This was the largest and highest quality dataset we could gather from a free API! It was more than enough data to provide a minimum viable product for this hackathon! Shoutout to the WPRDC.
Machine Learning
Our machine learning approach consists of two main components: proximity scoring and composite livability scoring.
Proximity Scoring (prox.py)
We calculate proximity scores for each property by analyzing nearby amenities using the Overpass API (OpenStreetMap data). Since querying 93,000 individual addresses would be computationally expensive (and largely redundant), we use zipcode centroids - the geographic center point of each zip code area. This reduces our queries from 93,000 to just 28 unique zip code locations while maintaining reasonable accuracy for proximity calculations.
Since some zip codes vary in area, we looked for a dataset where the centroids are weighted by population. This way, the majority of people live close to the centroid, so the proximity calculations would be a solid estimation. the proximity calculations would be a more accurate estimate.
We discovered and used a population-weighted zipcode centroid dataset from the United States Department of Housing and Urban Development (link in
backend/datasetsREADME).
For each zipcode centroid, we query four categories of amenities within a 5-mile radius:
- Medical facilities (hospitals, clinics, pharmacies)
- Grocery stores (supermarkets, markets)
- Recreation facilities (parks, gyms, community centers)
- Entertainment venues (libraries, theaters, museums)
Our proximity scoring algorithm uses inverse distance weighting, where closer amenities contribute more heavily to the overall proximity score:
The distance weight is calculated as:
$$ \text{proximityWeights} = \sum_{i=1}^{n} \frac{1}{1 + d_i} $$
where \(d_i\) is the distance in miles to amenity \(i\).
The final proximity score combines both quantity and proximity:
$$ \text{proximityScore} = \min(100, \tanh(\frac{\text{proximityWeights}}{30}) \times 35 + \tanh(\frac{\text{count}}{30}) \times 65) $$
The \(tanh\) function provides natural diminishing returns, preventing a few very close amenities from dominating the score.
Composite Livability Score (pca.py)
We use Principal Component Analysis (PCA) to create a single "livability score" from multiple property features. PCA is a way to reduce the dimensionality of data and find the linear combination of features that explains the most variance in the data. PC1, the first principal component, is often the best way to represent a "composite score" given multiple metrics that may or may not be correlated.
Our input features are:
- Stories (flipped): Negative number of stories (single-story homes score higher)
- Condition (flipped): Negative condition ranking (better condition scores higher)
- Price bell score: Bell curve around median price (sweet spot of affordability and quality)
- Size bell score: Bell curve around median square footage (sweet spot of comfort and easy home maintenance)
- Proximity scores: Medical, grocery, recreation, and entertainment scores
The PCA process:
- Standardize features using
StandardScaler(mean=0, std=1) - Apply PCA with 1 component to create composite score
- Scale final scores to 0-100 range using
MinMaxScaler
The PCA Score is calculated as follows:
$$ \text{PCA} = \mathbf{w}^T \mathbf{x} $$
where \(\mathbf{w}\) is the principal component vector (8 metrics) and \(\mathbf{x}\) is the standardized feature vector.
This approach automatically determines the optimal weighting of each feature based on how they vary together in the dataset, creating a single score that captures the most important patterns in senior-friendly housing characteristics.
This was my (Joe's) first project applying data science/ML techniques to a real-world dataset, and I learned a lot!
Future Plans
We plan to expand our dataset and functionality to include:
- MLS/Zillow listings for houses that are currently for sale
- Apartments.com real-time rent data for rental properties
- Senior living communities and senior-friendly apartment complexes
- Real-time market data to provide up-to-date pricing and availability information
- Crime data to include a safety metric in our composite score


Log in or sign up for Devpost to join the conversation.