-
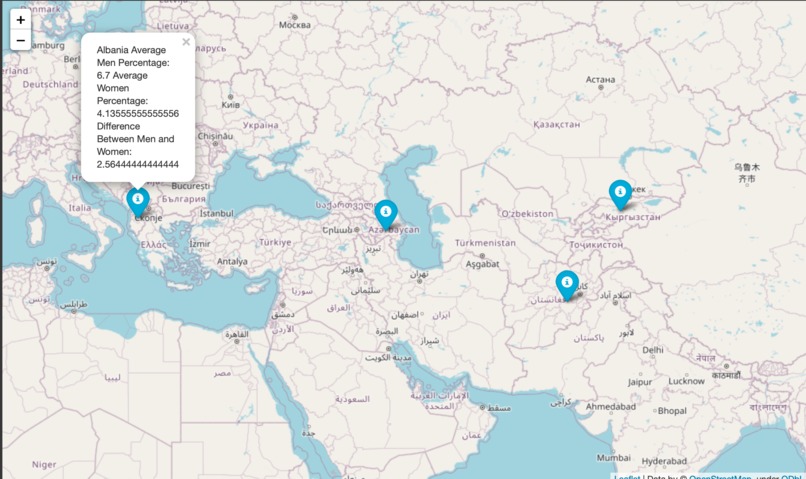
interactive map showing the location and data of domestic violence
-
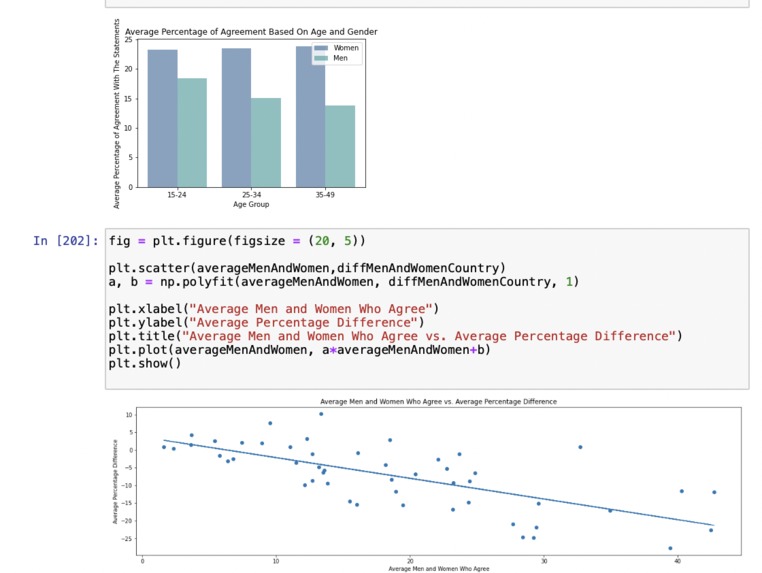
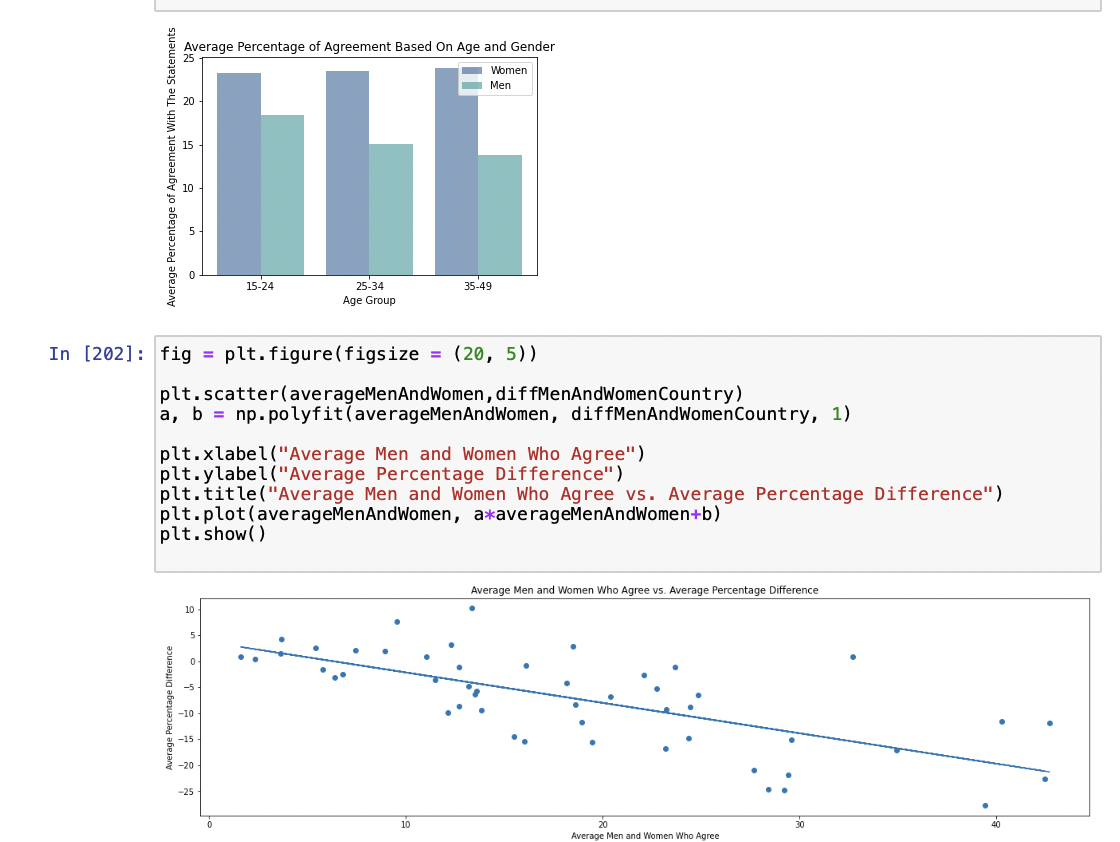
snippet of the code and graphs of the data vizualization
-
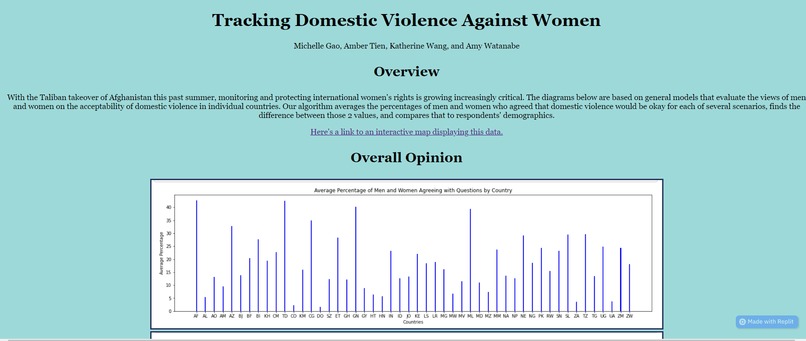
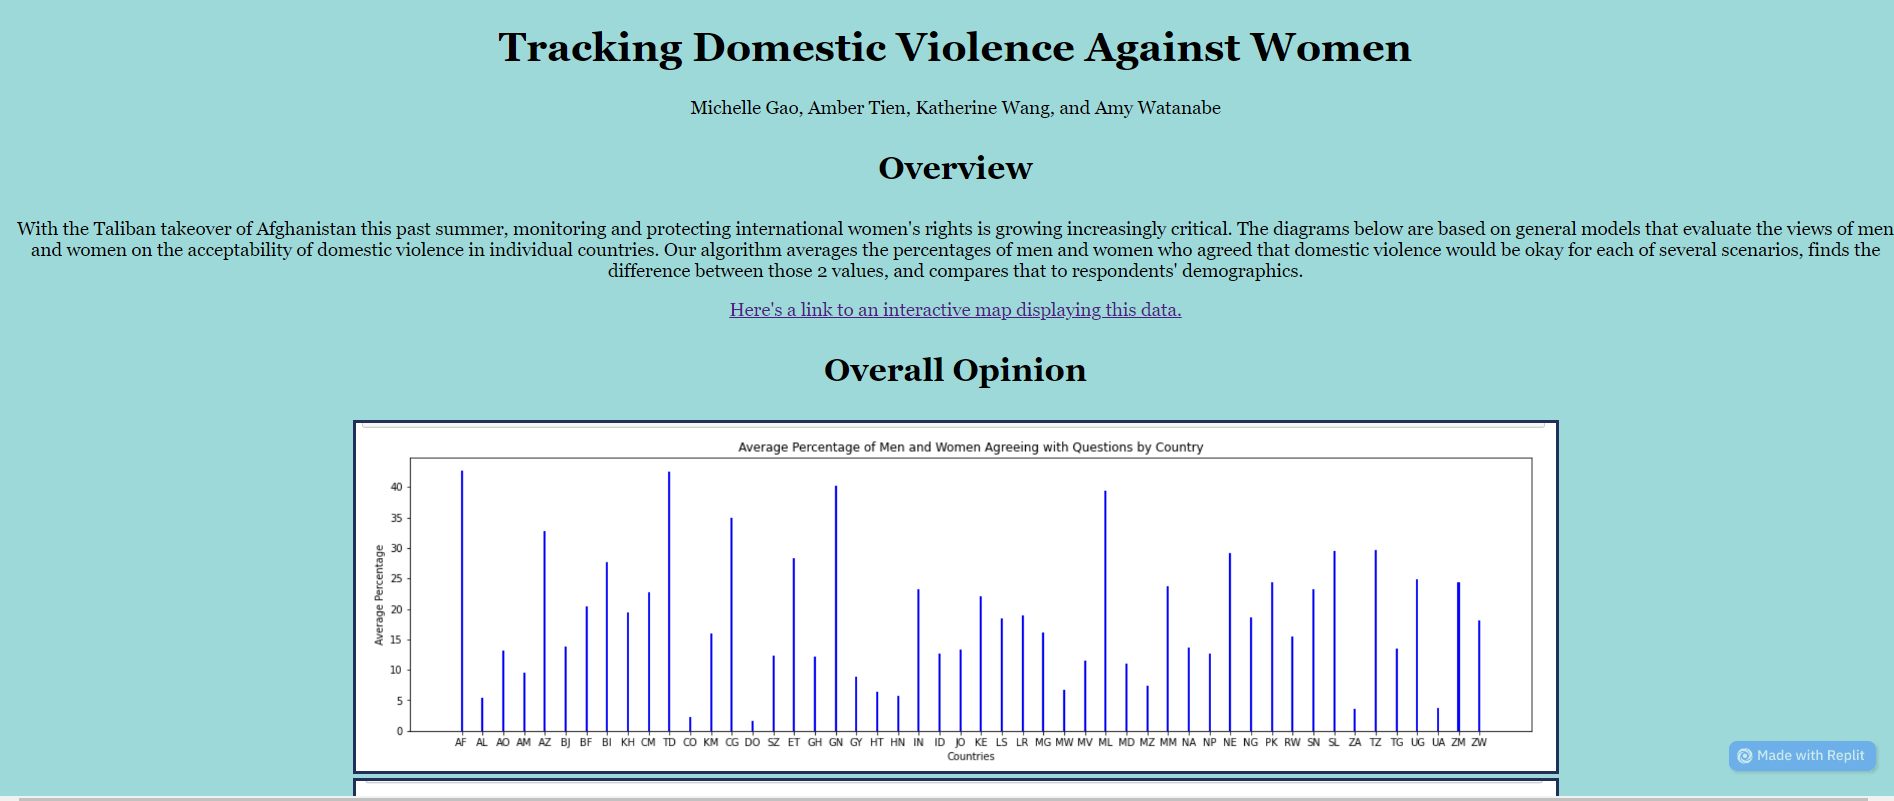
screenshot of the website
-
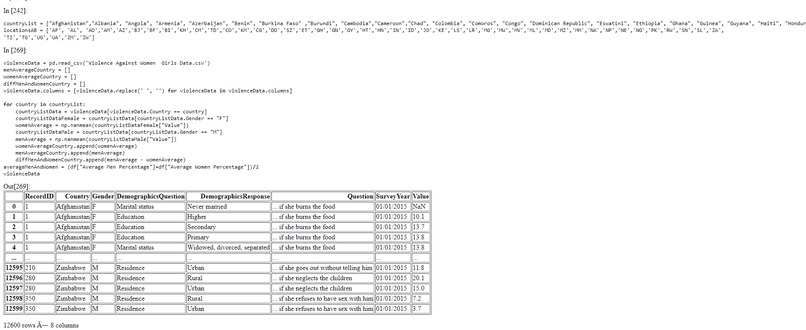
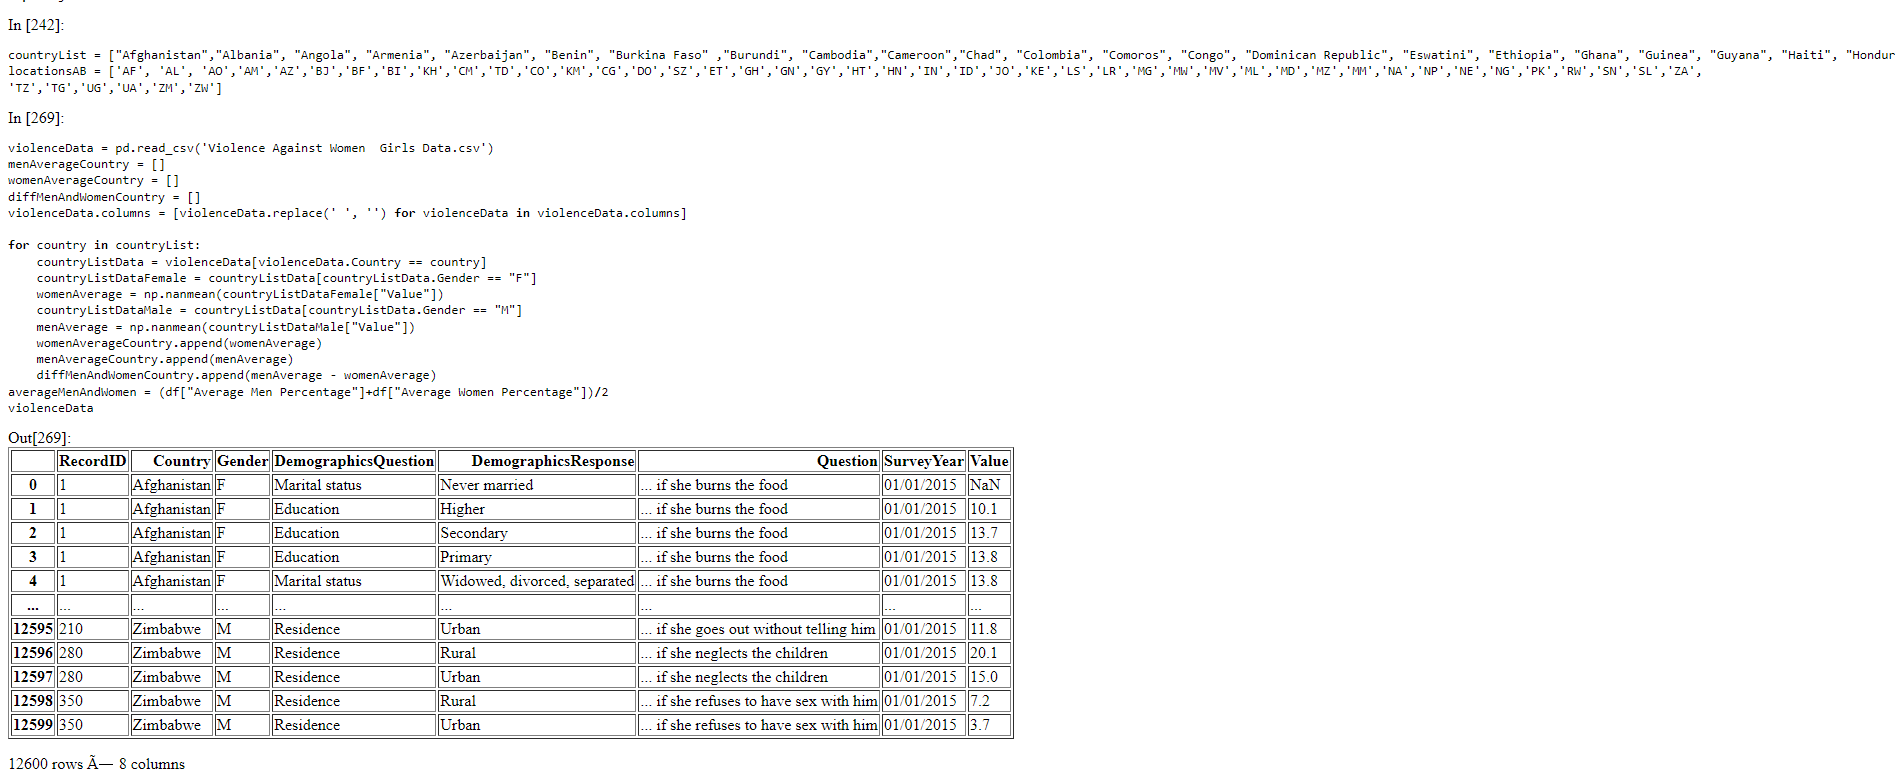
html file of jupyter notebook code

Inspiration
We are concerned about domestic violence against women and decided to create something to help bring awareness to the treatment of women outside of the United States. At times, we forget the structures of society outside of our own, by having these objective statistics and transparent data, the user will hopefully be called to take action against domestic violence worldwide.
What it does
This website uses data visualization to help understand trends in domestic violence around the world and involves an interactive map to track the locations.
How we built it
We used jupyter notebook and folium in python to create the interactive map. For the website we used HTML, javascript, and CSS. We used python pandas to analyze the data and create graphs and trends.
Challenges we ran into
We had to change our idea multiple times to make sure it could be completed on time. We also had to learn a lot of new languages and used lots of new things such as jupyter notebook and python pandas. But overall, these challenges were great in learning how to adapt quickly.
Accomplishments that we're proud of
We are proud of our website that we created with code and our data graphs and coded map. We believe that it'll make a genuinely good impact on helping women fight against domestic violence!
What we learned
We learned a lot of new languages, time management, and how to work together as a team. In addition, we learned more about how to bring awareness and education into the lives of others.
What's next for Tracking Domestic Violence Against Women
In the future, it could be turned into an app so it's more convenient to use and track locations.


Log in or sign up for Devpost to join the conversation.