Inspiration
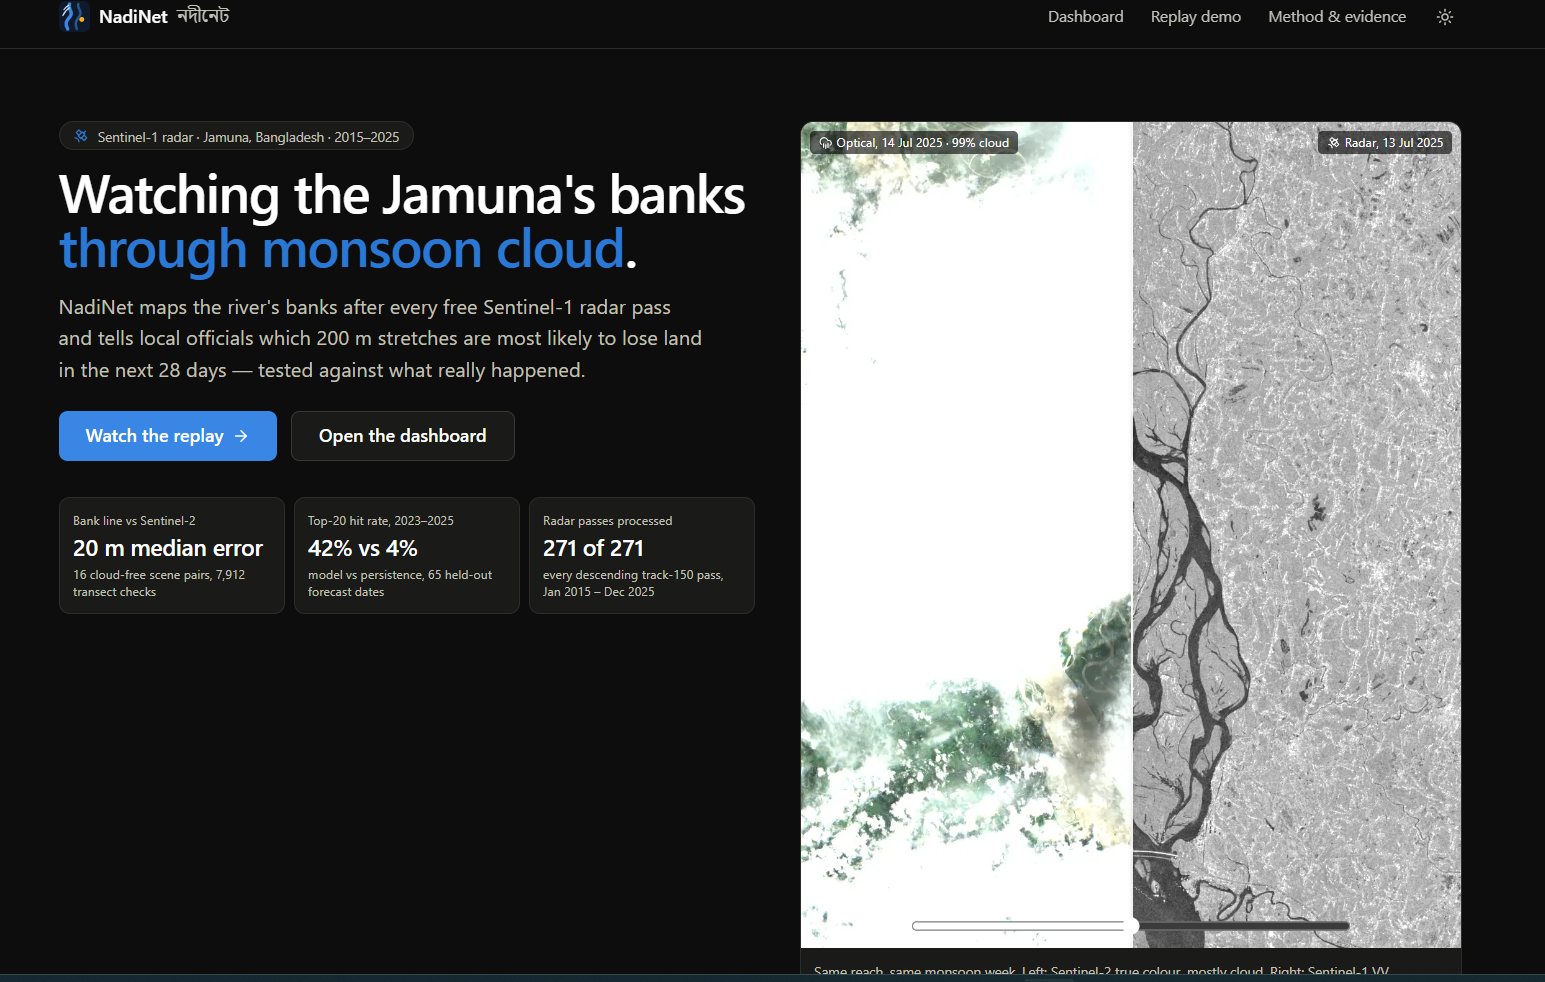
Every monsoon, the Jamuna takes homes, farmland and embankments in Bangladesh. Riverbank erosion is estimated to displace 50,000–200,000 people a year in the country. The cruel timing is that most of the damage happens between June and October, exactly when optical satellites see nothing but cloud and survey boats cannot safely work on the river.
CEGIS has published respected annual erosion predictions since 2004, made from pre-monsoon imagery. We asked a narrower question: can free radar, which sees through cloud, watch the banks after every satellite pass during the monsoon and tell local officials which stretches are next — and can we prove it works on years the model never saw?
What it does
NadiNet watches an ~83 km reach of the Jamuna (Kazipur to Chauhali, Sirajganj and Tangail) with Sentinel-1 radar:
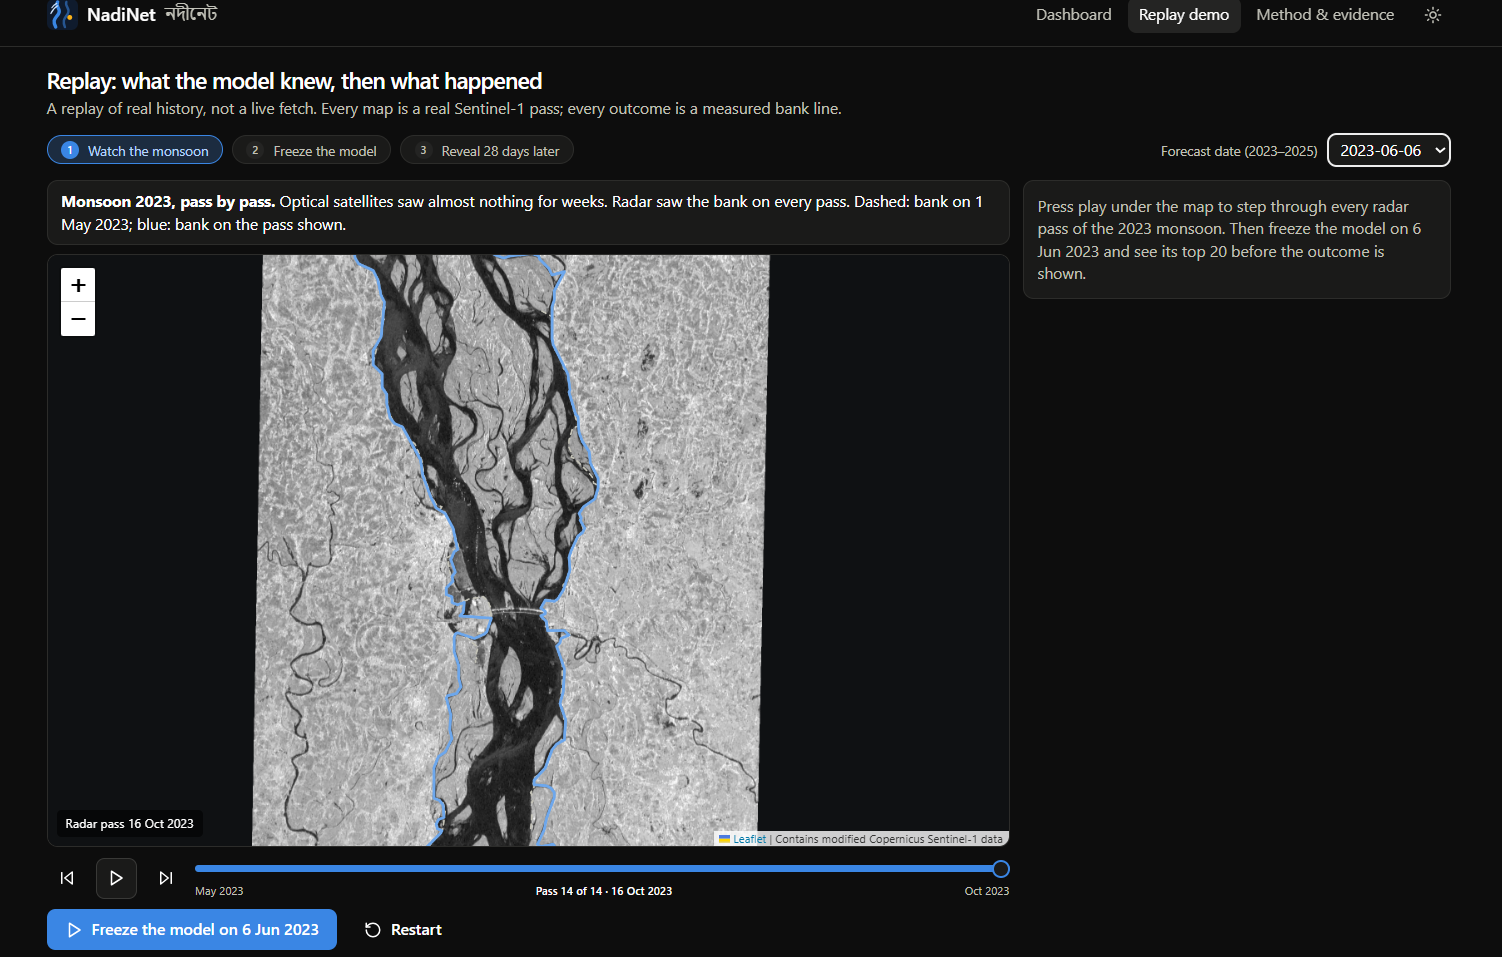
- Detection: after each radar pass, it redraws both mainland banks at 10 m resolution, cloud or no cloud.
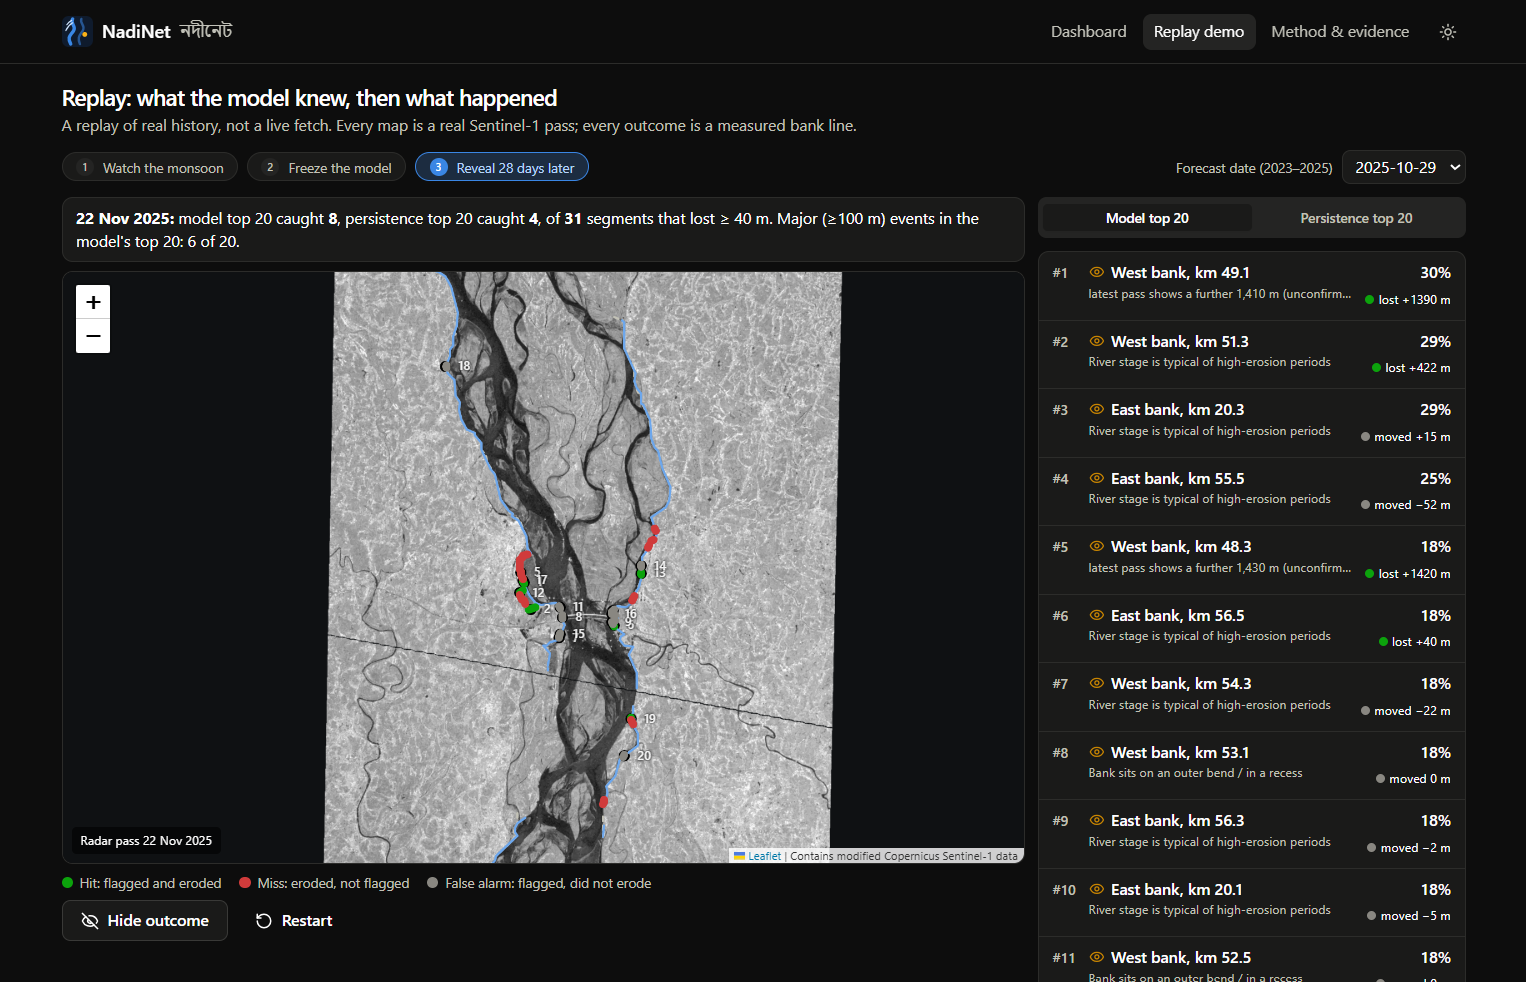
- Risk ranking: for each of 871 bank segments of 200 m, a calibrated probability of losing at least 40 m of land within 28 days that is still gone six months later, with plain-language reasons ("Bank retreated 90 m in the last 4 weeks; main channel moved closer").
- Alerts with a human in the loop: a weekly PDF brief for upazila committees, BWDB field offices and NGOs. A Warning (Bangla SMS + prerecorded voice call) can only go out after a named official approves it. The software never warns the public on its own.
- Replay demo: freeze the model on any date in 2023–2025, see its top 20, then reveal what really happened 28 days later.
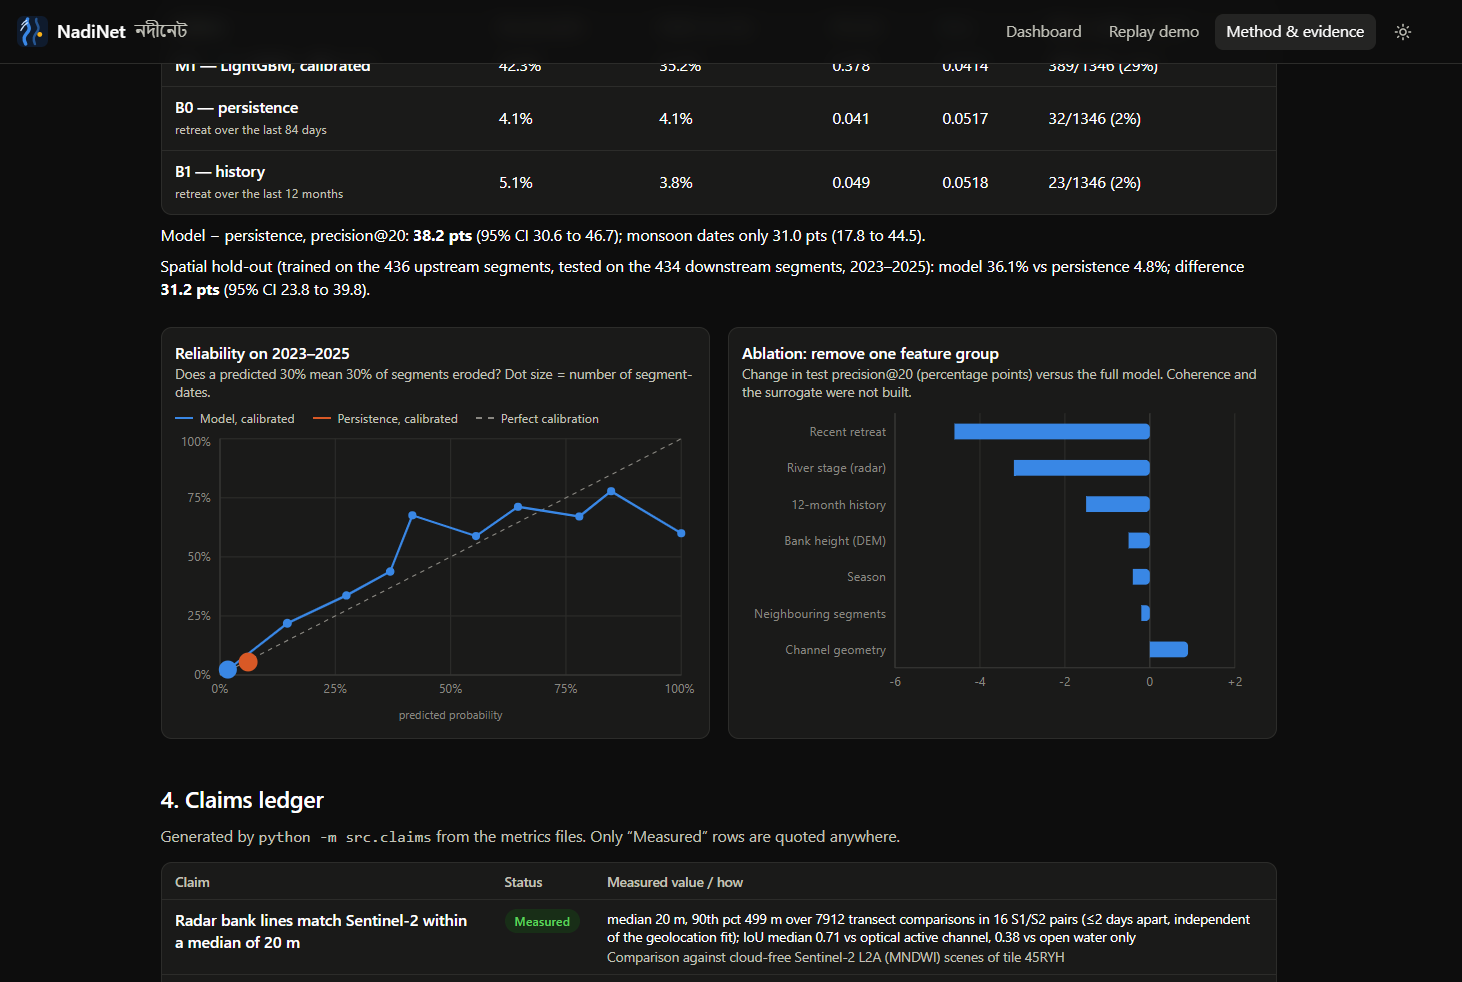
Results on the held-out years 2023–2025, scored once, with the success criteria committed to git before the test:
| NadiNet | "It eroded recently" (persistence) | |
|---|---|---|
| Top-20 hit rate (precision@20) | 42.3% | 4.1% |
| Major (≥100 m) events caught in the top 20 | 29% | 2.4% |
| Brier score (lower is better) | 0.041 | 0.052 |
- The difference is +38.2 points (95% CI +30.6 to +46.7, block bootstrap over 65 forecast dates).
- Trained on the upstream half of the reach and tested on the downstream half: 36.1% vs 4.8%.
- Bank lines agree with cloud-free Sentinel-2 to a 20 m median, over 7,912 transect checks on 16 independent image pairs.
- A new pass becomes an updated ranked list in about 2 minutes on a 4-core machine.
How we built it
Data. All 271 Sentinel-1 passes over the reach on one orbit track (January 2015 – December 2025), read straight from the public Copernicus archive on AWS. Only the window over the river is fetched, using HTTP range requests on the tiled GeoTIFFs. Sentinel-2 is used only to check the radar.
Radar to water. We calibrate the raw values to backscatter (σ⁰) with each product's own lookup table, apply a Lee speckle filter, and geocode onto a fixed 10 m grid by inverting the product's tie-point grid. A per-scene Otsu threshold on VV separates dark water from bright land, and VH rescues wind-roughened water.
Water to banks. We build the braid belt: river-connected water plus the sand islands (chars) it encloses, with narrow side channels cut away. Then we measure the bank position on transects every 200 m, cast from a baseline drawn once from the 2015 passes. This is the transect method of the USGS Digital Shoreline Analysis System, applied pass by pass.
Labels. With \( b(t) \) the bank position (metres, positive = landward) and \( t^{*} \) the pass nearest \( t + 28 \) days:
$$ b_0 = \operatorname{median}{\tau \in [t-24\text{d},\,t]} b(\tau), \qquad b_1 = \operatorname{median}{|\tau - t^{}| \le 12\text{d}} b(\tau), \qquad b_p = Q_{25}\big(b(\tau) : \tau \in [t^{},\, t^{*}+180\text{d}]\big) $$
$$ y = \mathbf{1}\big[\, b_1 - b_0 \ge \theta \;\wedge\; b_p - b_0 \ge \theta \,\big], \qquad \theta = \max(20\,\text{m},\; 2 \times \text{median bank error}) = 40\,\text{m} $$
In words: the bank moved landward within 28 days, and the loss was still there through the next low water.
Model. LightGBM on features computed only from passes up to the forecast date: recent and annual retreat, distance to the main channel, char shielding, bank curvature, a radar-derived river-stage proxy, season, neighbouring segments and bank height from the Copernicus DEM. It is trained on 2015–2021, tuned and calibrated (isotonic regression) on 2022, and tested once on 2023–2025. A unit test rebuilds every feature from data truncated at random dates and fails if anything peeks into the future.
Product. A FastAPI backend handles the PDF briefs and the approval-gated alert path. The Next.js 14 dashboard (TypeScript, Tailwind, Leaflet with the radar image as the base map, Recharts, Framer Motion) works entirely offline from precomputed data, so the demo cannot be broken by bad Wi-Fi.
Challenges we ran into
- A 100 m geolocation shift. Our first comparison with Sentinel-2 put the radar banks about 100 m too far west — on both banks. The cause: the product's tie points assume the floodplain is ~60 m above the WGS84 ellipsoid, when it actually lies below it, and the satellite looks west. A range shift of \( \Delta h / \tan\theta \) explained it. We fitted a terrain-height correction on 2017–2019 pairs only, and median error on the independent pairs dropped from ~100 m to 20 m.
- Dry sand looks like water. To C-band radar, smooth dry sandbars are as dark as water. Against optical open water our masks scored an IoU of only 0.38; against the optical "active channel" (water + bare sand), 0.71. The mainland bank — the edge of vegetated land — is what both sensors agree on.
- Floods are not erosion. Landward jumps of more than 200 m hit 13% of consecutive passes, clustered in June–August, and reversed by November: low land flooding and draining. This is why labels require the loss to persist through the next low water.
- Honesty under pressure. A third of detected losses exceed 300 m in 28 days, often a side channel opening beside the mainland. We report a sensitivity check without them: NadiNet still scores 29.6% vs 3.0%.
- No gauges. Flood-forecasting gauge data and GloFAS were not reachable from our build environment, so river stage is estimated from the radar itself — open water inside the braid belt.
Accomplishments that we're proud of
- Real data end to end: every pass from 2015 to 2025 processed, with no mock numbers anywhere.
- Pre-registered validation: the protocol and success criteria were committed before the test years were touched, and every change made before the test is logged with its reason.
- A claims ledger: no number appears in the app, README or pitch unless an experiment in the repo produced it. Dropped claims (24-hour forecasts, sub-metre maps) are listed as dropped.
- Reproducible: re-running the whole pipeline from scratch reproduced every committed artefact byte-for-byte; 37 automated tests pass.
- Ethics built in: no automatic public warnings, no false "all clear", and phone numbers masked in logs.
What we learned
- Measure before you model. All three of our biggest fixes came from comparing against an independent sensor, not from tuning the model.
- Baselines matter. On this river, "it moved recently" mostly detects floods; the model's real advantage is knowing the difference.
- Definitions are the science. Deciding what counts as "erosion" (permanent loss, not water level) mattered more than the algorithm.
- Trust is part of the product. Showing misses and confidence intervals makes a stronger case to officials than a single big accuracy number.
What's next for NadiNet
- Pilot: one monsoon of weekly briefs with an NGO or upazila disaster management committee in the reach, plus ground reports of actual erosion.
- Better inputs: gauge water levels from Bangladesh's Flood Forecasting and Warning Centre, a second radar track, Sentinel-1C/1D data, and coherence features.
- The voice: a Bangla warning clip recorded by a native speaker from the reach, and integration with official channels.
- Scale carefully: the full Jamuna, then the Padma and Teesta, each retrained and retested on its own held-out years before it is used.
Built With
- amazon-web-services
- copernicus
- docker
- fastapi
- framer-motion
- gdal
- geopandas
- leaflet.js
- lightgbm
- next.js
- numpy
- python
- rasterio
- react
- recharts
- reportlab
- scikit-image
- scikit-learn
- scipy
- sentinel-1
- sentinel-2
- shap
- tailwindcss
- typescript

Log in or sign up for Devpost to join the conversation.