Inspiration
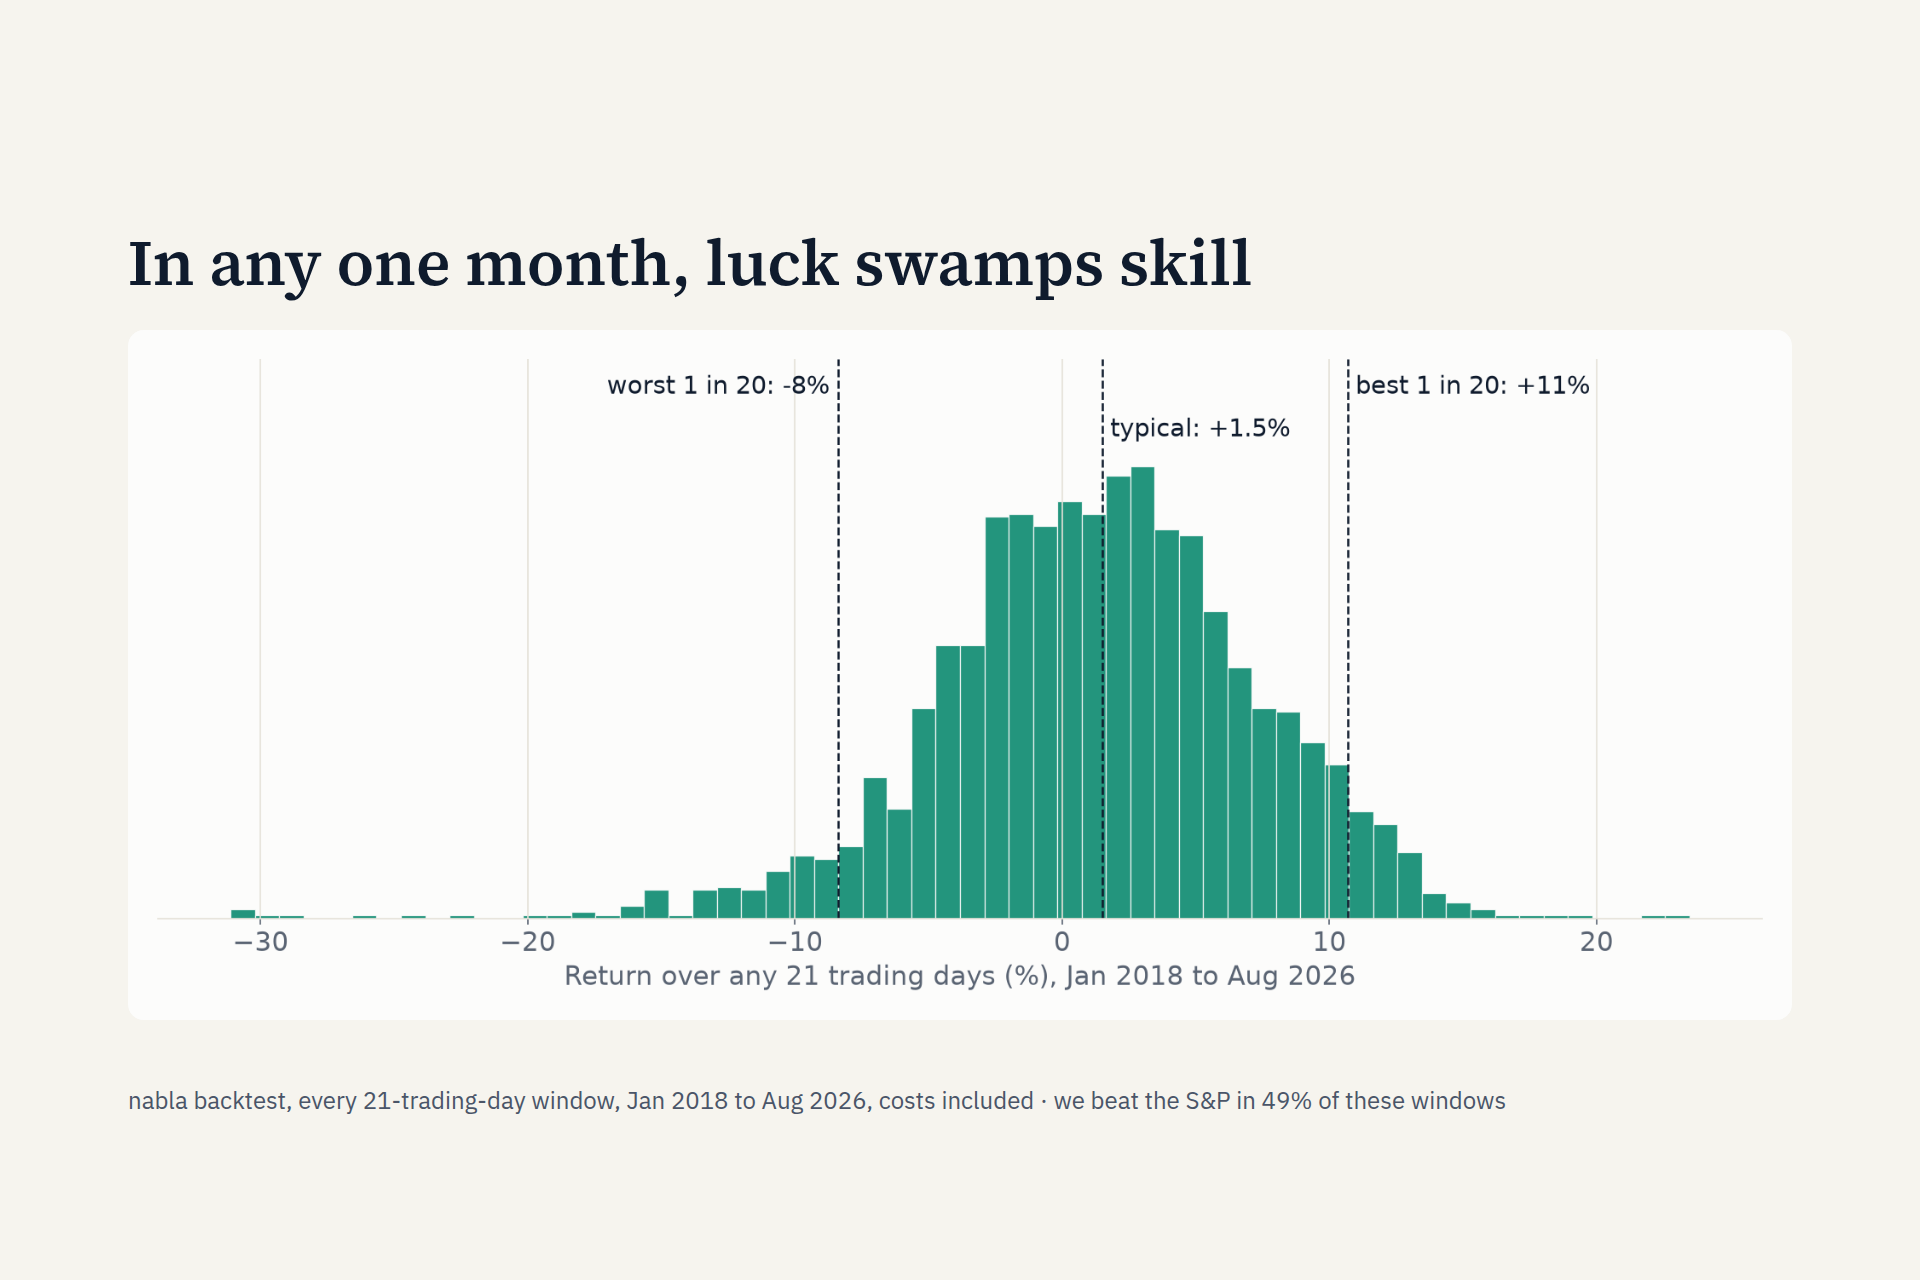
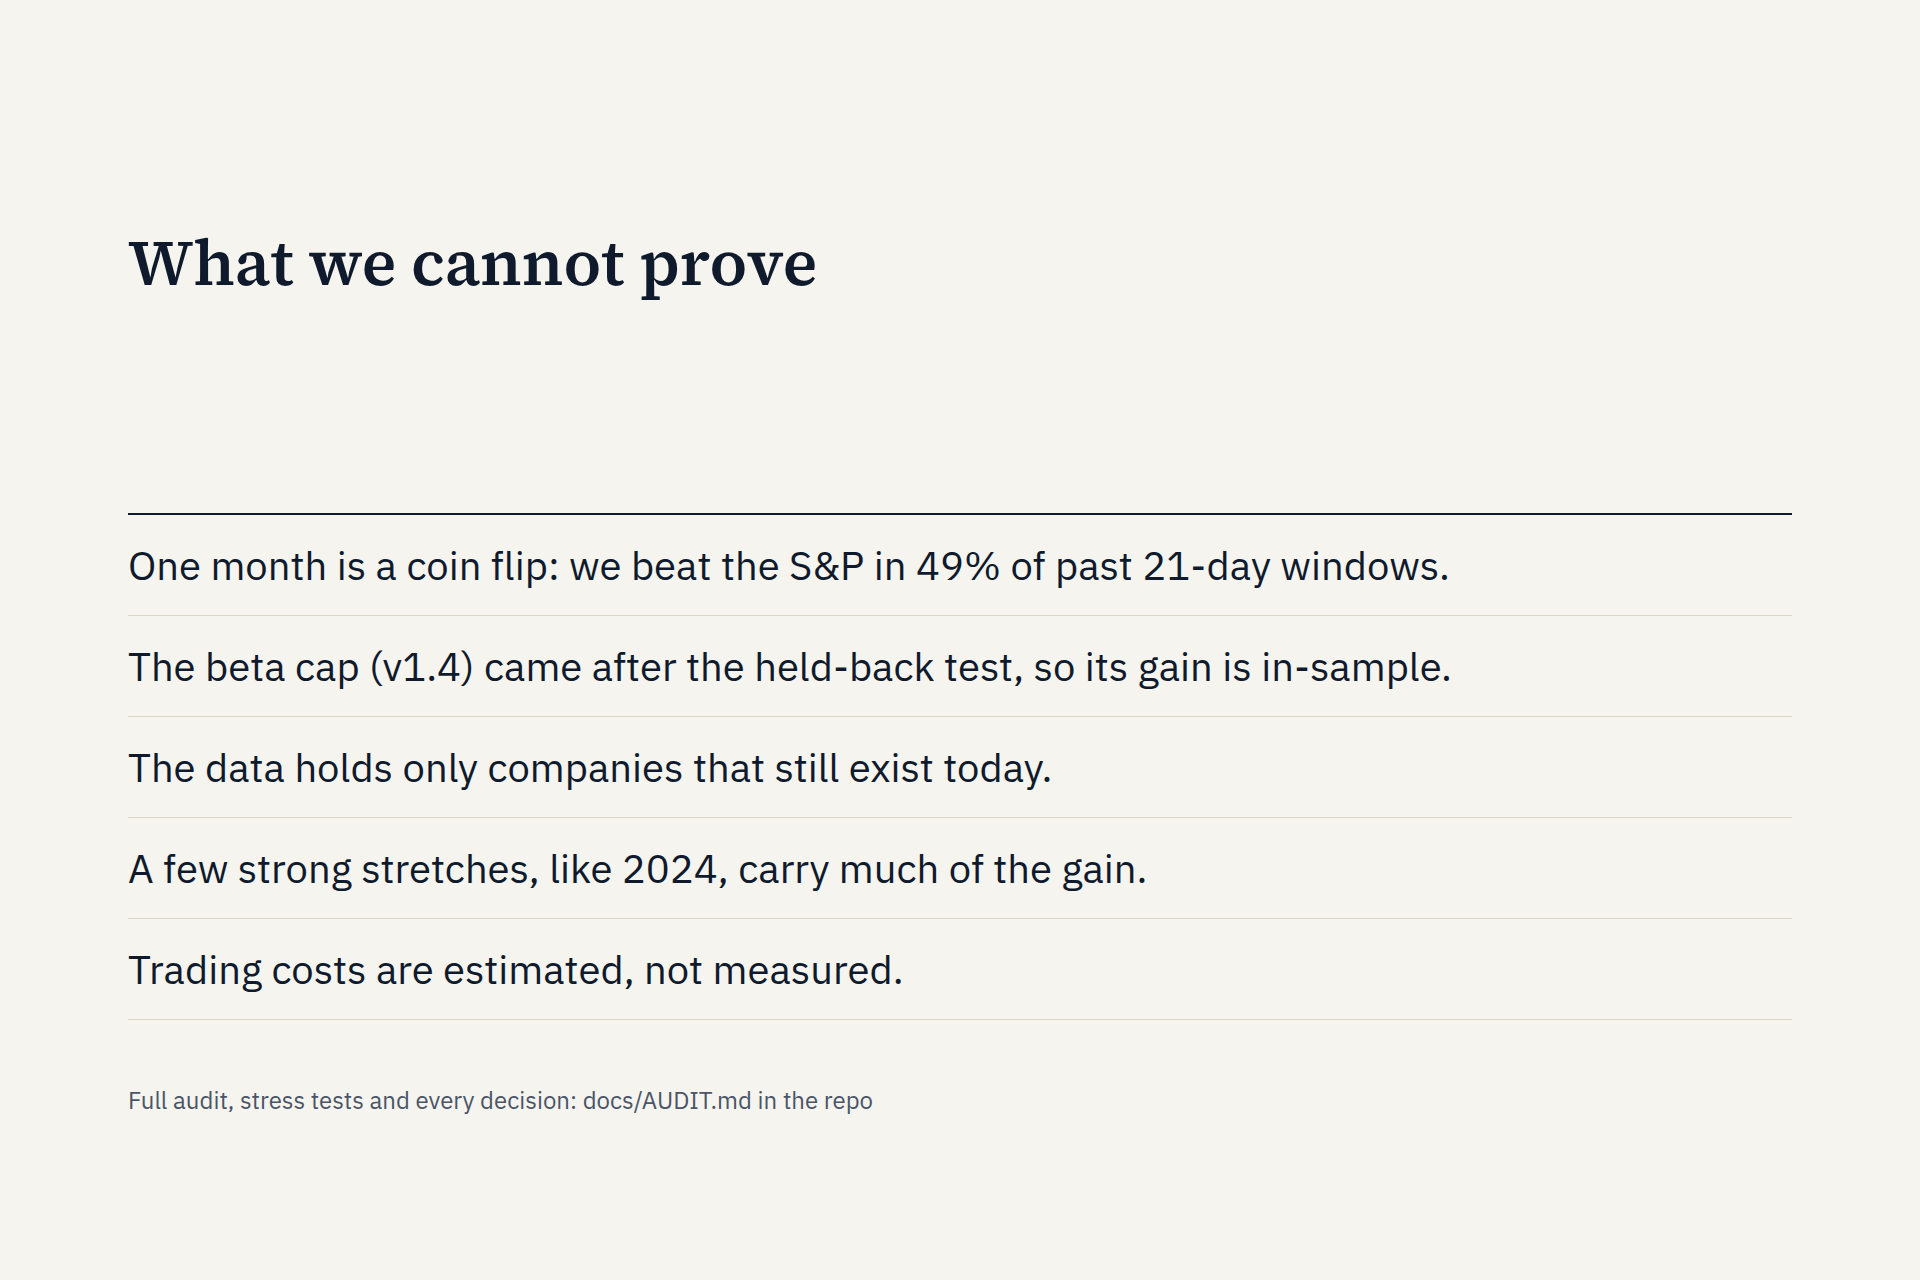
The challenge: build an AI that runs a $1M stock portfolio, then have judges replay it, frozen, through the 30 days after our data ends. That's about 21 trading days, which is mostly luck. In our own backtest, a typical month is up about 1%, but one month in twenty is down 8% and one in twenty is up 11%. Any real edge is a fraction of that spread.
So we didn't try to build the cleverest model. We built the most honest one we could: simple, well-researched signals, strict risk limits, and tests designed to catch us fooling ourselves.
What it does
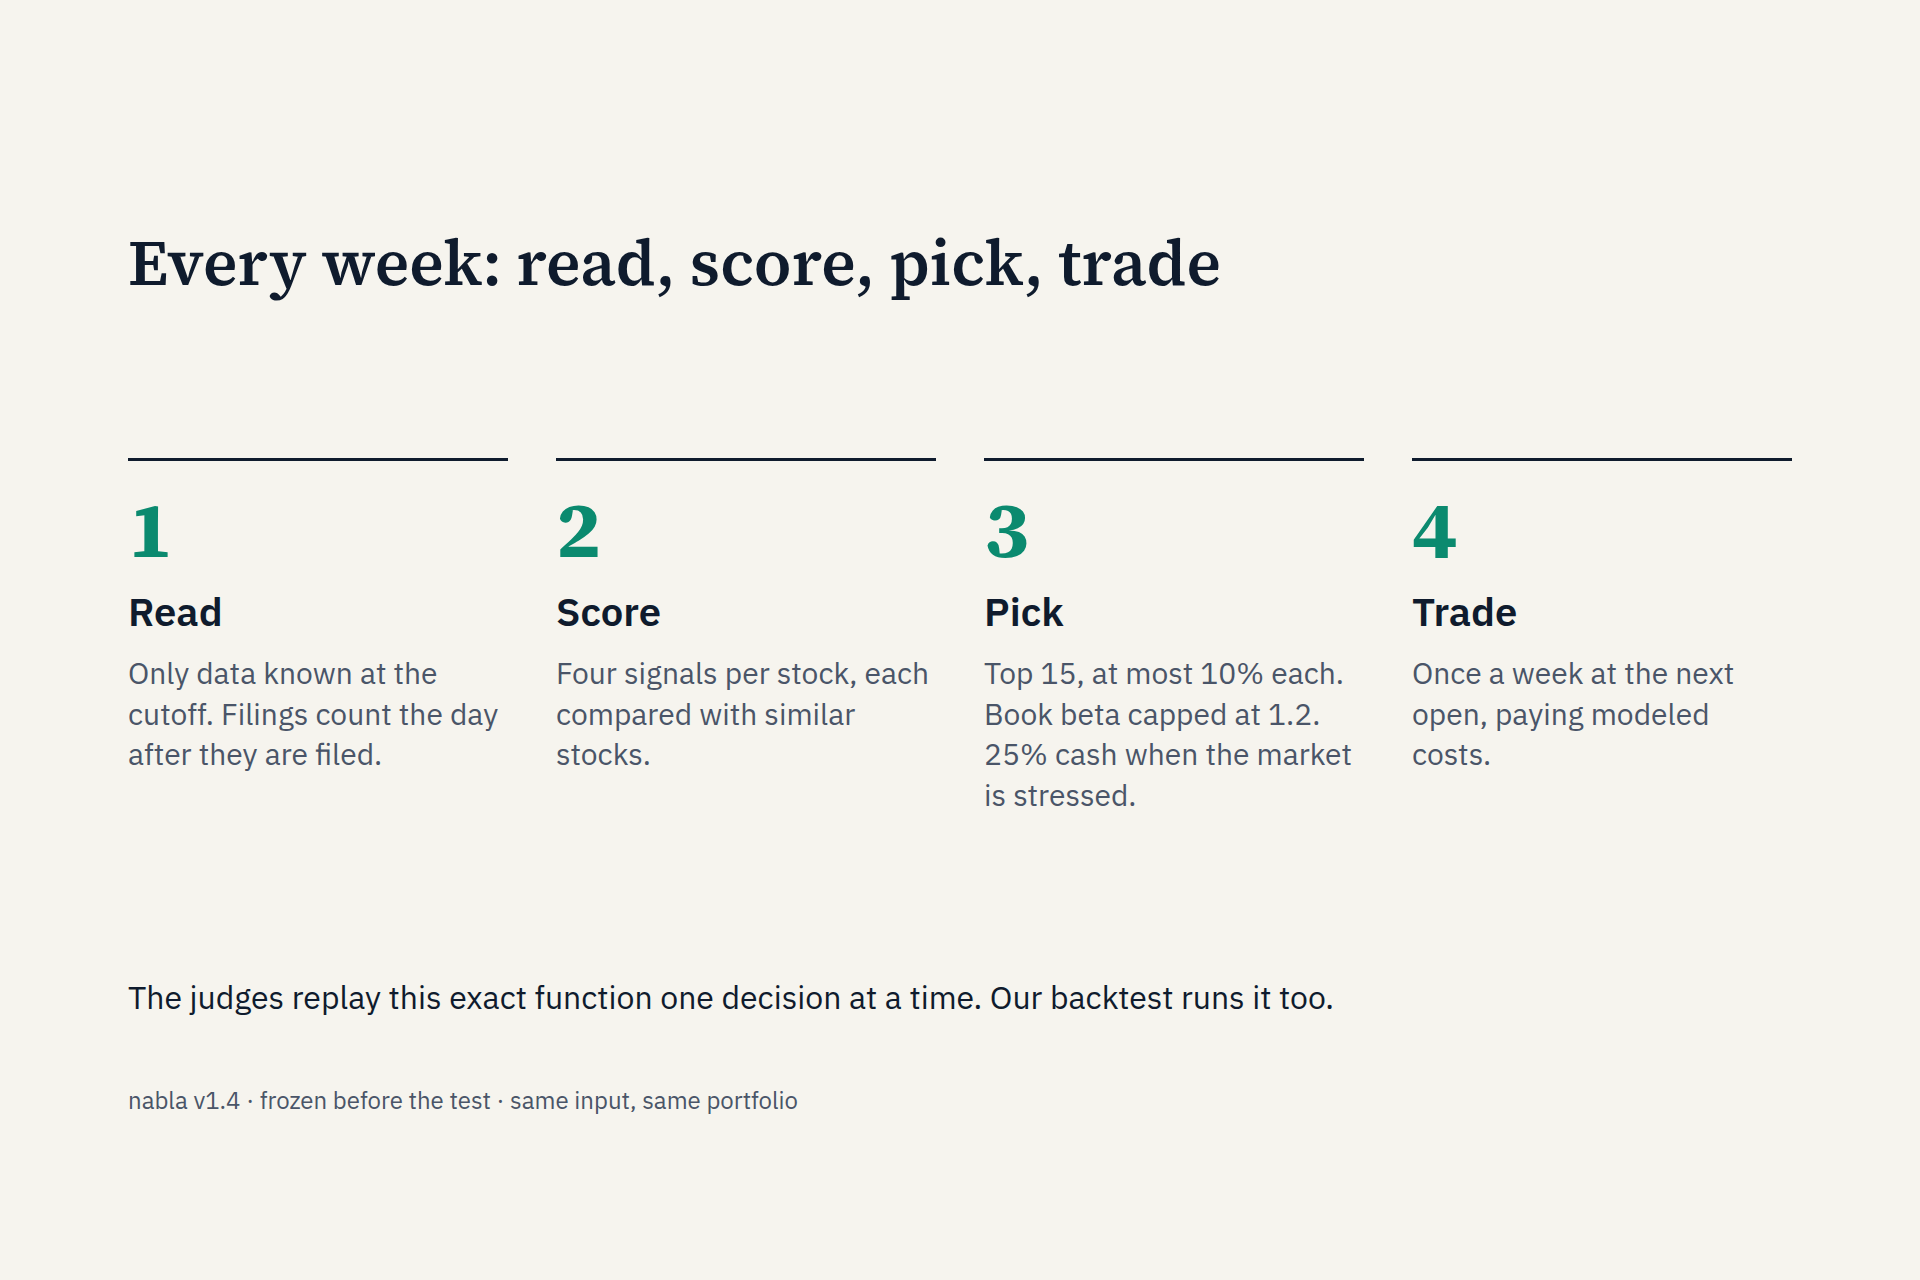
Every week, nabla:
- Reads only data that was known at the decision time. Company filings count from the day after they're filed.
- Scores about 450 to 800 liquid US stocks on four signals: momentum (12-month trend, skipping the last month), guidance (companies raising their outlook), quality (margins and low debt) and value (earnings relative to price). Each stock is compared only with similar stocks.
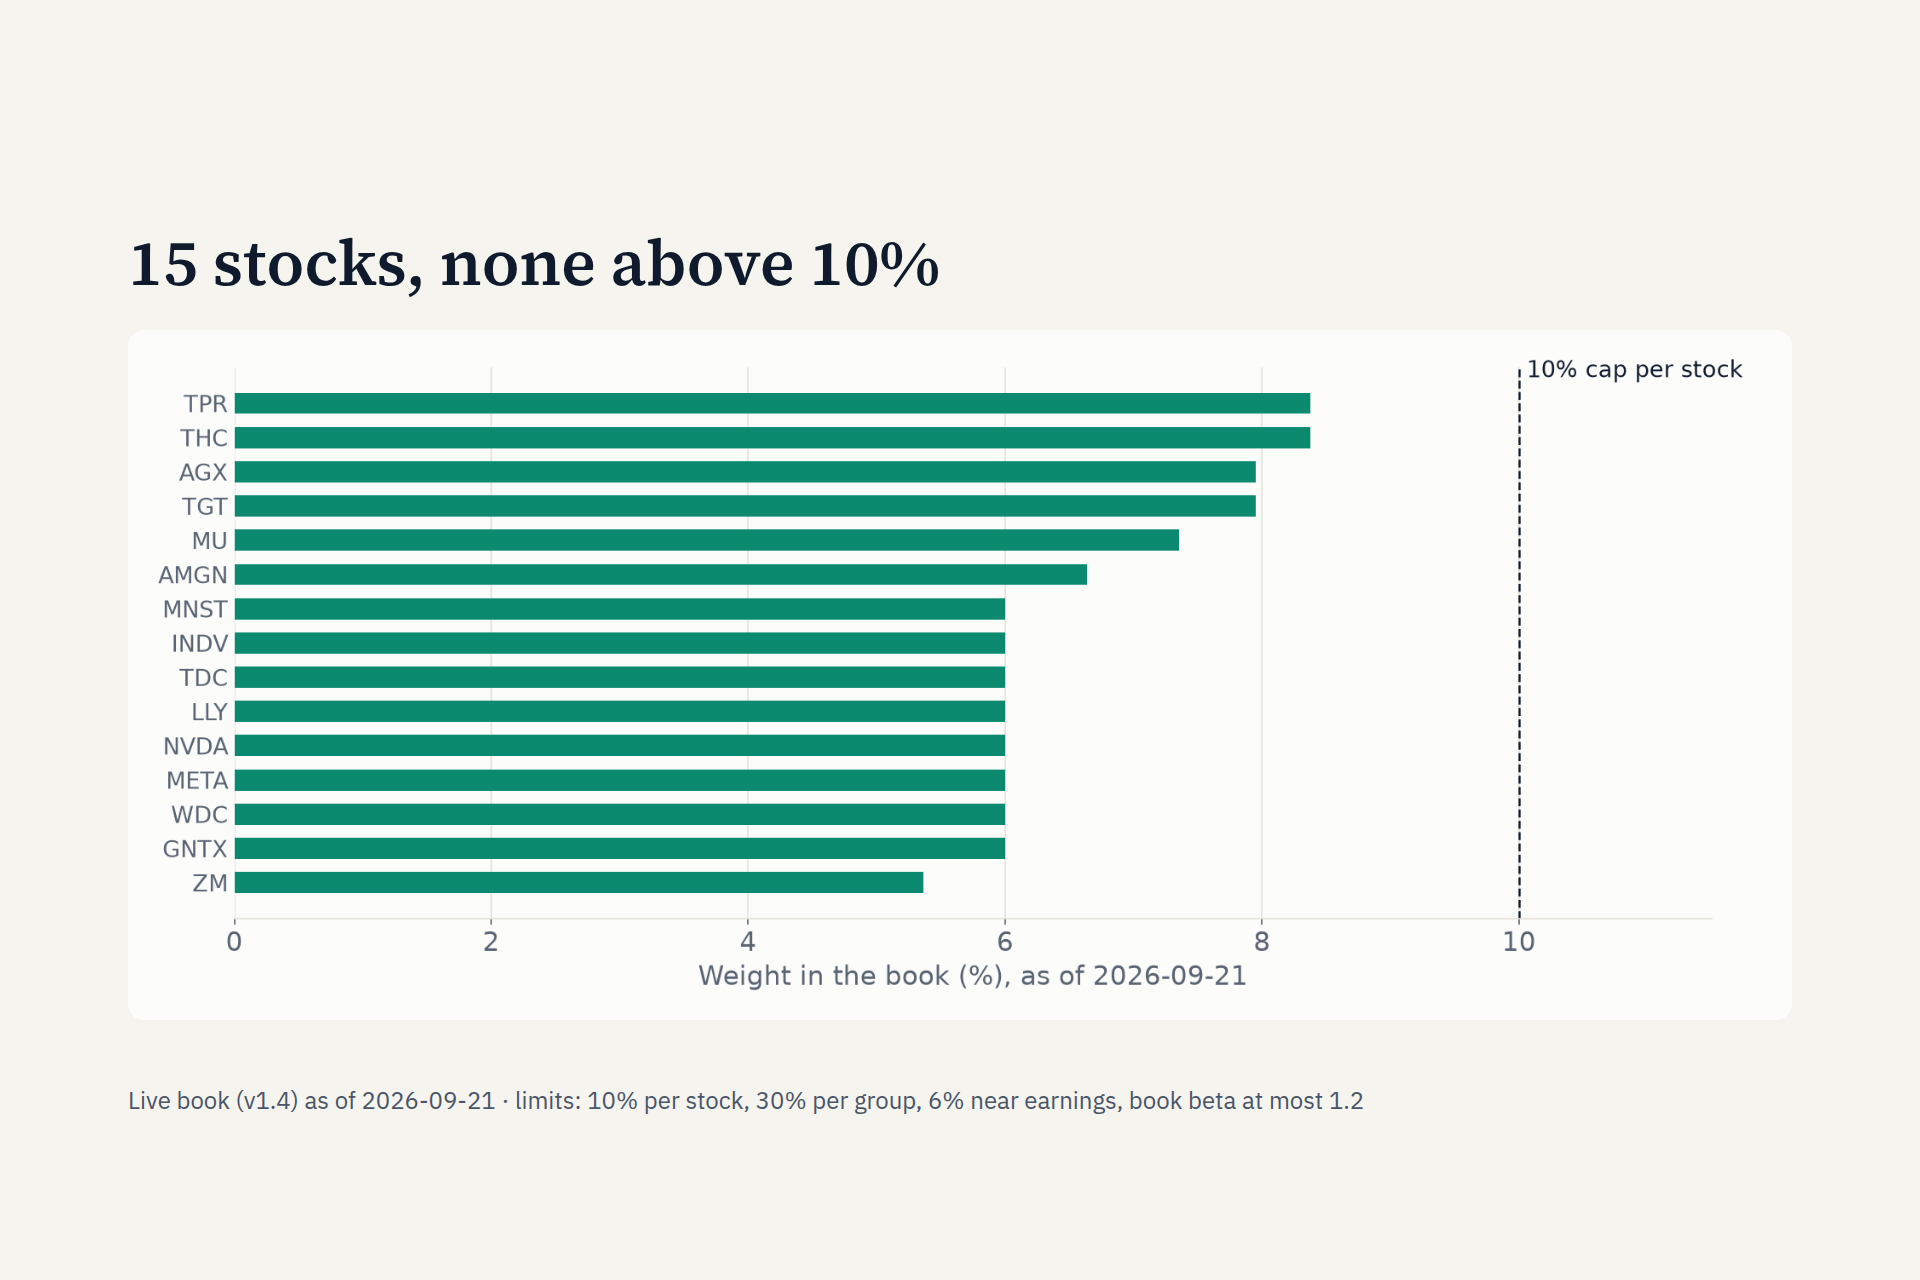
- Picks the top 15 at roughly equal weight, with at most 10% in any stock and at most 4 of the 15 from one group of stocks that move together.
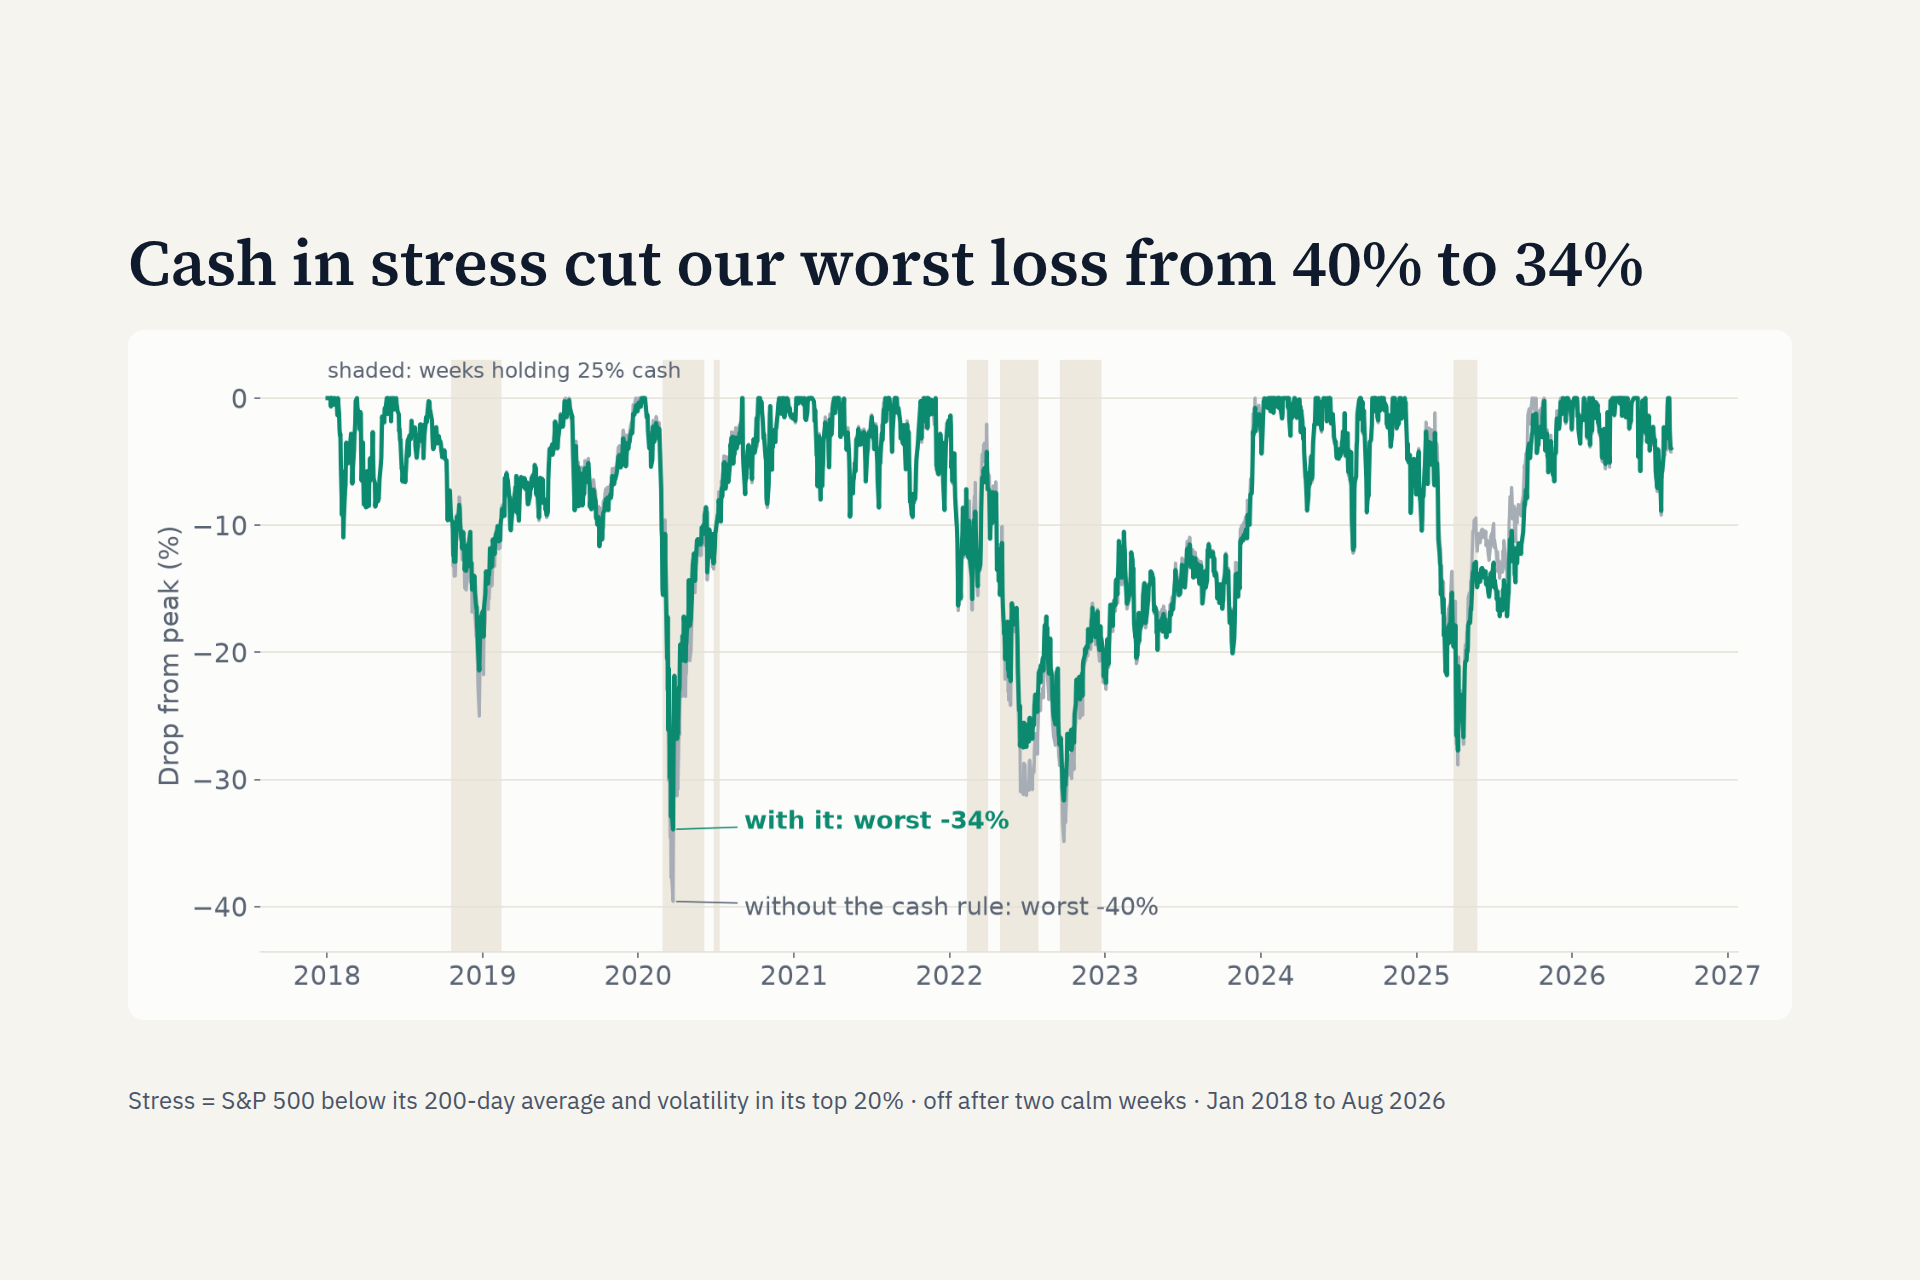
- Moves 25% to cash when the S&P 500 is below its 200-day average and volatility is high.
- Trades once a week at the next open, paying modeled costs.
Each signal is trimmed at the 1st and 99th percentile, standardized within its group and capped at ±3. The score is a fixed equal-weight sum in which a missing signal counts as zero, so stocks with less data aren't favored:
score = average of the four signals, each standardized and capped between −3 and +3
The output for each decision is one complete target portfolio (tickers and weights, with cash as its own line) that always sums to 1, served through a FastAPI endpoint that the judges can replay one decision at a time.
How we built it
- Data and pipeline: Python, pandas and polars on the hackathon's
statevectordataset: daily prices, company filings and guidance changes for about 1,250 stocks. - One frozen decision function:
decide(information_cutoff)returns the judged record. Our eight-year backtest calls the same function every week, so what we tested is what the judges run. - No hidden state: the model rebuilds its last eight weeks from the data on every call, so the same date always gives the same portfolio.
- Cost model: half the bid-ask spread (5 to 20 basis points by liquidity) plus a market-impact cost that grows with trade size. That works out to about 0.9% of the book a year.
- Stock groups without sector data: the dataset has no industry codes, so we group stocks by how they move together. A consensus of k-means runs (20 seeds over 1-, 2- and 3-year windows) is refit each January on past prices only.
- API: the starter's judged endpoints plus
/decide, scoring 100/100 on the starter's rubric checker.
Challenges we ran into
- Our best number was luck. An early version backtested at 17.6% a year. When we made the stock grouping stable and refit it each year on past data only, it dropped to 14.2%. We withdrew the flattering number and reported the honest one.
- Look-ahead is everywhere. Filings, holidays and same-day prices all leak the future if you're careless. We added tests that change data after a date and check that nothing before it moves.
- A silent caching bug once had the live portfolio built from seven-month-old prices. We caught it during an audit, fixed it and added a test.
- Speed limits: the judged endpoints have a 30-second timeout. Our first version timed out on the hosted data server; caching cut answers to under 0.1 seconds.
- Resisting the urge to tune. Every extra idea (a panic rule, an options-based signal, a Hidden Markov regime model, post-earnings drift, more market exposure) got a ship rule written before testing. Most failed and were left out.
Accomplishments that we're proud of
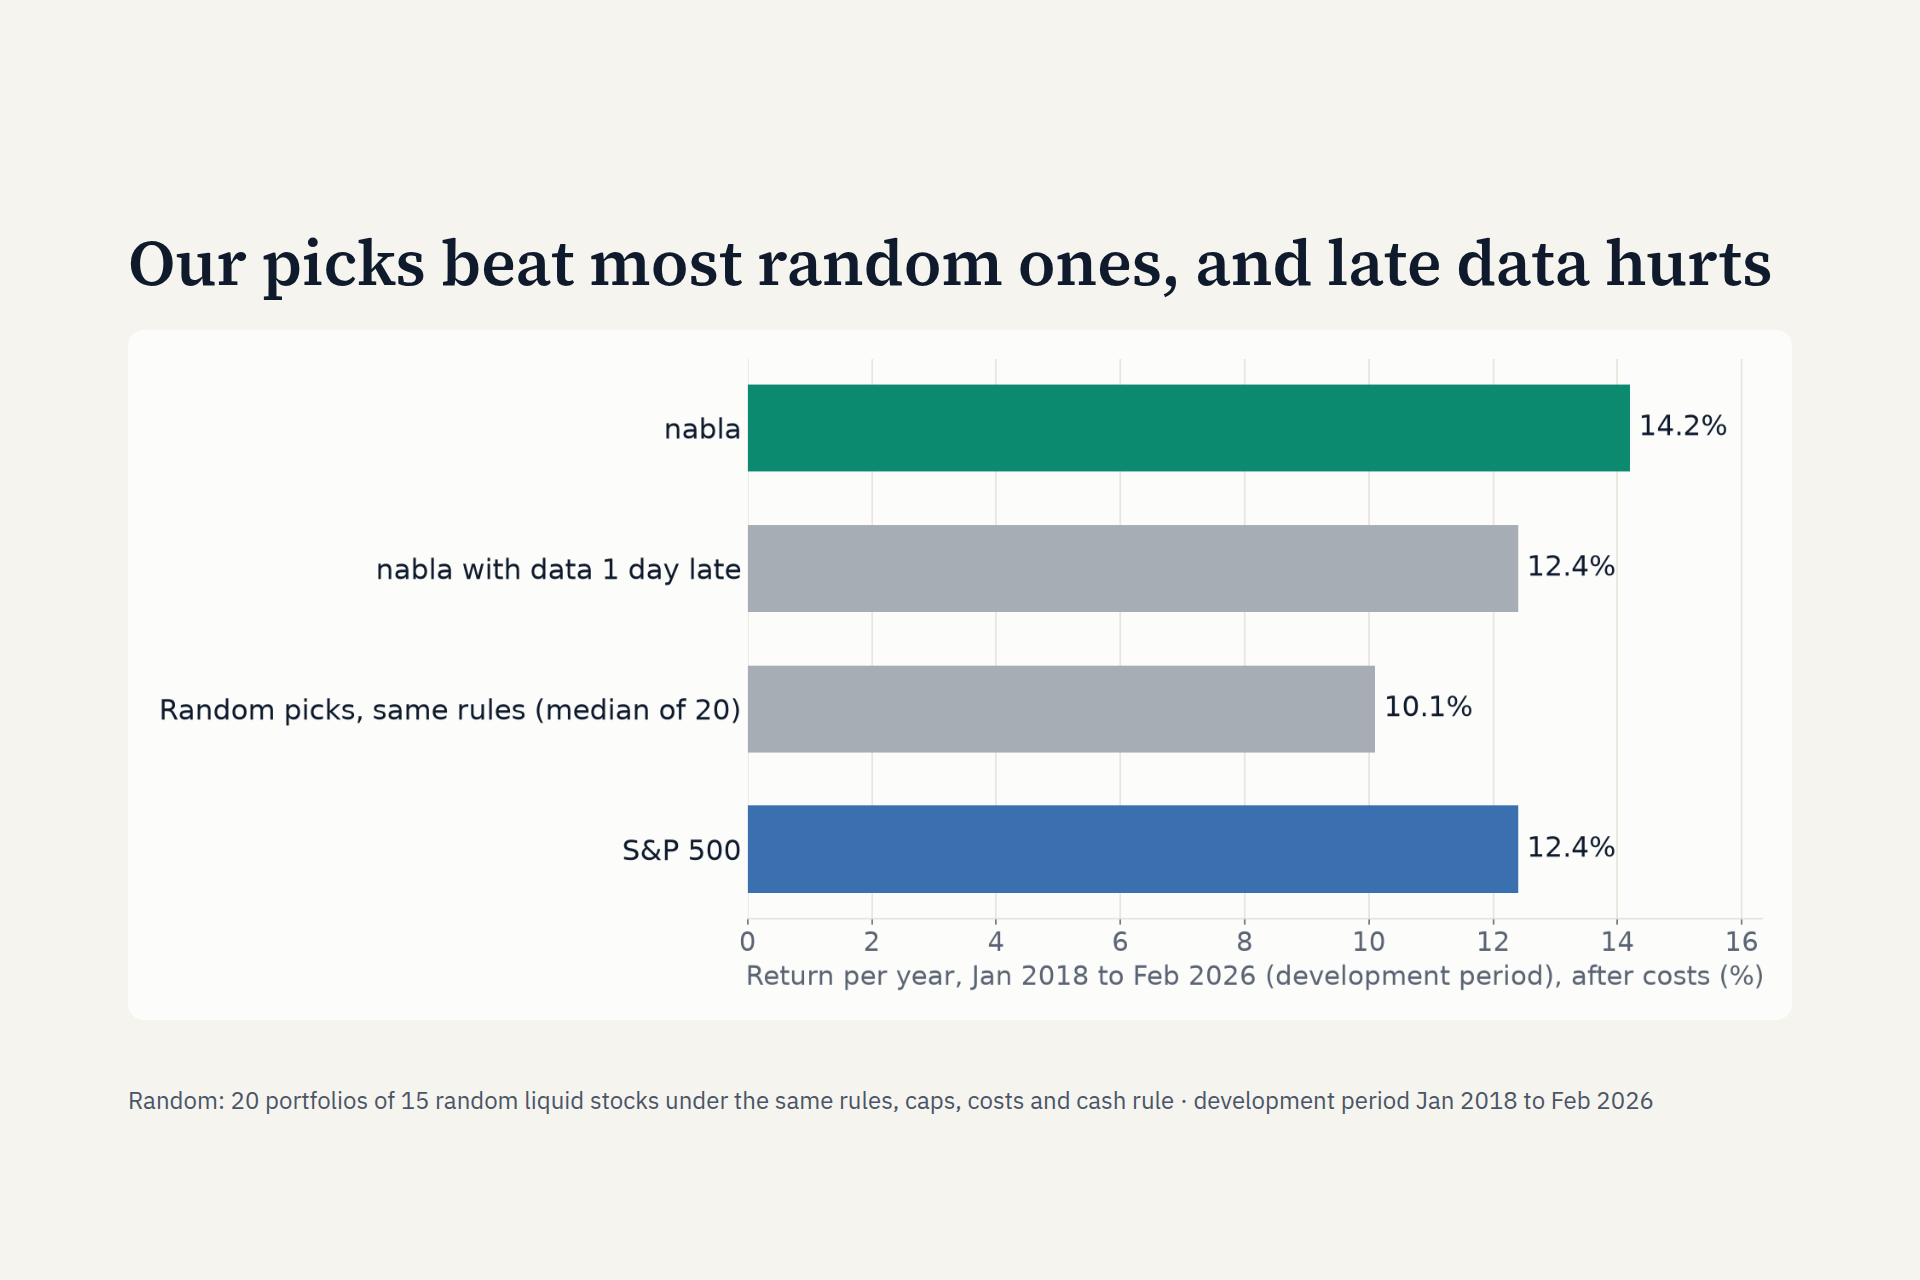
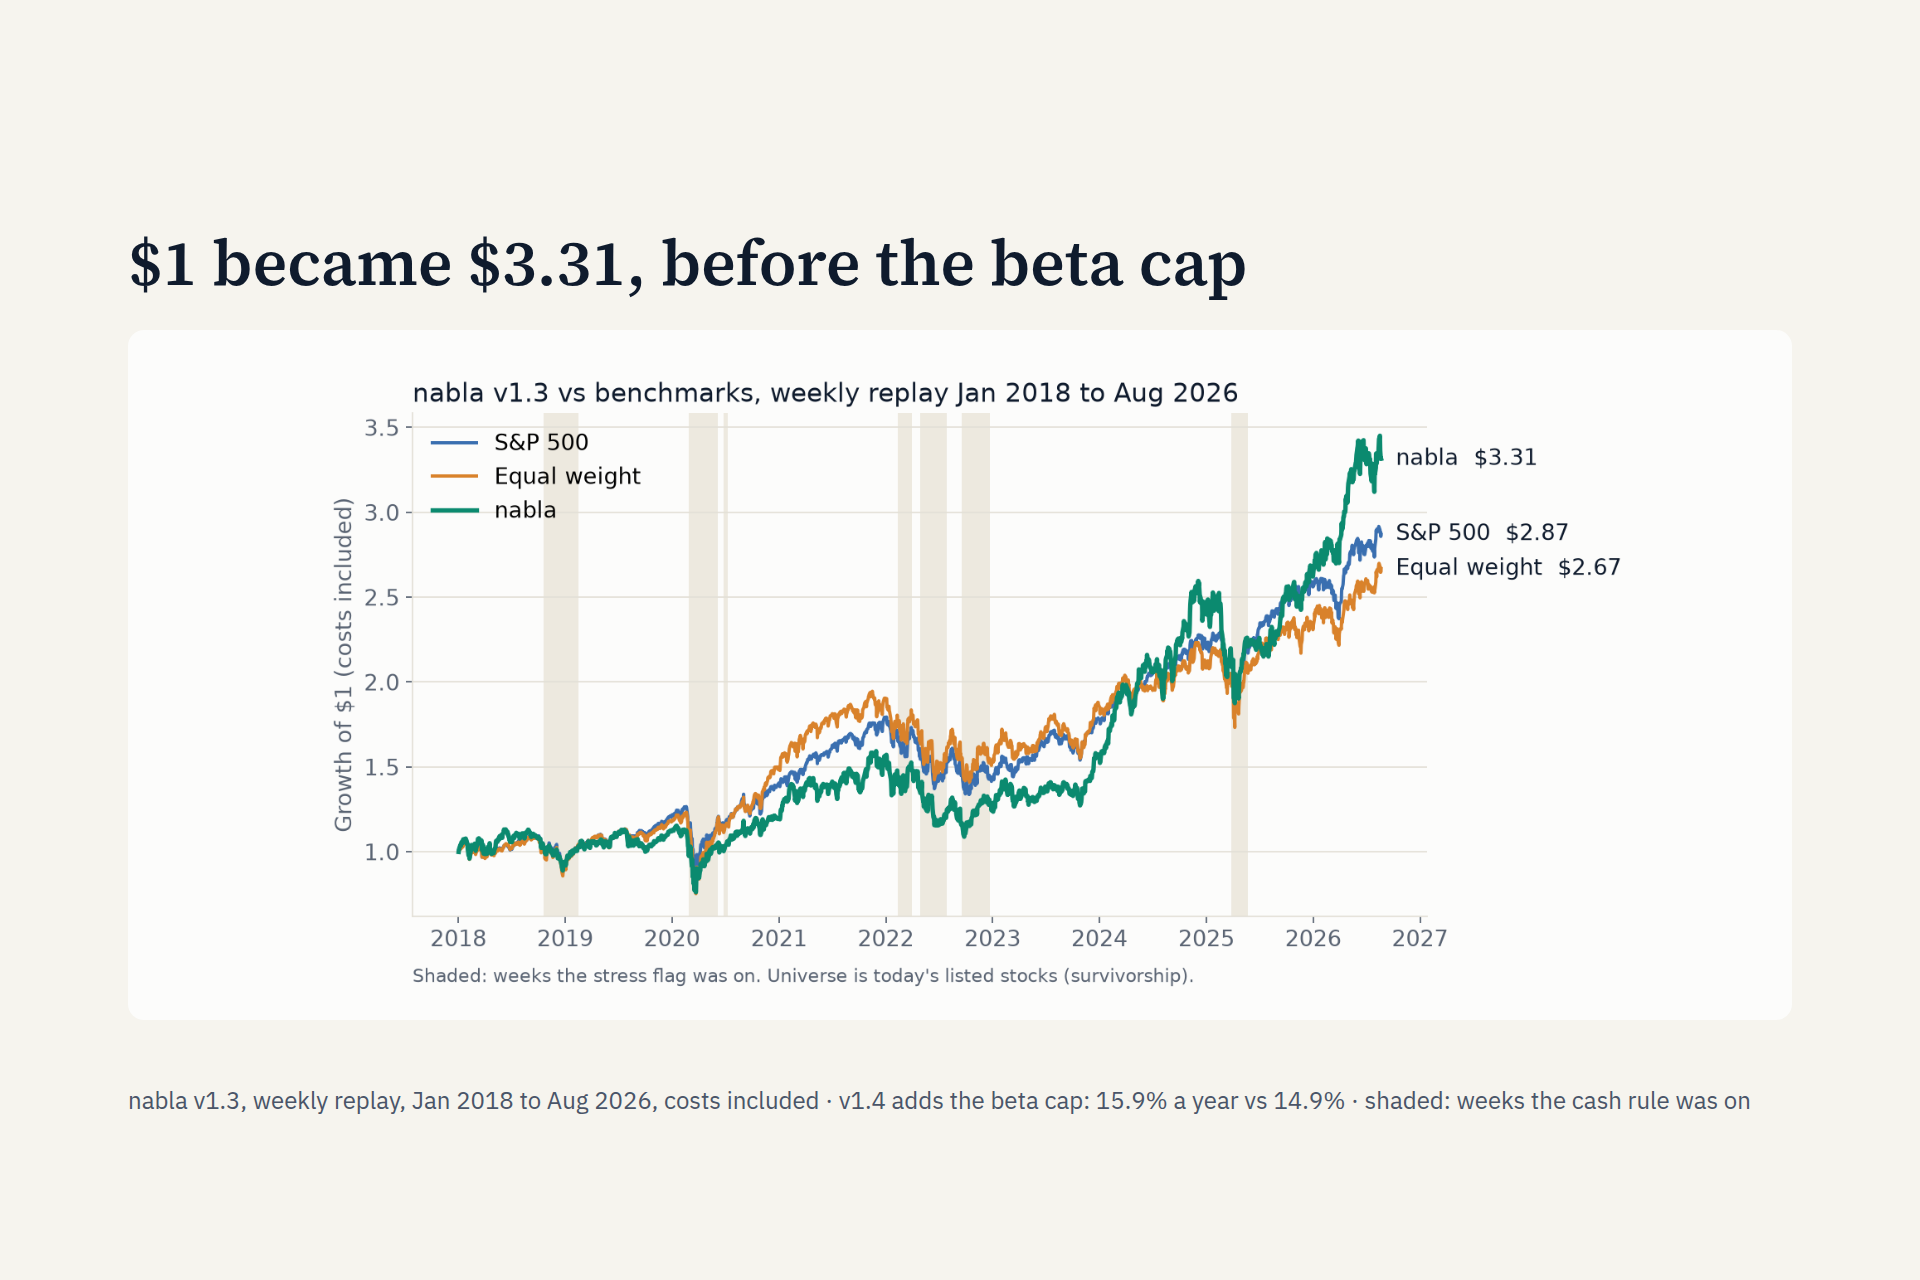
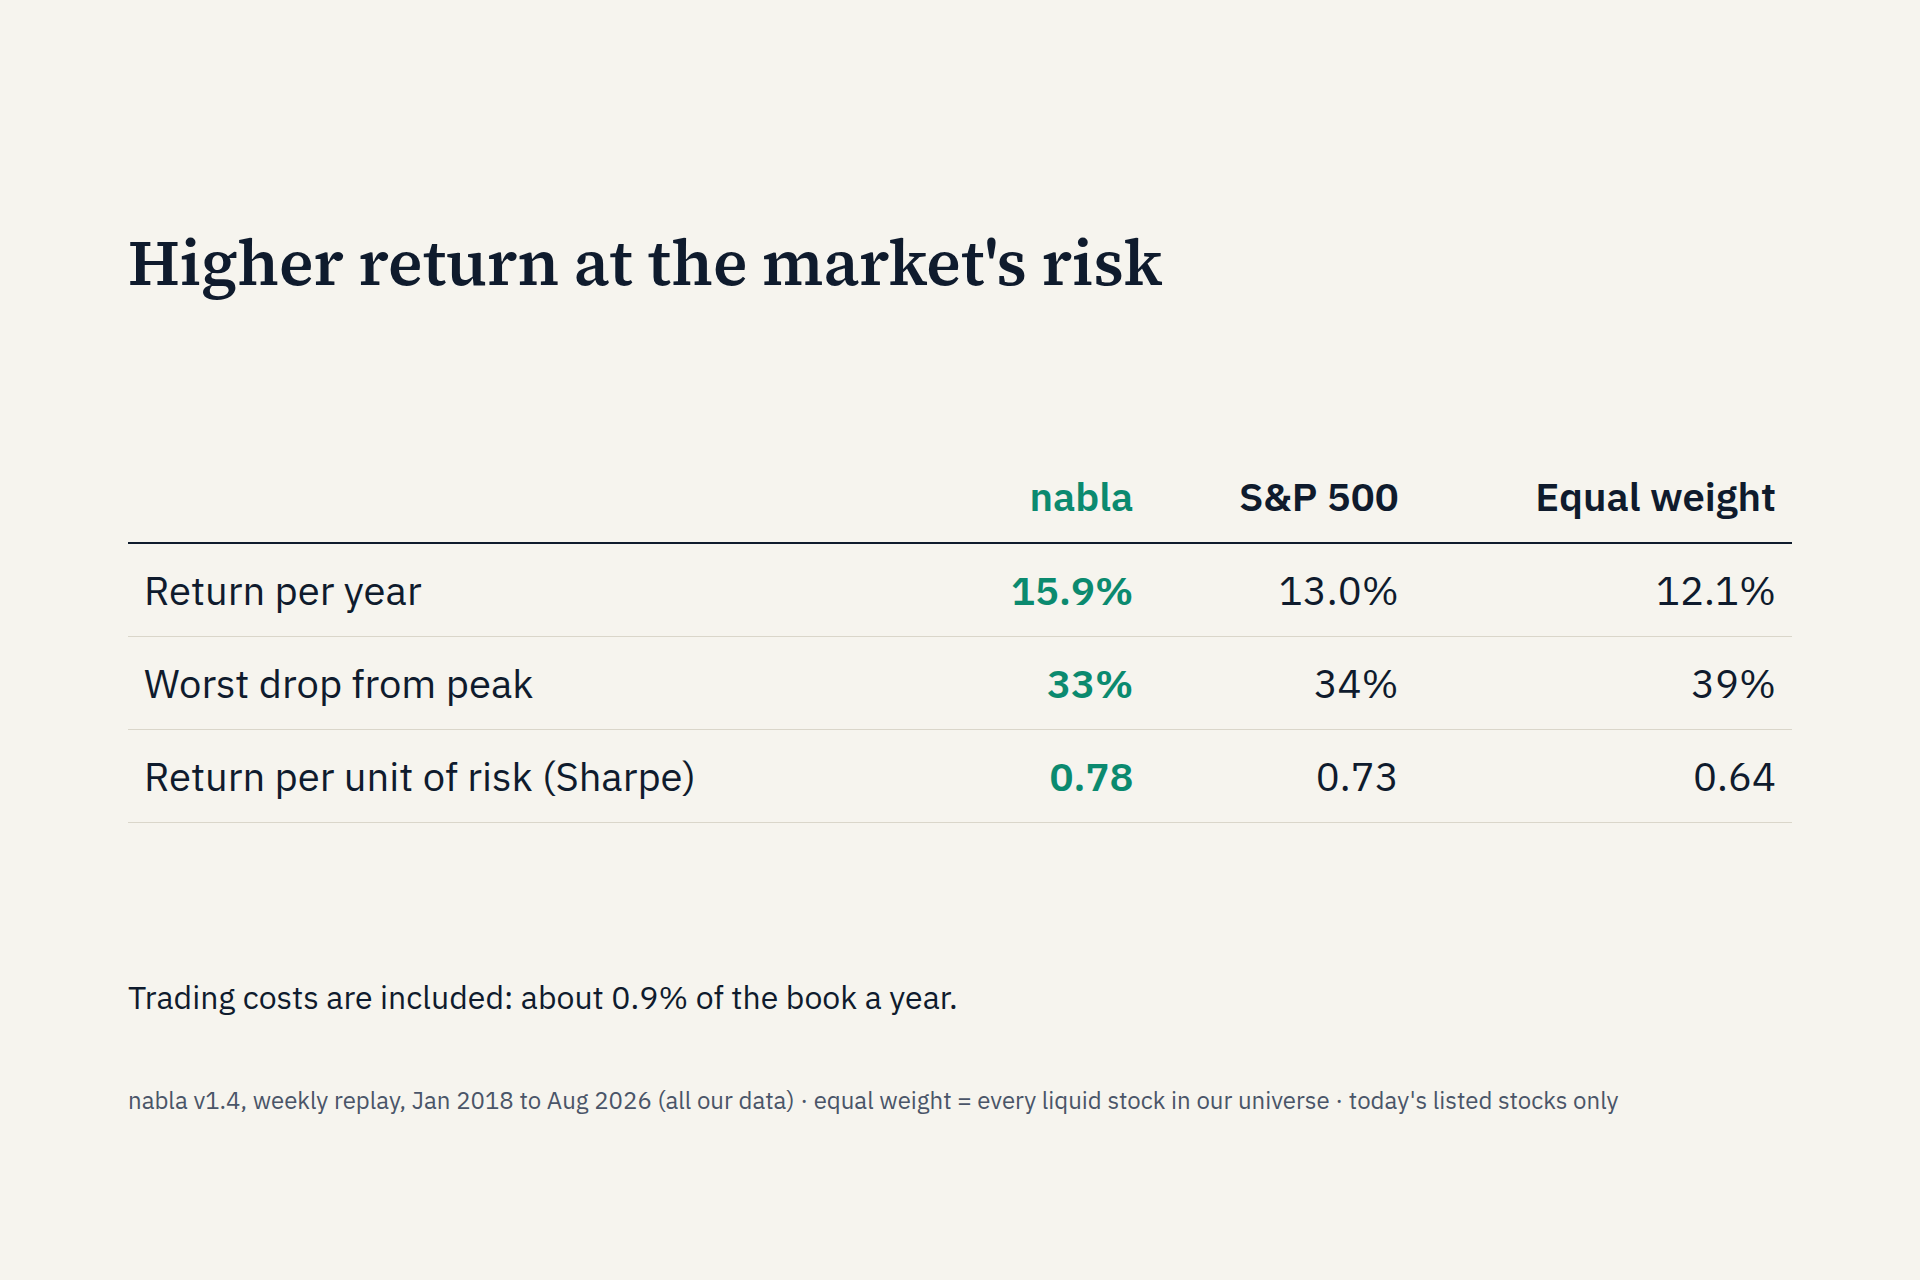
- Backtest, Jan 2018 to Feb 2026, after costs: 14.2% a year against 12.4% for the S&P 500 and 11.5% for an equal-weight portfolio of every liquid stock, at about the market's risk (Sharpe 0.70 for both). $1 became $2.93, against $2.58 for the S&P.
- The cash rule works: it cut the worst drawdown from 40% to 33%.
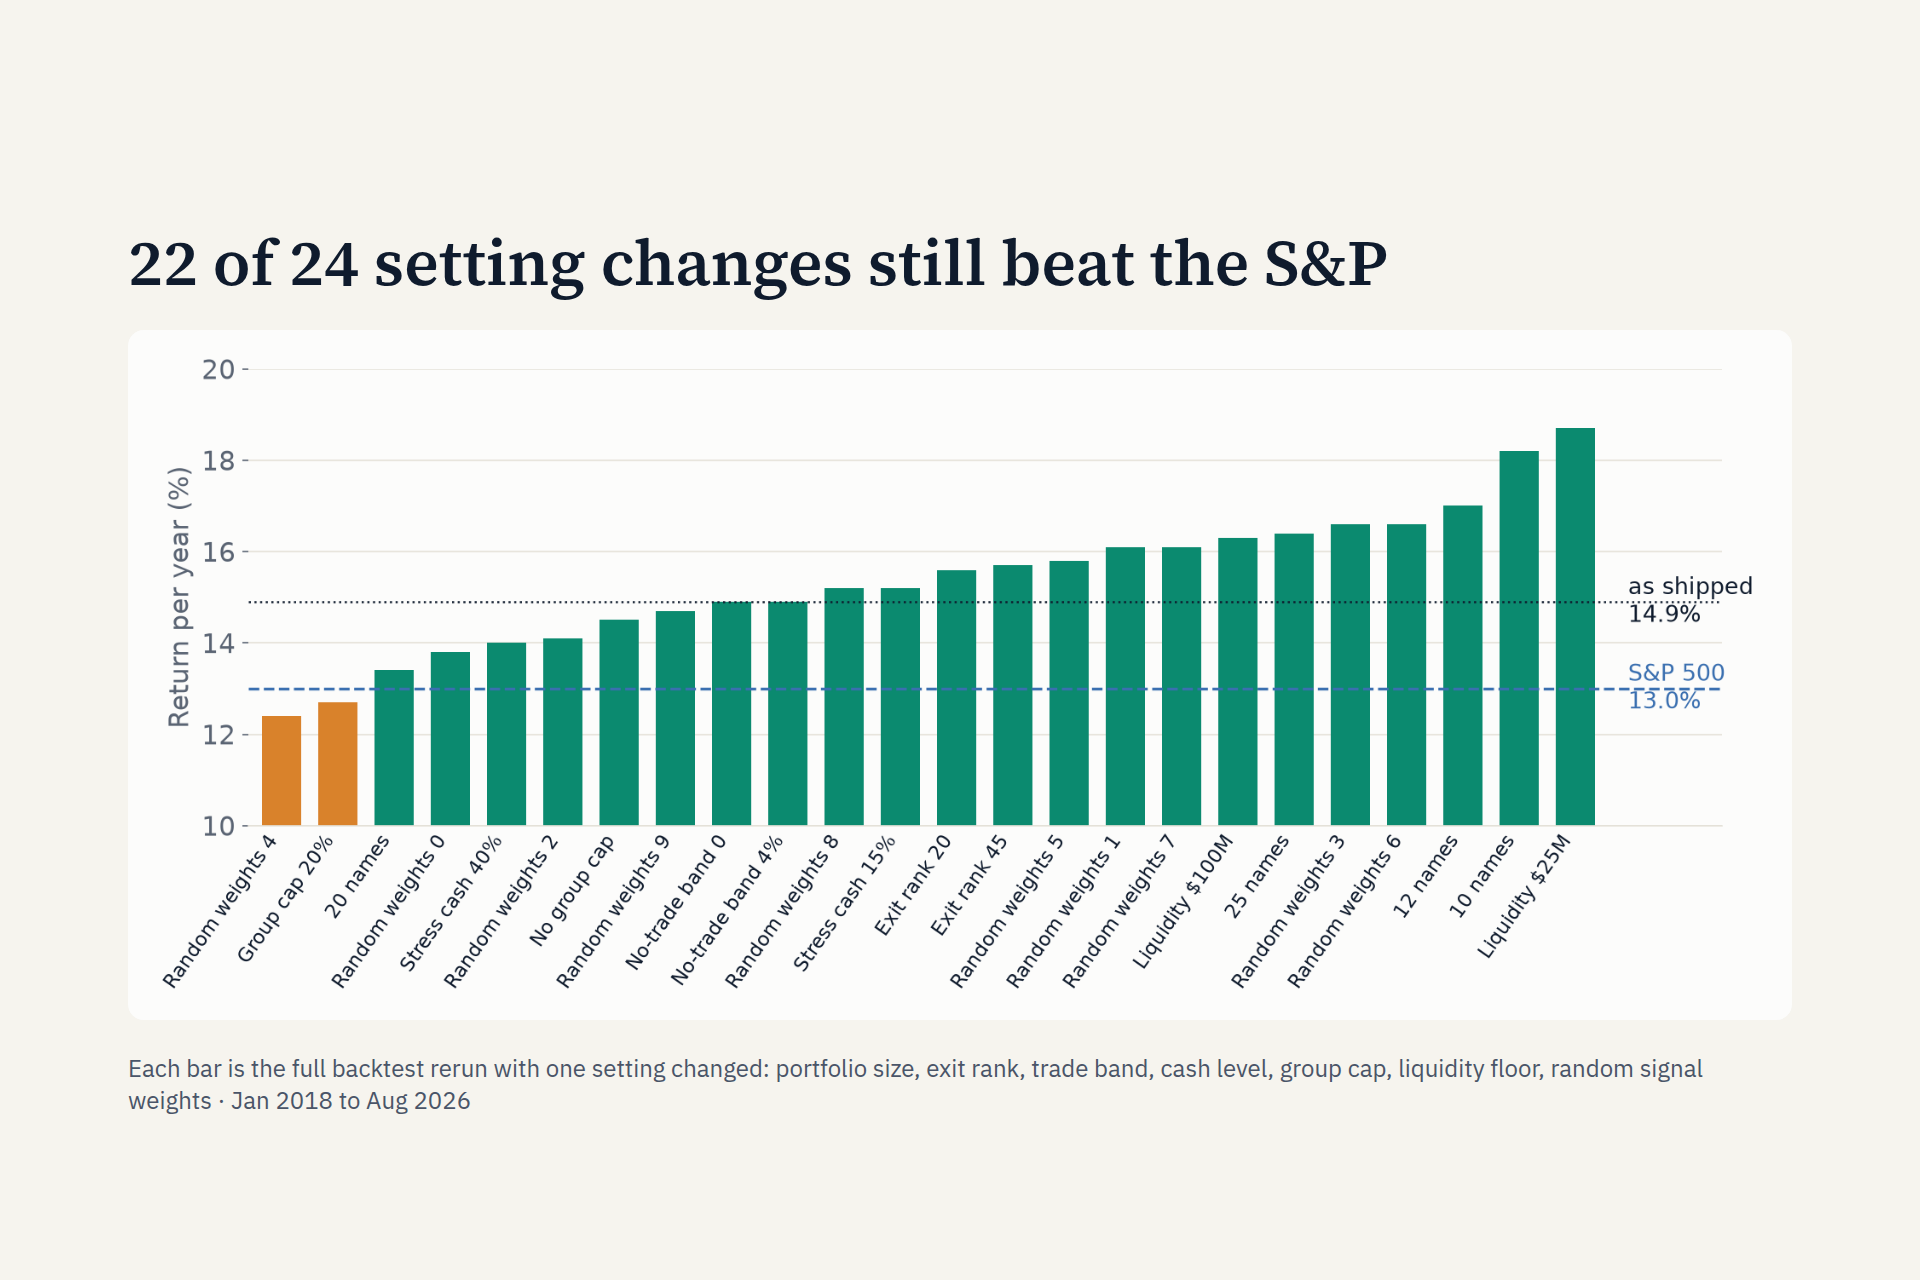
- It survives changes: double trading costs give 13.1%, trading at the next open 13.2%, and data one day late 12.4%. Late data makes it worse, never better, which is a sign we aren't peeking at the future.
- It beat 16 of 20 random portfolios run under the same rules.
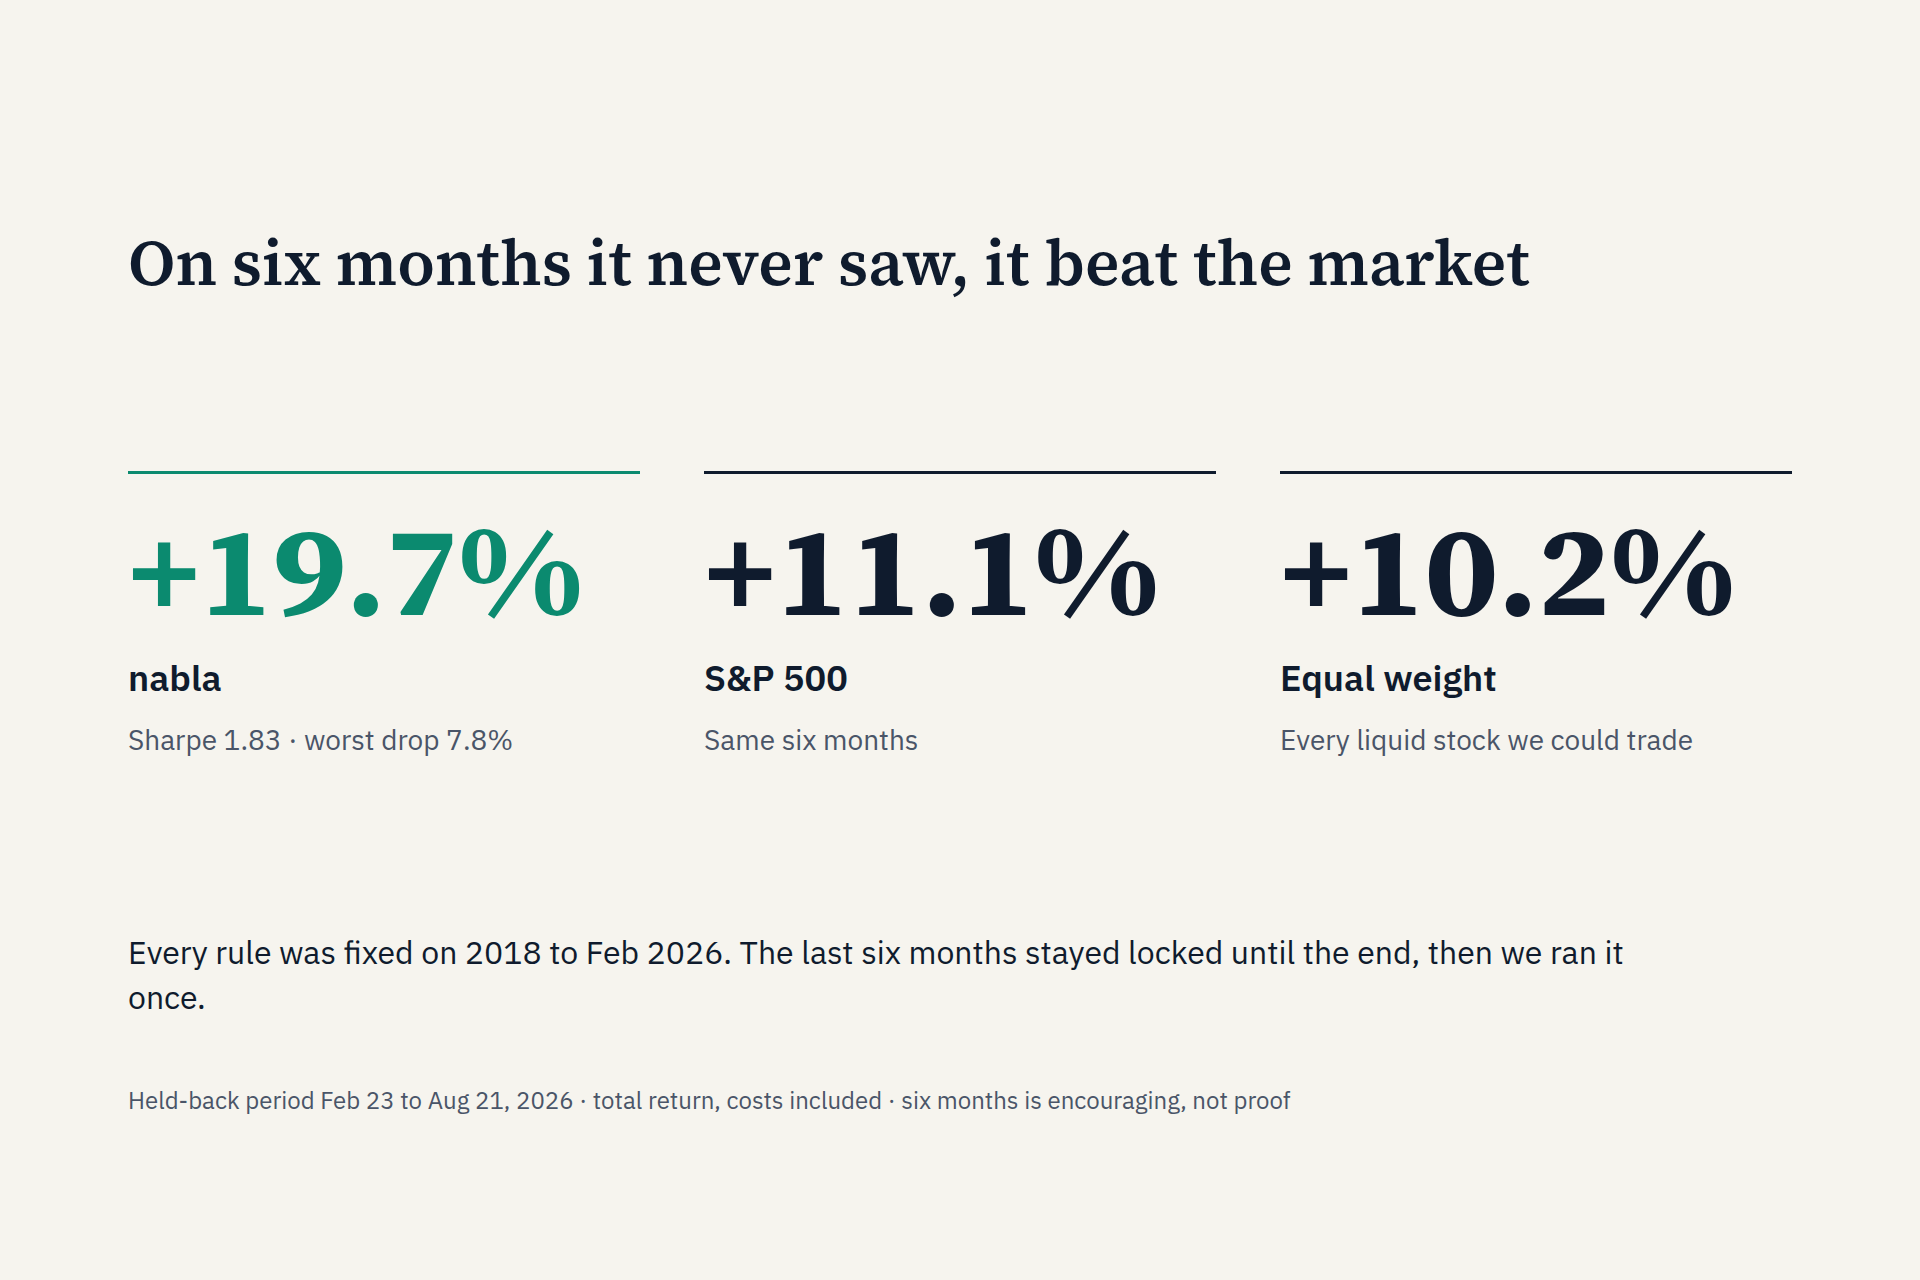
- First true out-of-sample test: on six months we held back and never touched while building, the frozen model returned +19.7% with a 7.8% worst drawdown (Sharpe 1.83).
- Everything is written down: every test, decision and rejected idea is in
docs/AUDIT.md.
What we learned
- With about 100 months of history, even good signals can't be told apart from luck statistically. Robust and simple beats clever.
- A backtest is only as honest as its worst assumption. Ours moved 3.4 points a year just from how stocks were grouped.
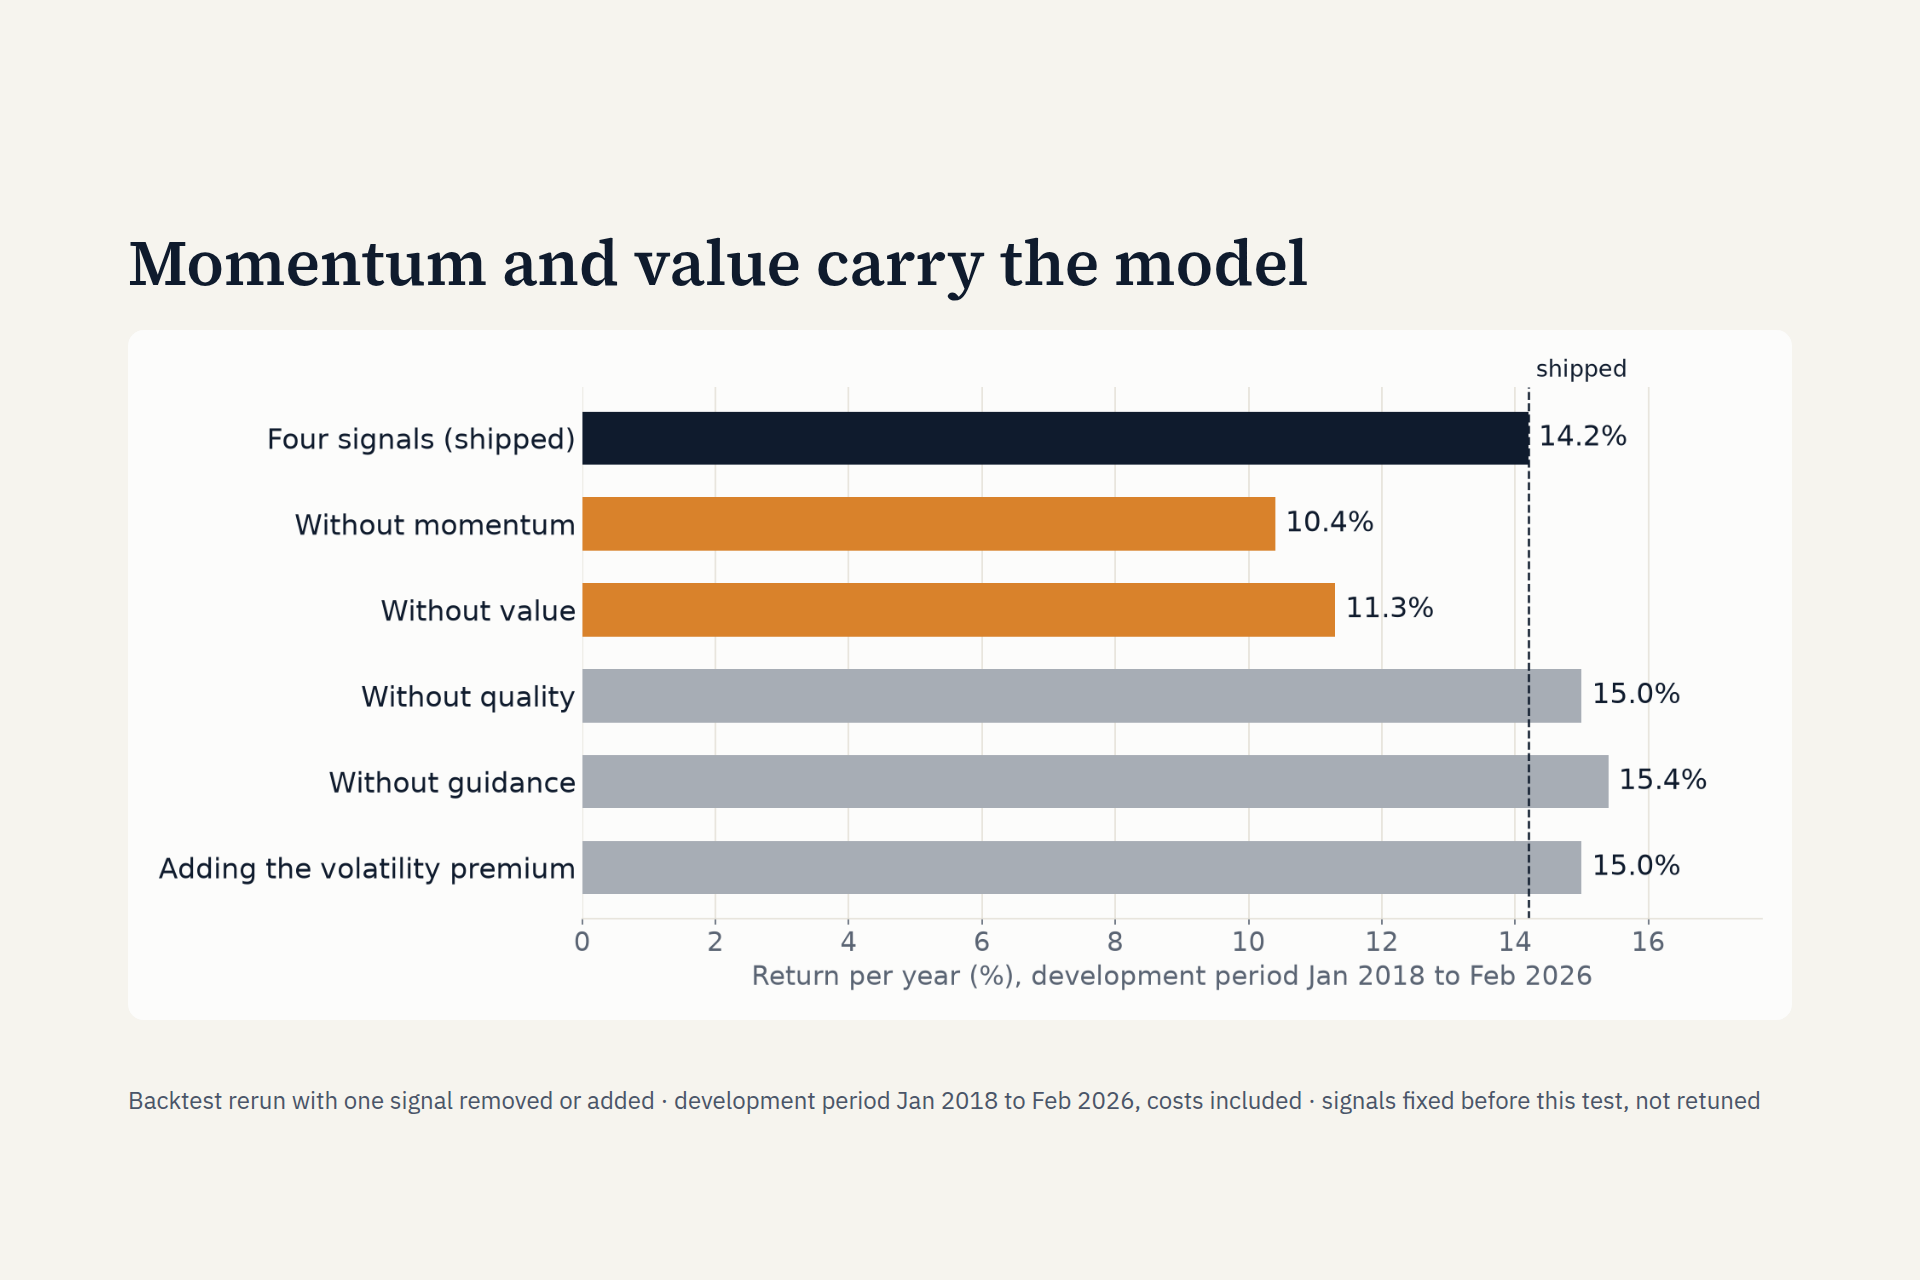
- Momentum and value carried our model. Quality and guidance didn't help on this data, but we didn't drop them, because choosing signals on the same data you test them on just fits the past.
- Writing the rule for "ship or don't" before running a test is the single best defense against fooling yourself.
What's next for Nabla
- Data that includes delisted companies, to remove survivorship bias.
- A longer history with more market crashes.
- Real trading-cost measurements instead of modeled ones.
- Testing other portfolio sizes and cash levels, each with a ship rule written before the test.


Log in or sign up for Devpost to join the conversation.