Inspiration
Coronary artery disease is usually confirmed by catheterisation, an invasive test. Routine clinical data such as history, ECG, blood tests and echo already carry a lot of signal. I wanted to turn that signal into something a clinician or student can see and question: not just "high risk", but which artery, how likely, and why.
What it does
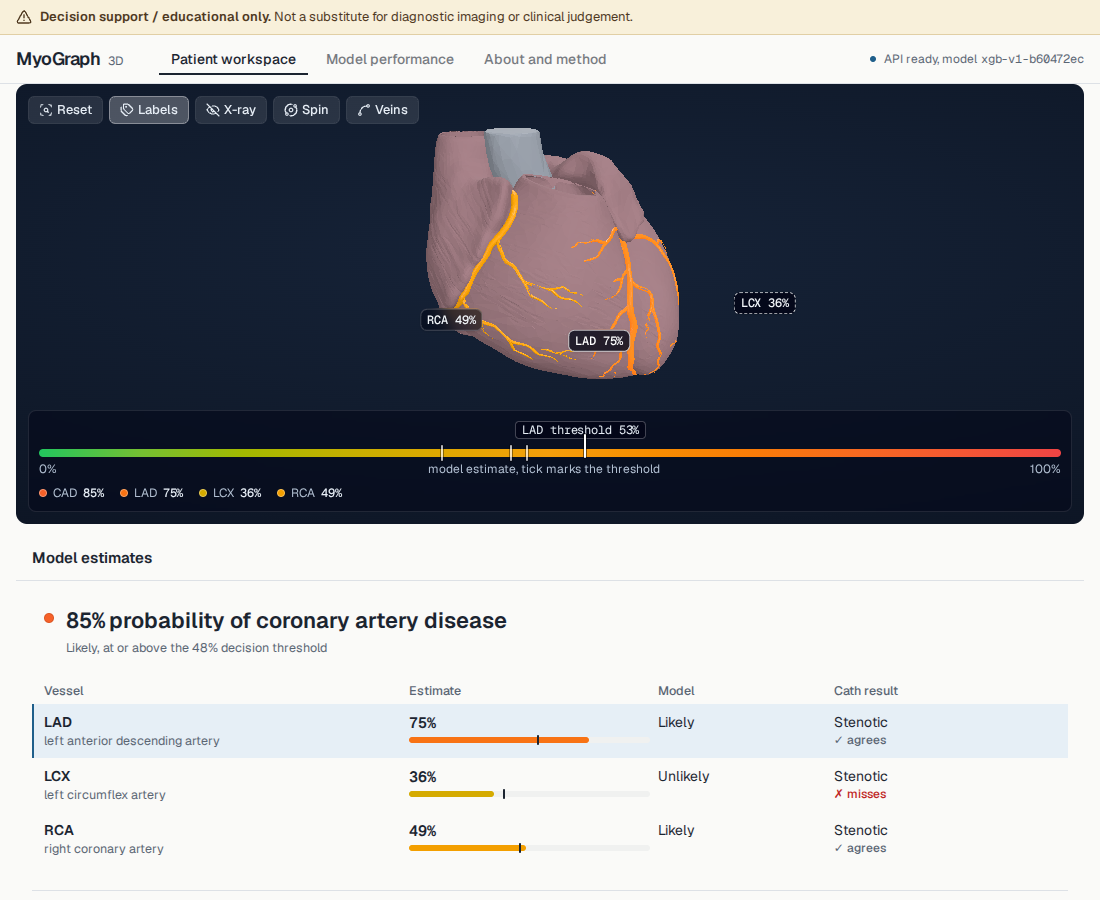
Live demo: https://myograph-3d.netlify.app/ (free hosting; the first load can take up to a minute while the server wakes up). MyoGraph 3D takes 49 routine clinical inputs and estimates:
- the overall probability of coronary artery disease, and
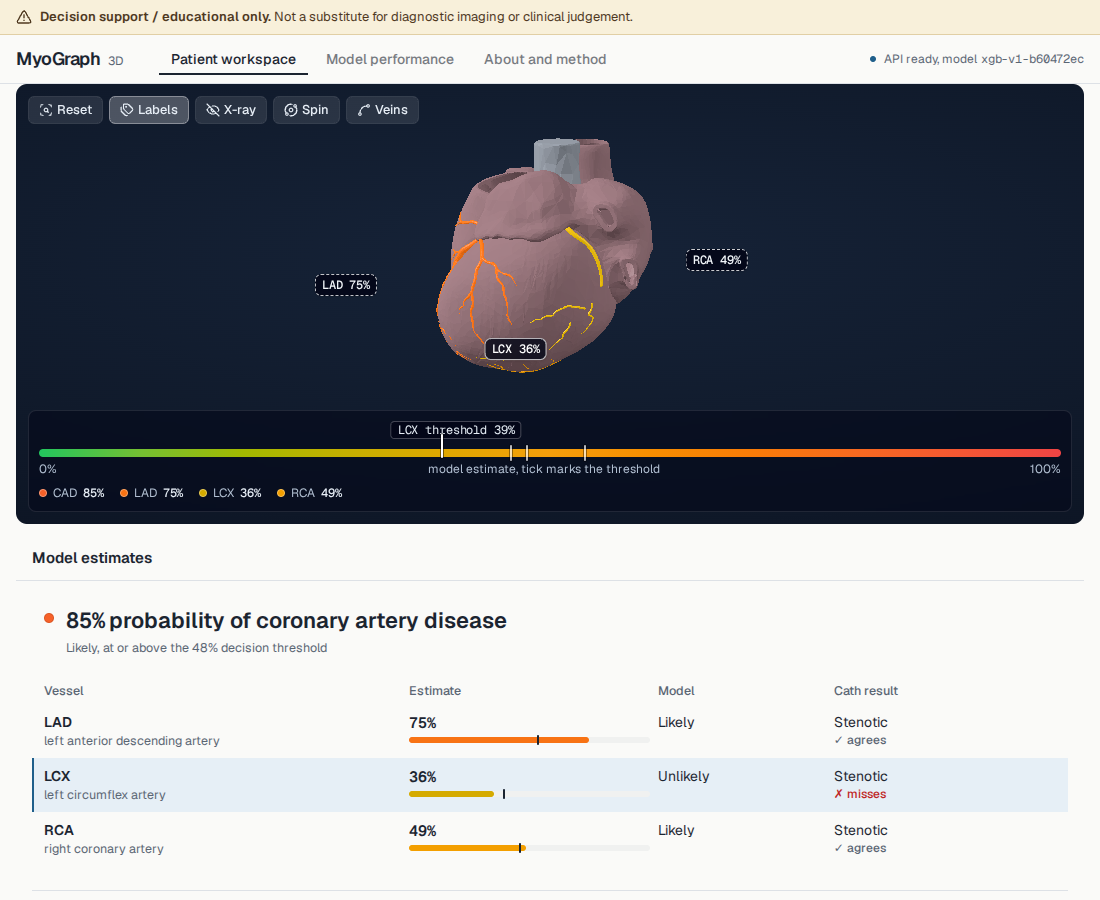
- the probability of stenosis in each of the three main coronary arteries: LAD, LCX and RCA.
Each estimate is painted onto its own artery on an interactive 3D heart, and the number always sits next to the colour. You can rotate and zoom, select an artery to turn the heart towards it, switch on X-ray mode, and hover the results table to highlight the matching vessel.
For every estimate the app also shows:
- What drives it: exact per-patient SHAP contributions, starting from the average patient and ending at this patient.
- Physiological breakdown: each measurement against its normal range.
- Plain-language summary: worded by an open-weight model on Groq and checked by a validator (no new numbers, no medical advice, disclaimer required), with a fixed template as a fallback.
Predictions update live as you edit any value. Six real hold-out patients are built in as presets, including one the model gets wrong, and the app shows that miss next to the actual catheterisation result.
How I built it
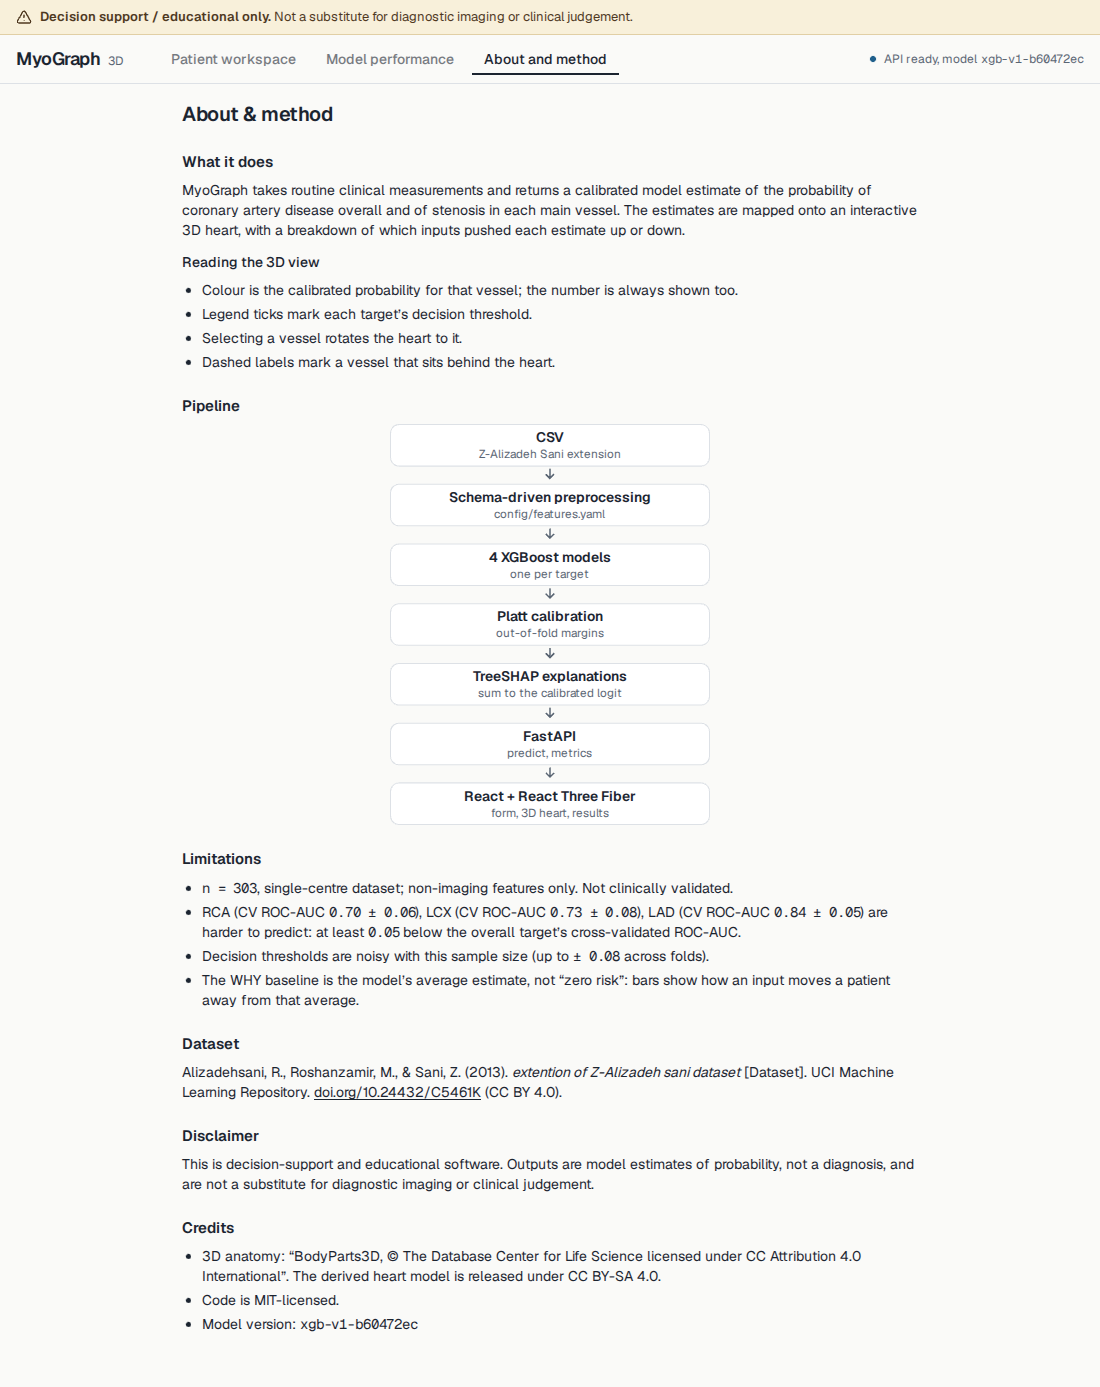
- Data: the public Extension of Z-Alizadeh Sani dataset (UCI, 303 patients). One schema file defines every feature and drives the API, the form and the models.
- Models: one XGBoost classifier per target, with Platt calibration and decision thresholds tuned by Youden's J on training data only. Explanations use XGBoost's native TreeSHAP, rescaled to the calibrated score, and a unit test checks that they add up exactly.
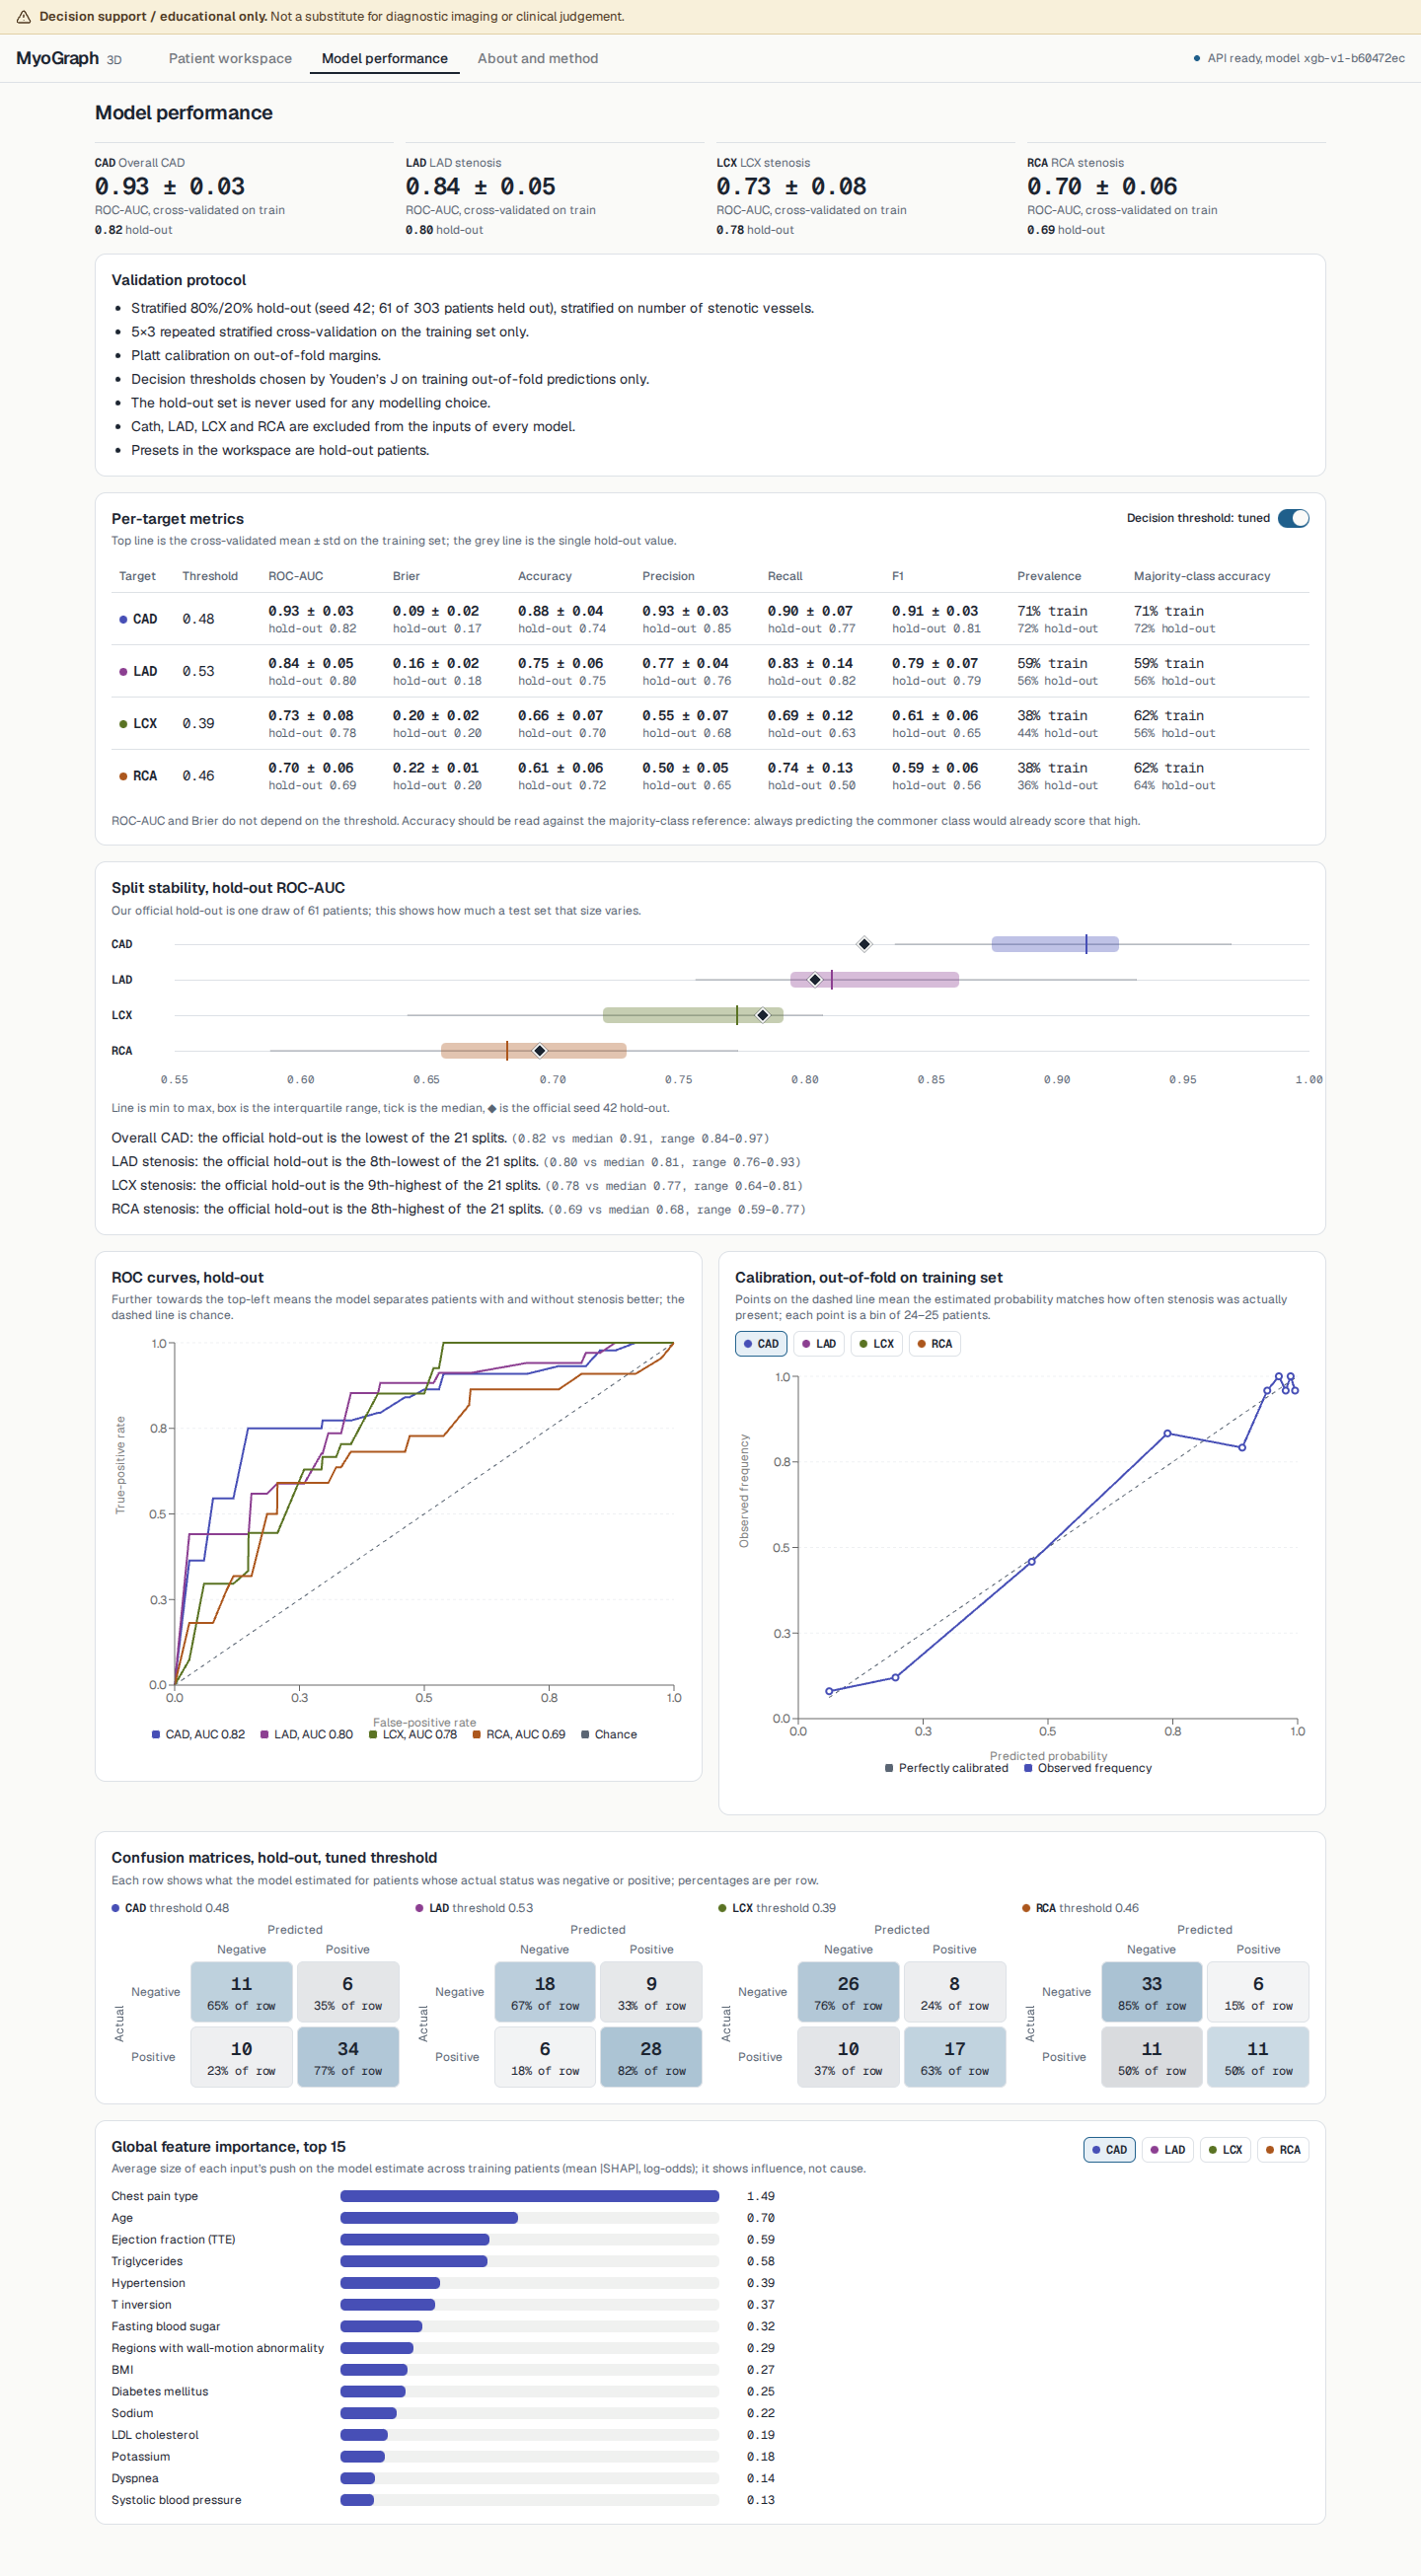
- Validation: stratified 80/20 hold-out, with all tuning and 5×3 repeated cross-validation on the training set.
- 3D: BodyParts3D 4.0 meshes, selected by FMA anatomy IDs and built into a single 67k-triangle glTF model. It renders with React Three Fiber and needs no dedicated GPU.
- App: FastAPI + Pydantic backend; React 19, TypeScript, Tailwind and shadcn/ui frontend, with API types generated from the backend schema. Packaged with Docker Compose (FastAPI behind nginx) and covered by 63 automated tests.
- Extensible by design: adding a feature, a model or another artery is a config change and a retrain, not a redesign.
Challenges I ran into
- Mapping anatomy to model outputs: BodyParts3D 4.0 renamed its mesh files, so each artery had to be traced from its FMA ID through the parts list to the right mesh.
- Labels for hidden vessels: from the front, the LCX sits behind the heart. Its label now moves outside the heart's outline with a dashed border, and selecting an artery turns the heart to face it.
- Honest evaluation on 303 patients: small data makes scores swing between splits. I used repeated cross-validation, calibrated probabilities and a 21-split stability study.
- Keeping an AI-written summary trustworthy: a validator rejects any reply that changes a number, gives advice or drops the disclaimer.
Accomplishments that I'm proud of
- Strong overall performance, reported transparently:
- CAD (overall): CV ROC-AUC 0.932 ± 0.030, hold-out 0.824
- LAD: CV 0.835 ± 0.054, hold-out 0.804
- LCX: CV 0.729 ± 0.080, hold-out 0.783
- RCA: CV 0.698 ± 0.058, hold-out 0.695
- The stability study showed that my official test split is the hardest of 21. I kept it rather than picking a friendlier one.
- Tuned thresholds raised cross-validated recall for LCX from 0.40 to 0.69 and for RCA from 0.31 to 0.74.
- Every displayed explanation adds up exactly to the model's output, and the app openly shows where the model is wrong.
- A complete, reproducible system that starts with one Docker command.
What I learned
On a small dataset the split alone can move the AUC a lot, so reporting the spread matters as much as the headline number. I also learned that explanations earn trust only when they add up exactly to what the model actually outputs, and that a 3D view is useful only when it stays tied to the numbers.
What's next for MyoGraph 3D
- External validation on another patient cohort
- A what-if mode that compares a patient before and after an edit
- Benchmarking other models (e.g. TabPFN) through the same interface
- More anatomical context, such as a translucent chest and ribcage
Decision support and educational use only. Not a diagnostic tool.
Built With
- bodyparts3d
- docker
- fastapi
- groq
- nginx
- pandas
- pydantic
- python
- react
- react-three-fiber
- recharts
- scikit-learn
- shadcn-ui
- tailwindcss
- tanstack-query
- three.js
- typescript
- uv
- vite
- xgboost
- zustand

Log in or sign up for Devpost to join the conversation.