Inspiration
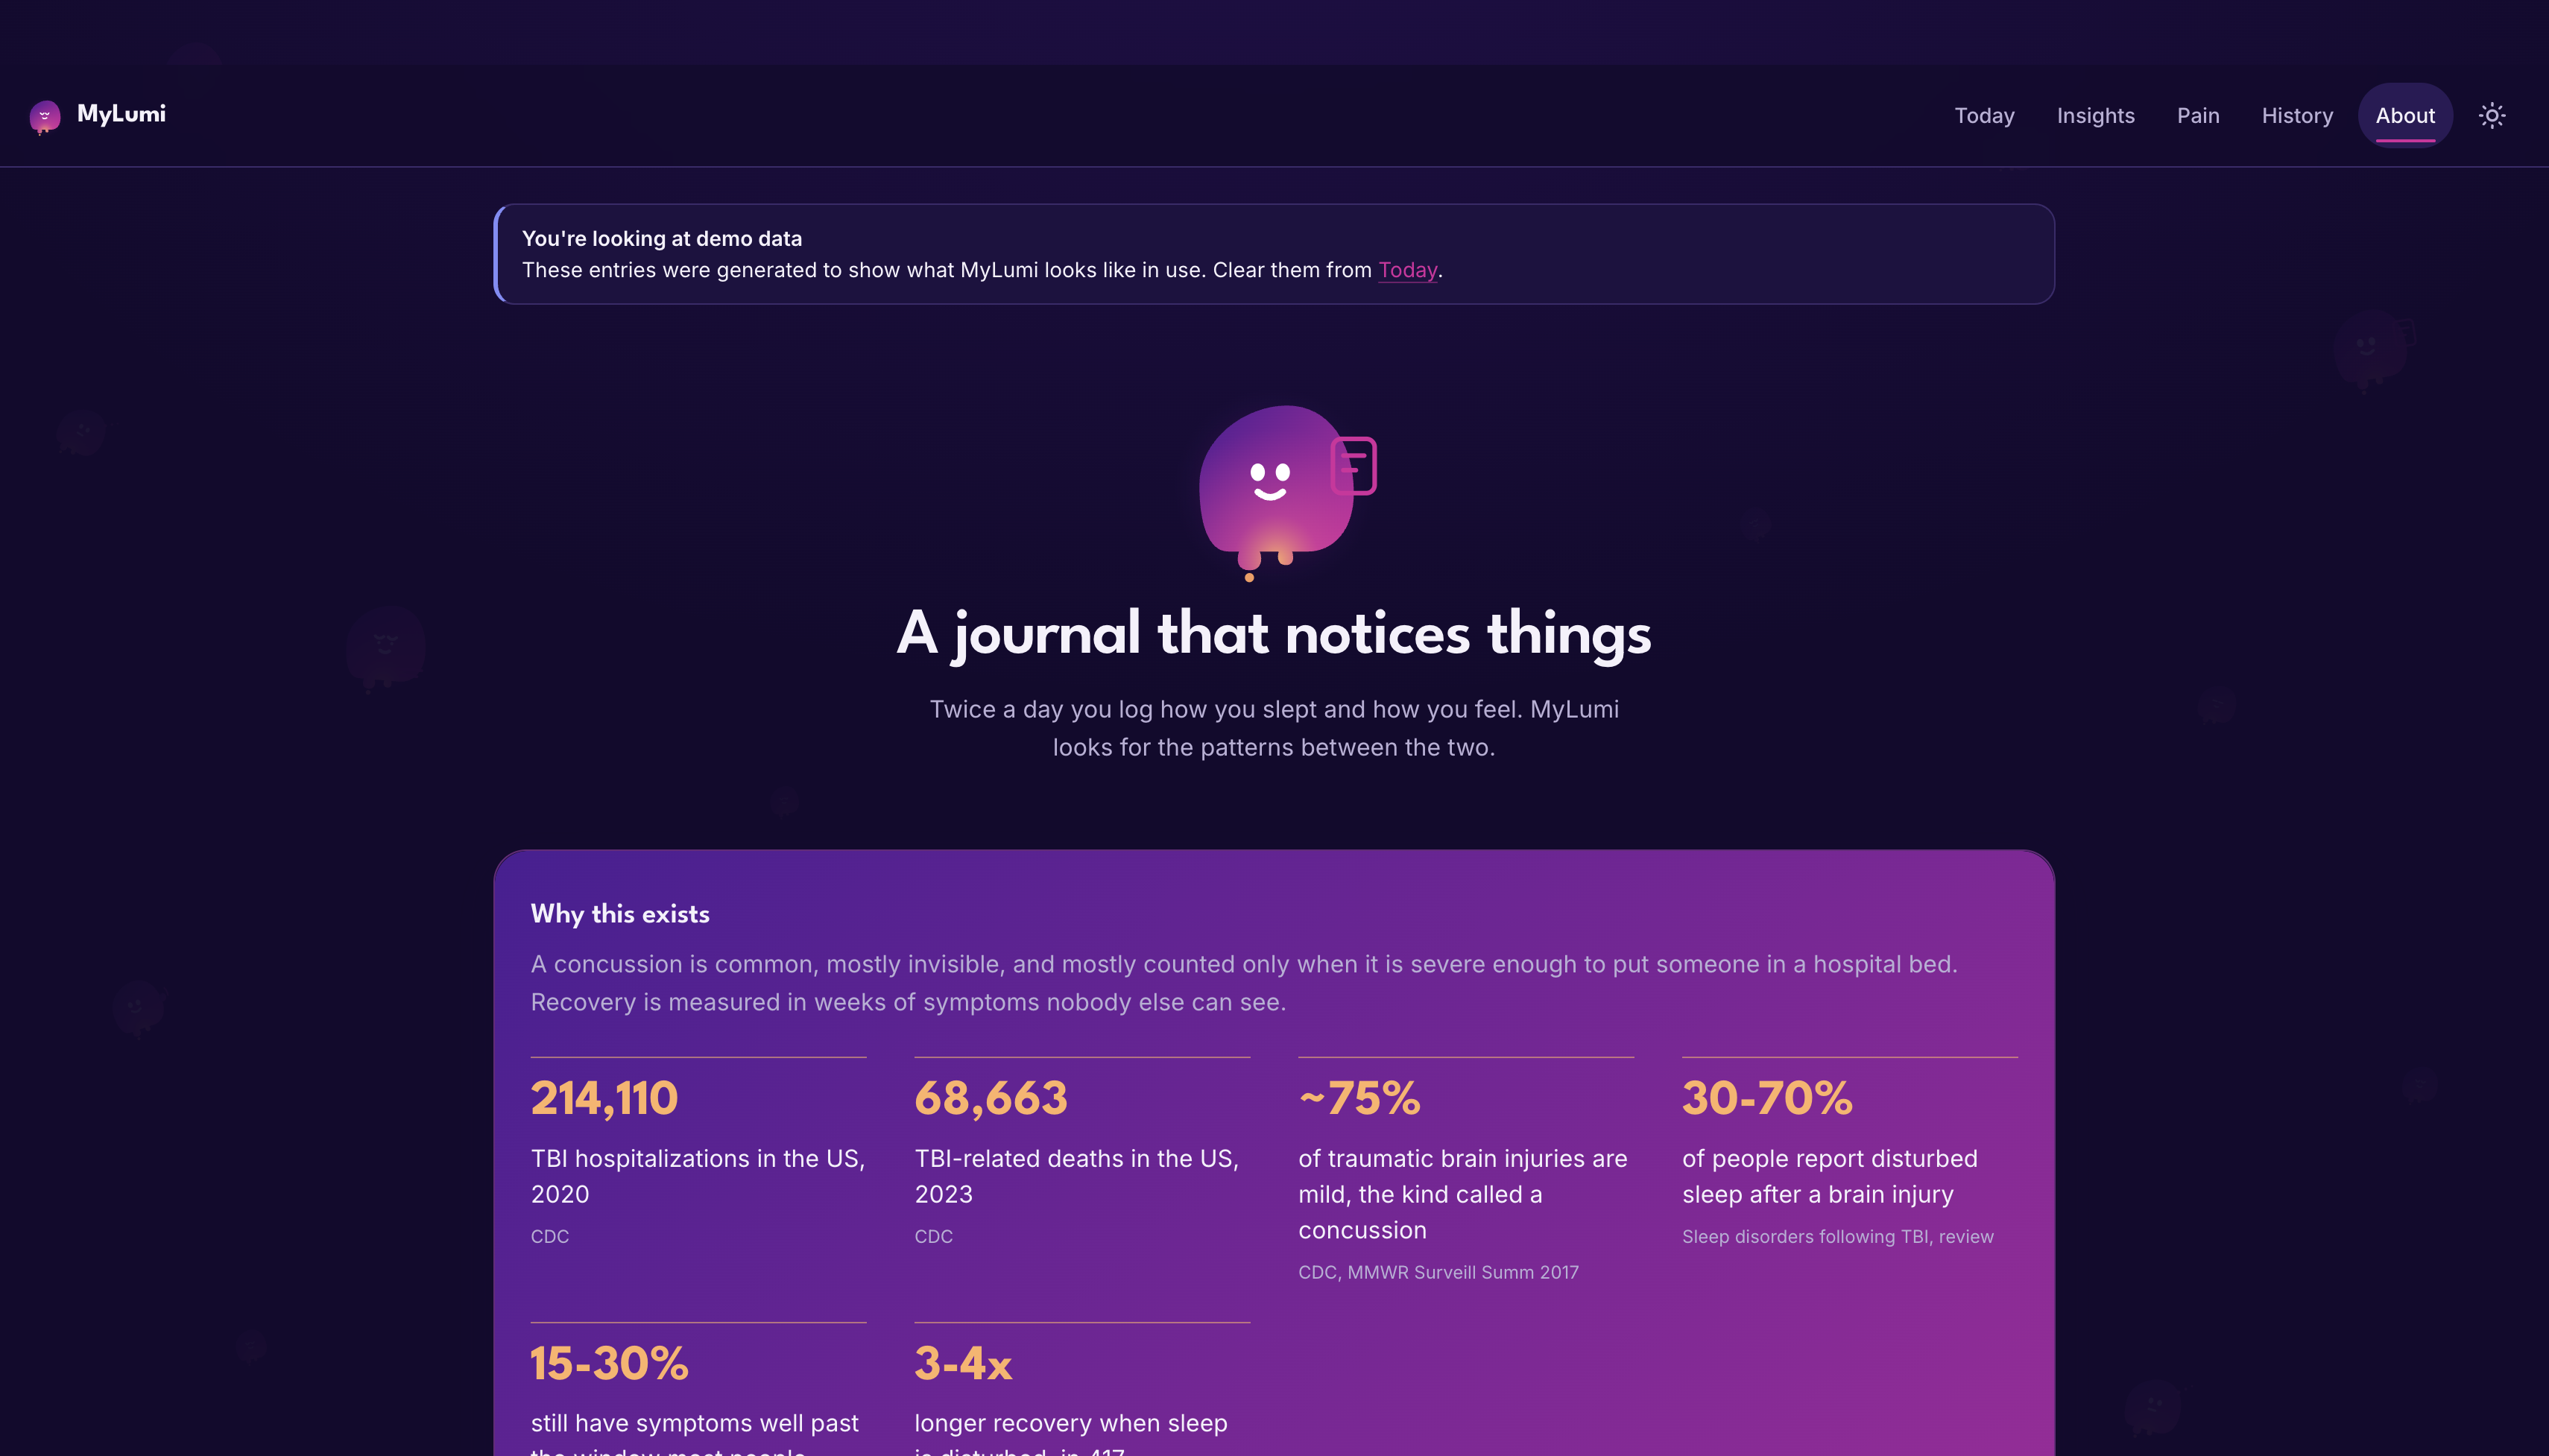
Concussion is one of the most common injuries there is, and one of the least visible. Between 30 and 70 percent of people report disturbed sleep afterwards, and in a study of 417 adolescent patients, disturbed sleep was associated with a three to four fold increase in recovery time. For 15 to 30 percent, symptoms do not settle within four weeks.
Sleep is one of the very few things in concussion recovery a person can actually change. But recovery is invisible from the inside: symptoms swing day to day, and an average recovery curve cannot tell you which line you are on.
What pushed us to build it was what we did not want to build. It would have been easy to ship something that produces a confident number from four days of data, or says "your sleep is causing your headaches," or estimates a recovery date. Each would look better in a demo and each would be a lie told to someone with a head injury. We wanted to find out whether the honest version could still be useful.
What it does
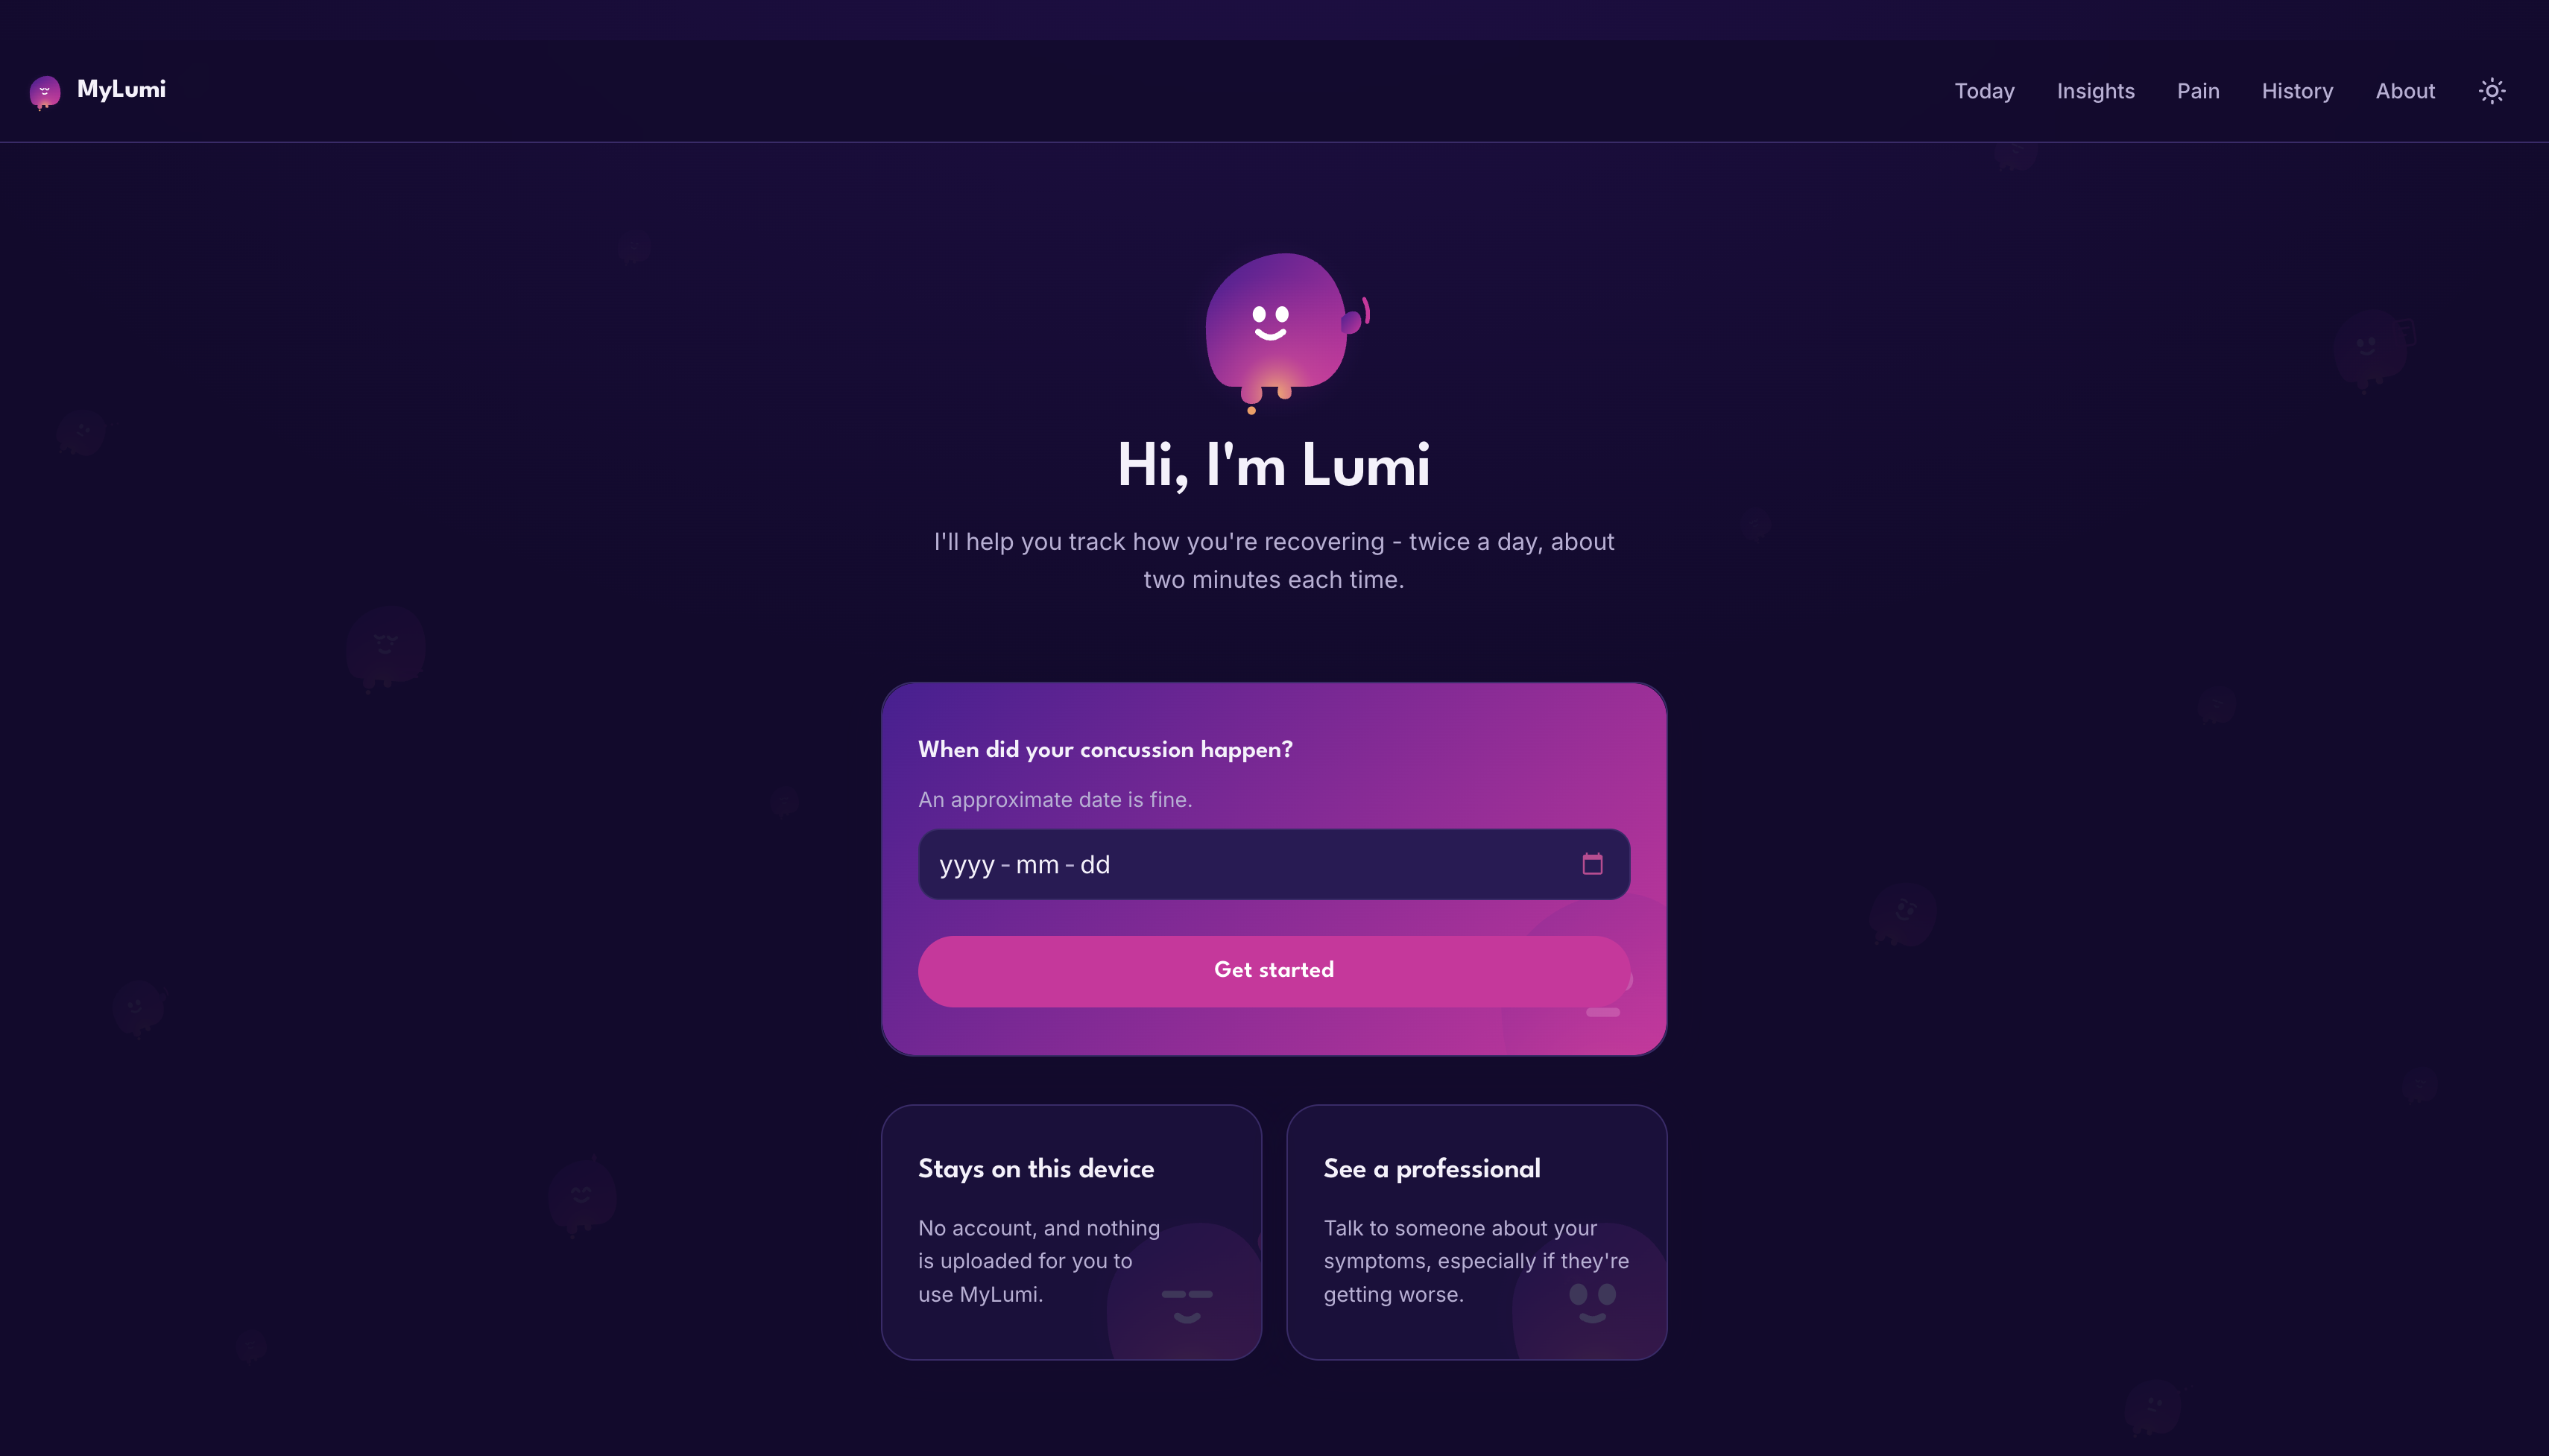
MyLumi is a concussion recovery journal that learns your own sleep and symptom pattern, and refuses to guess when it does not have the data.
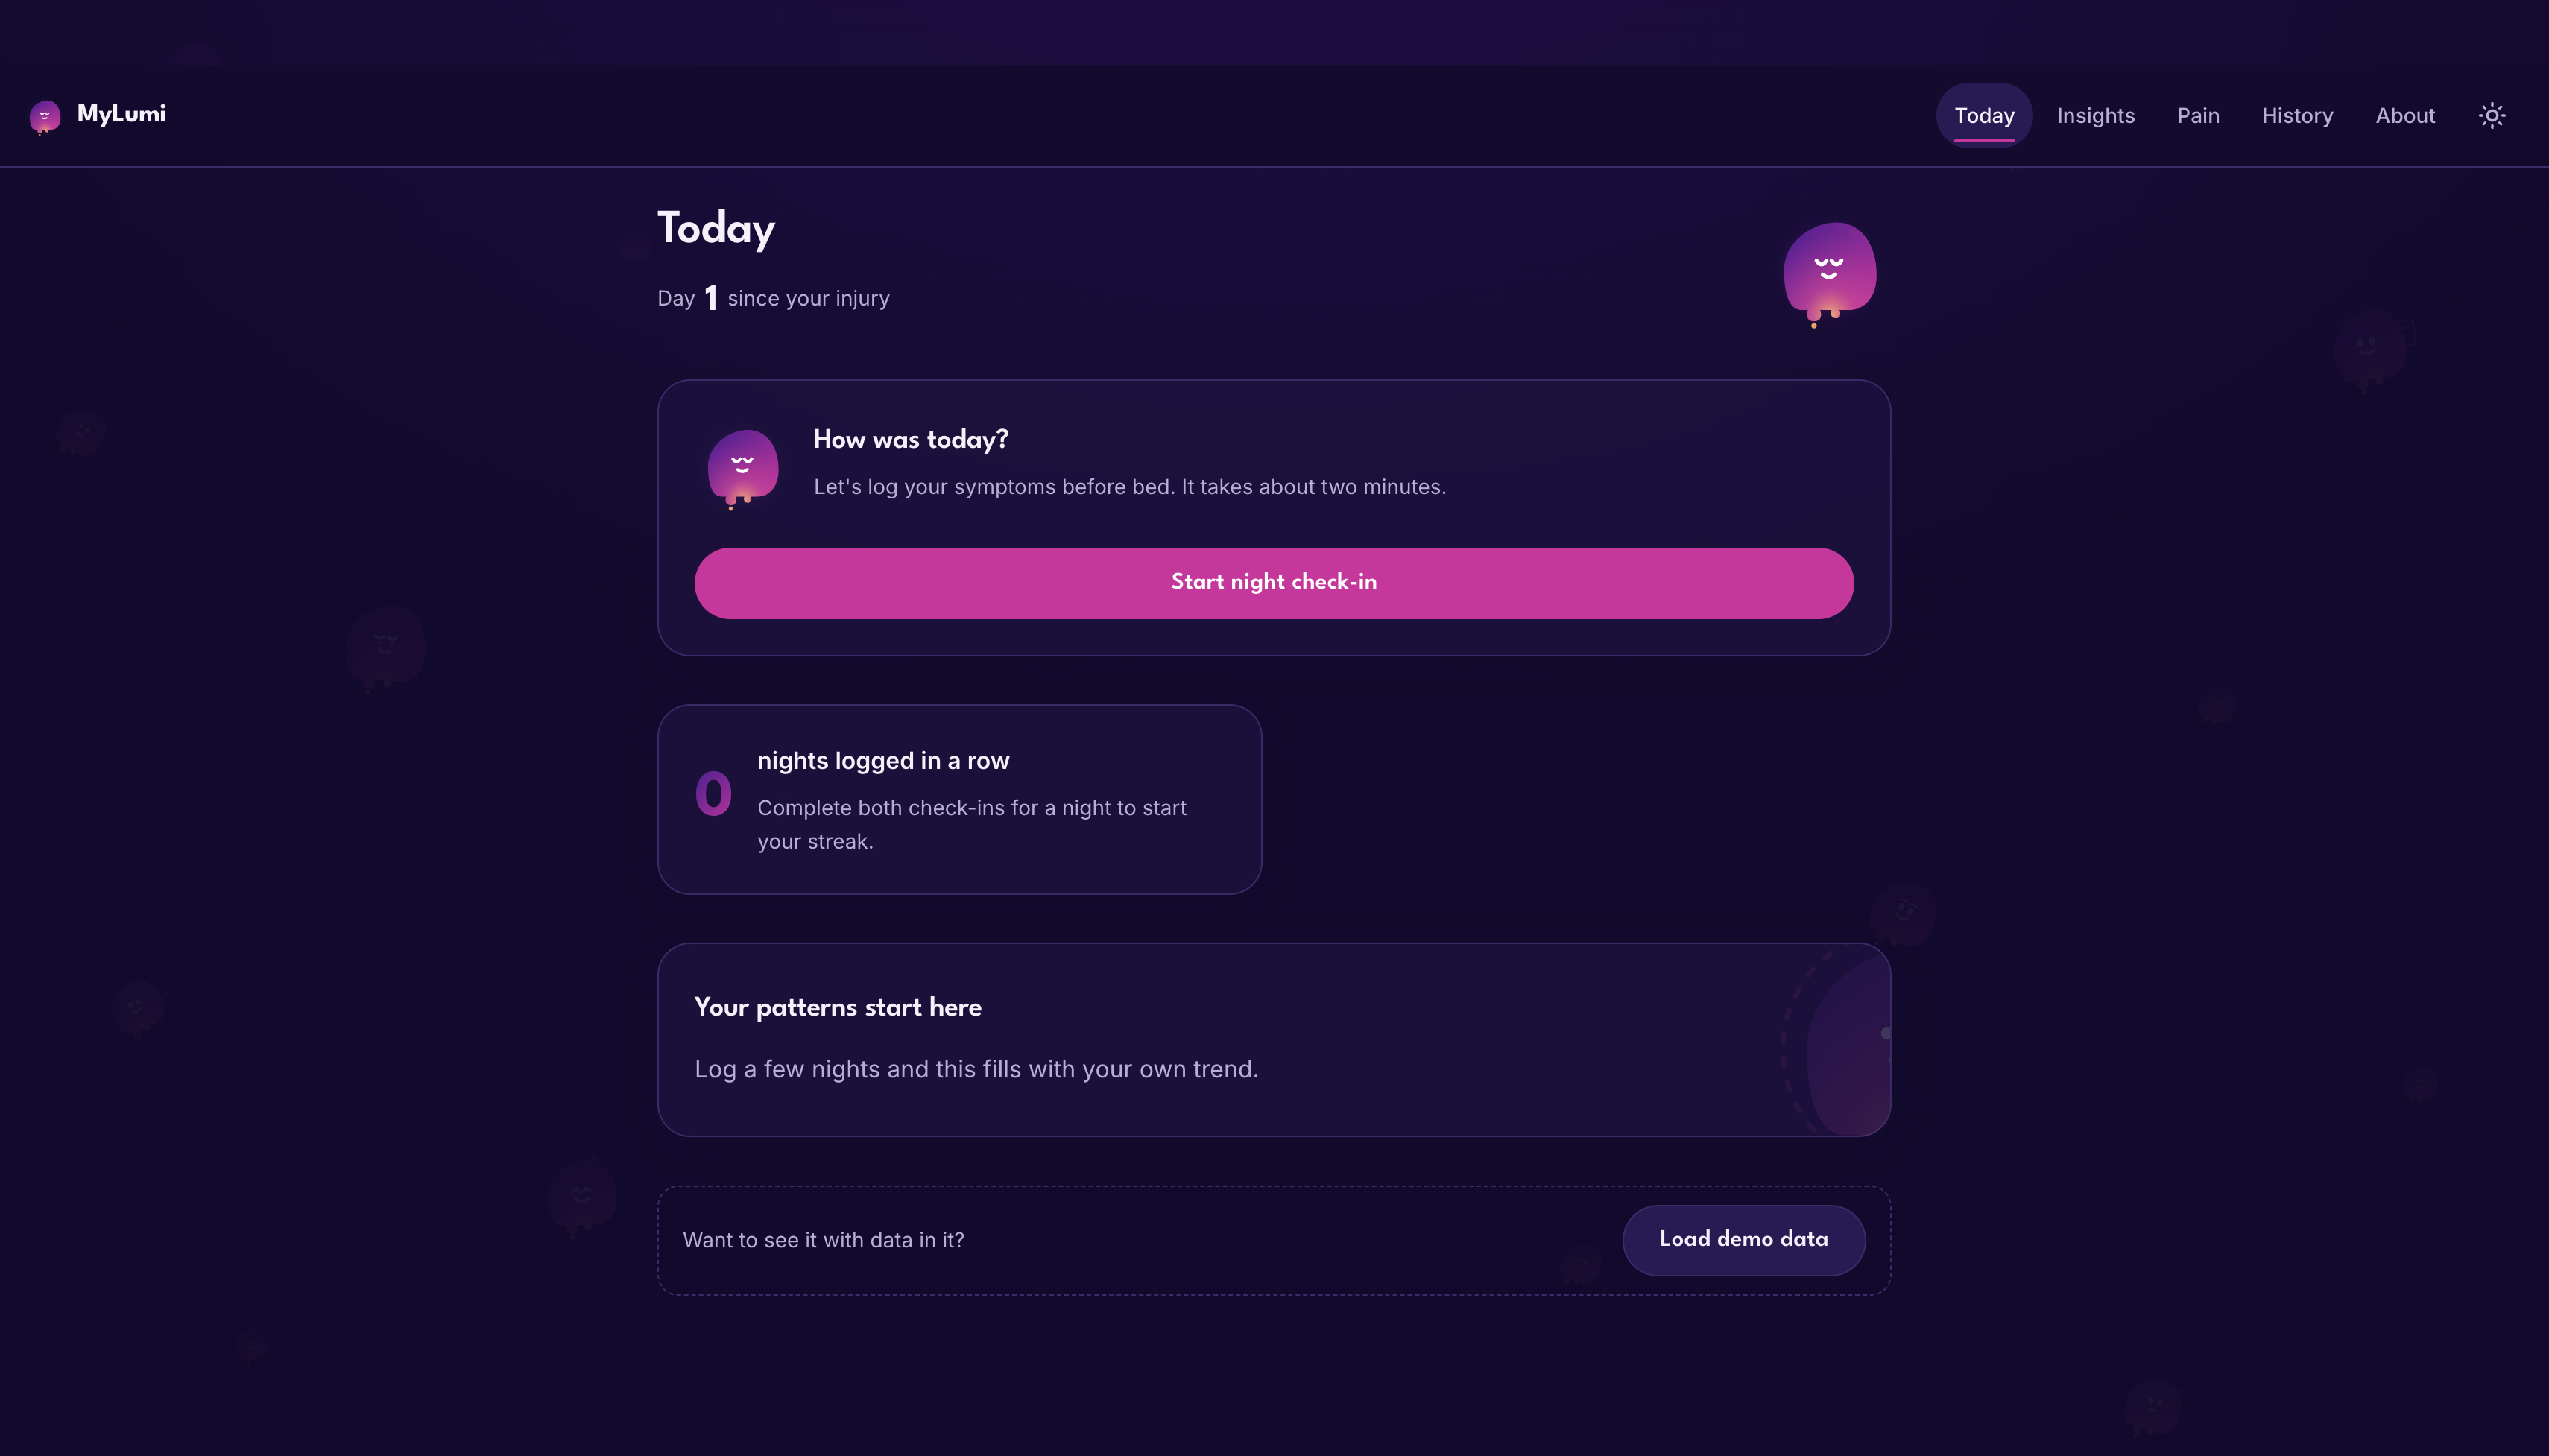
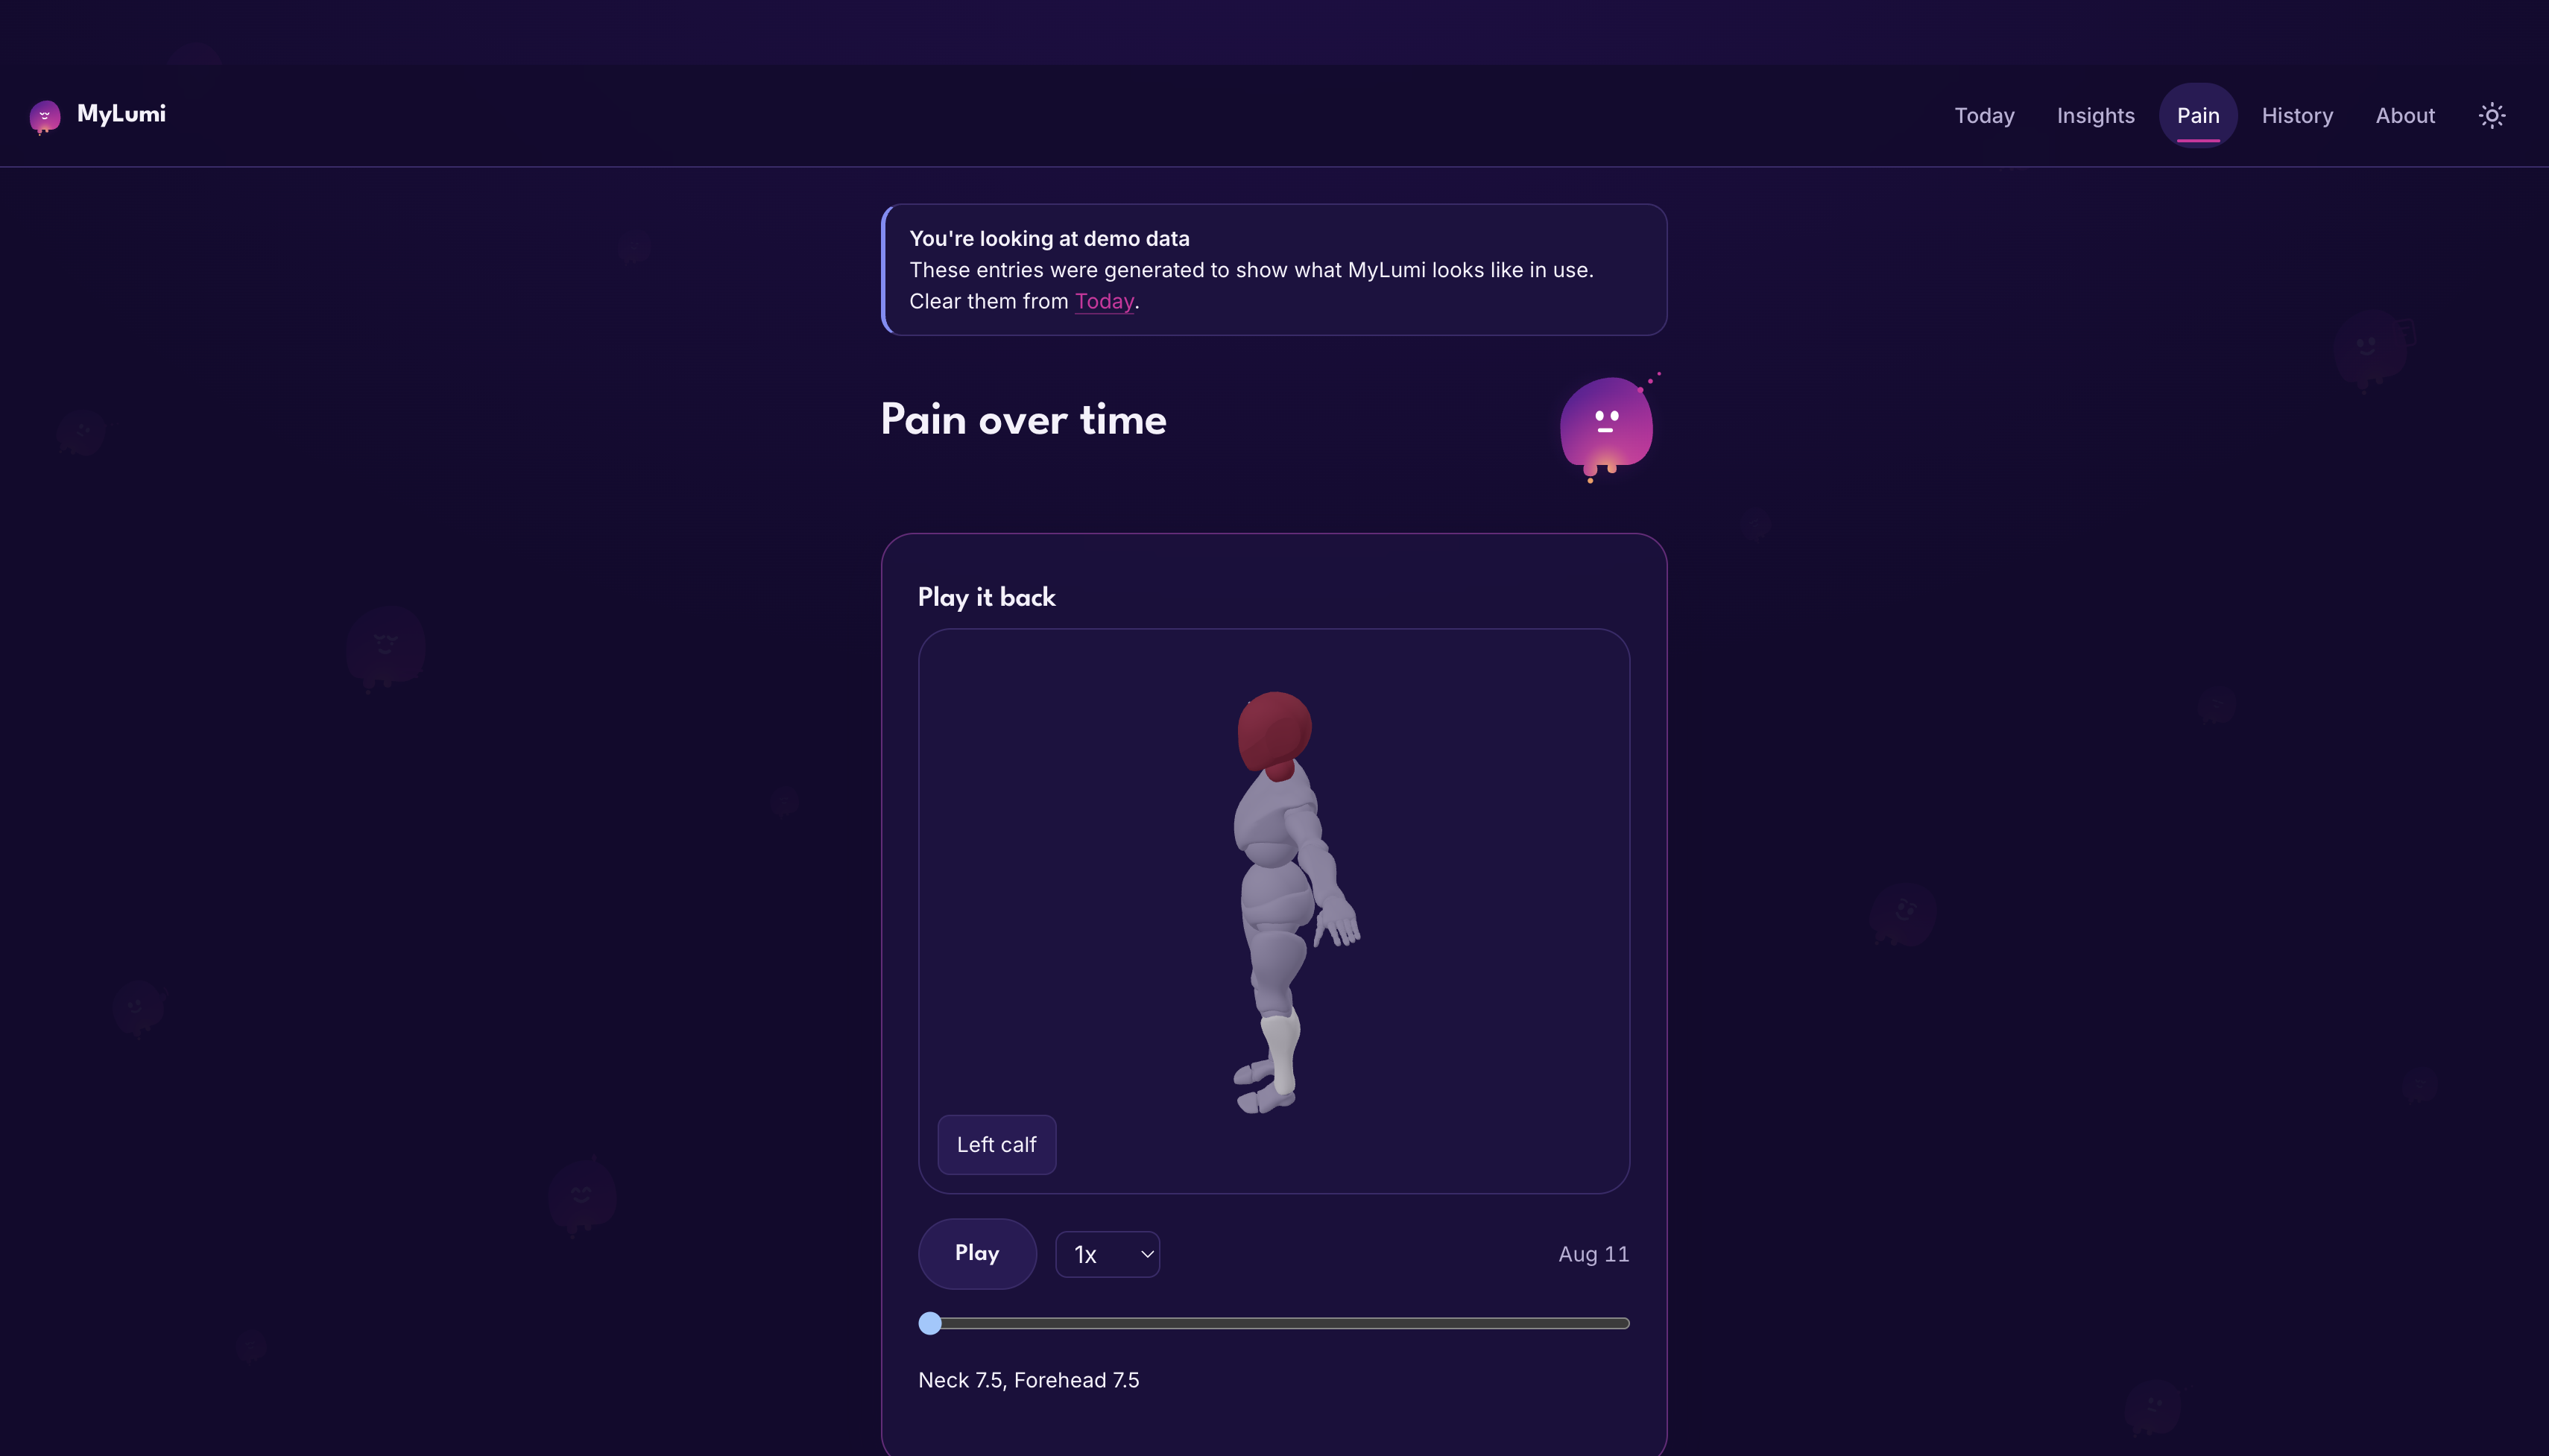
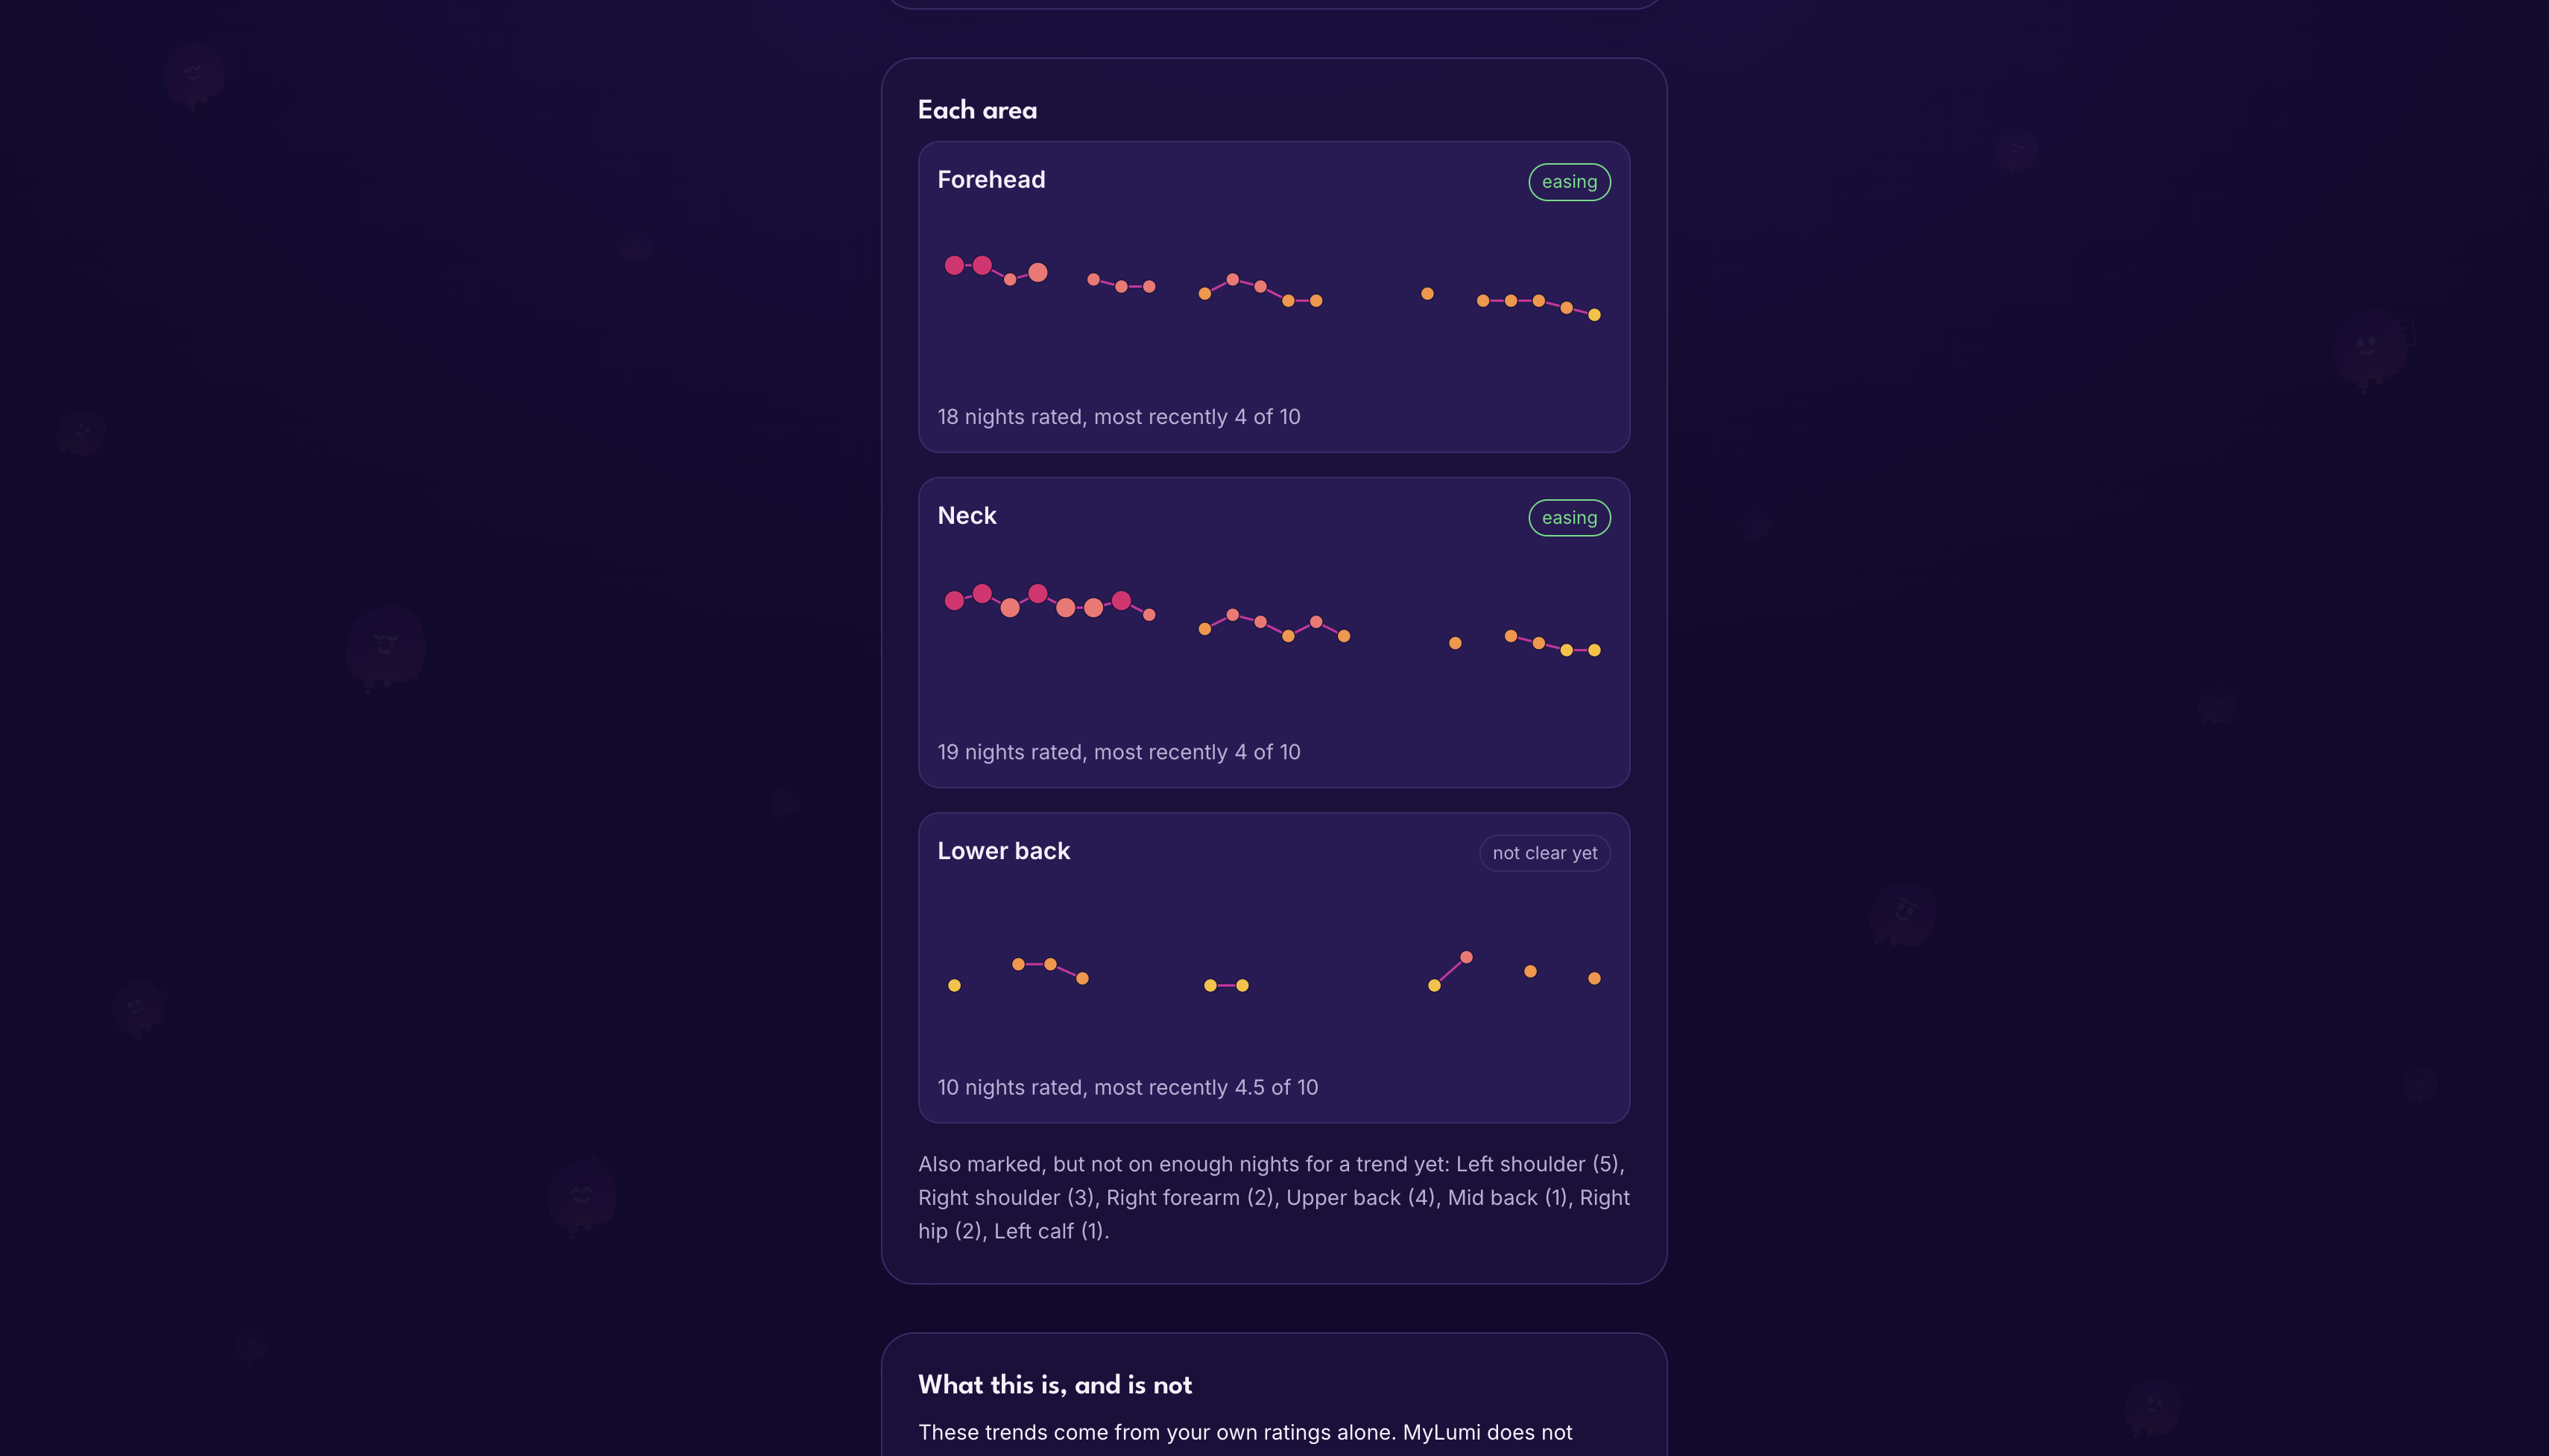
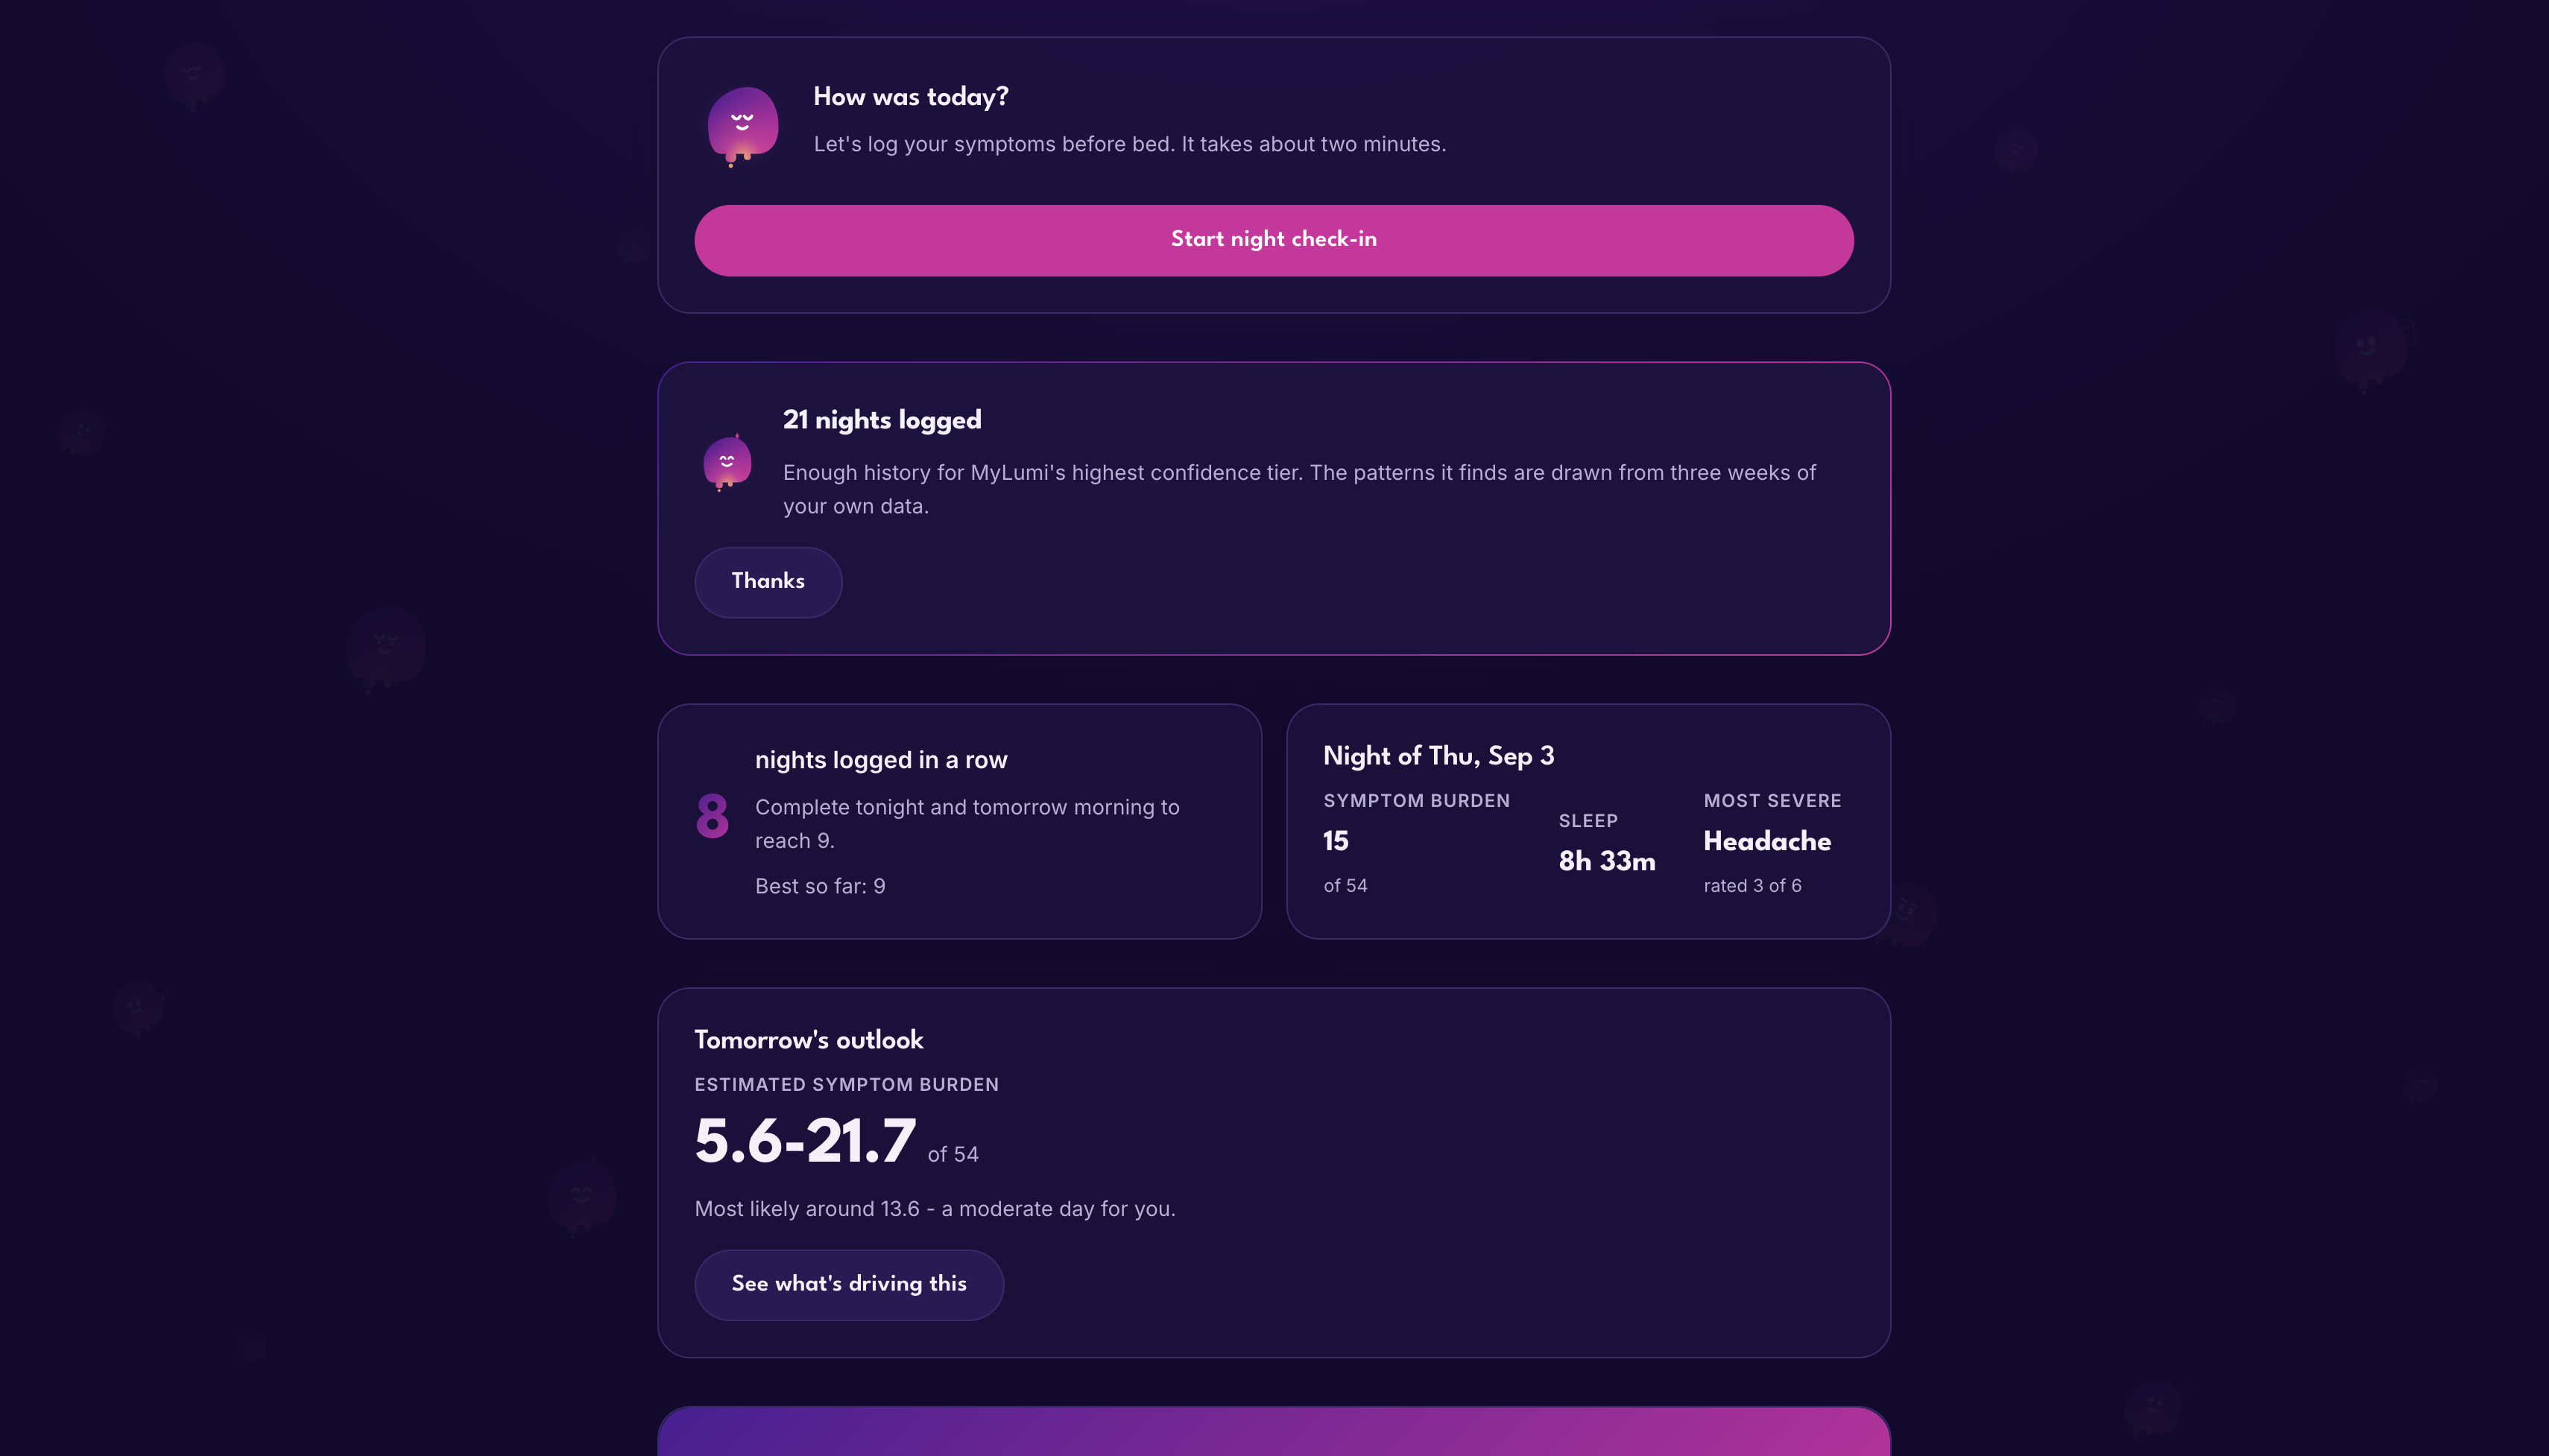
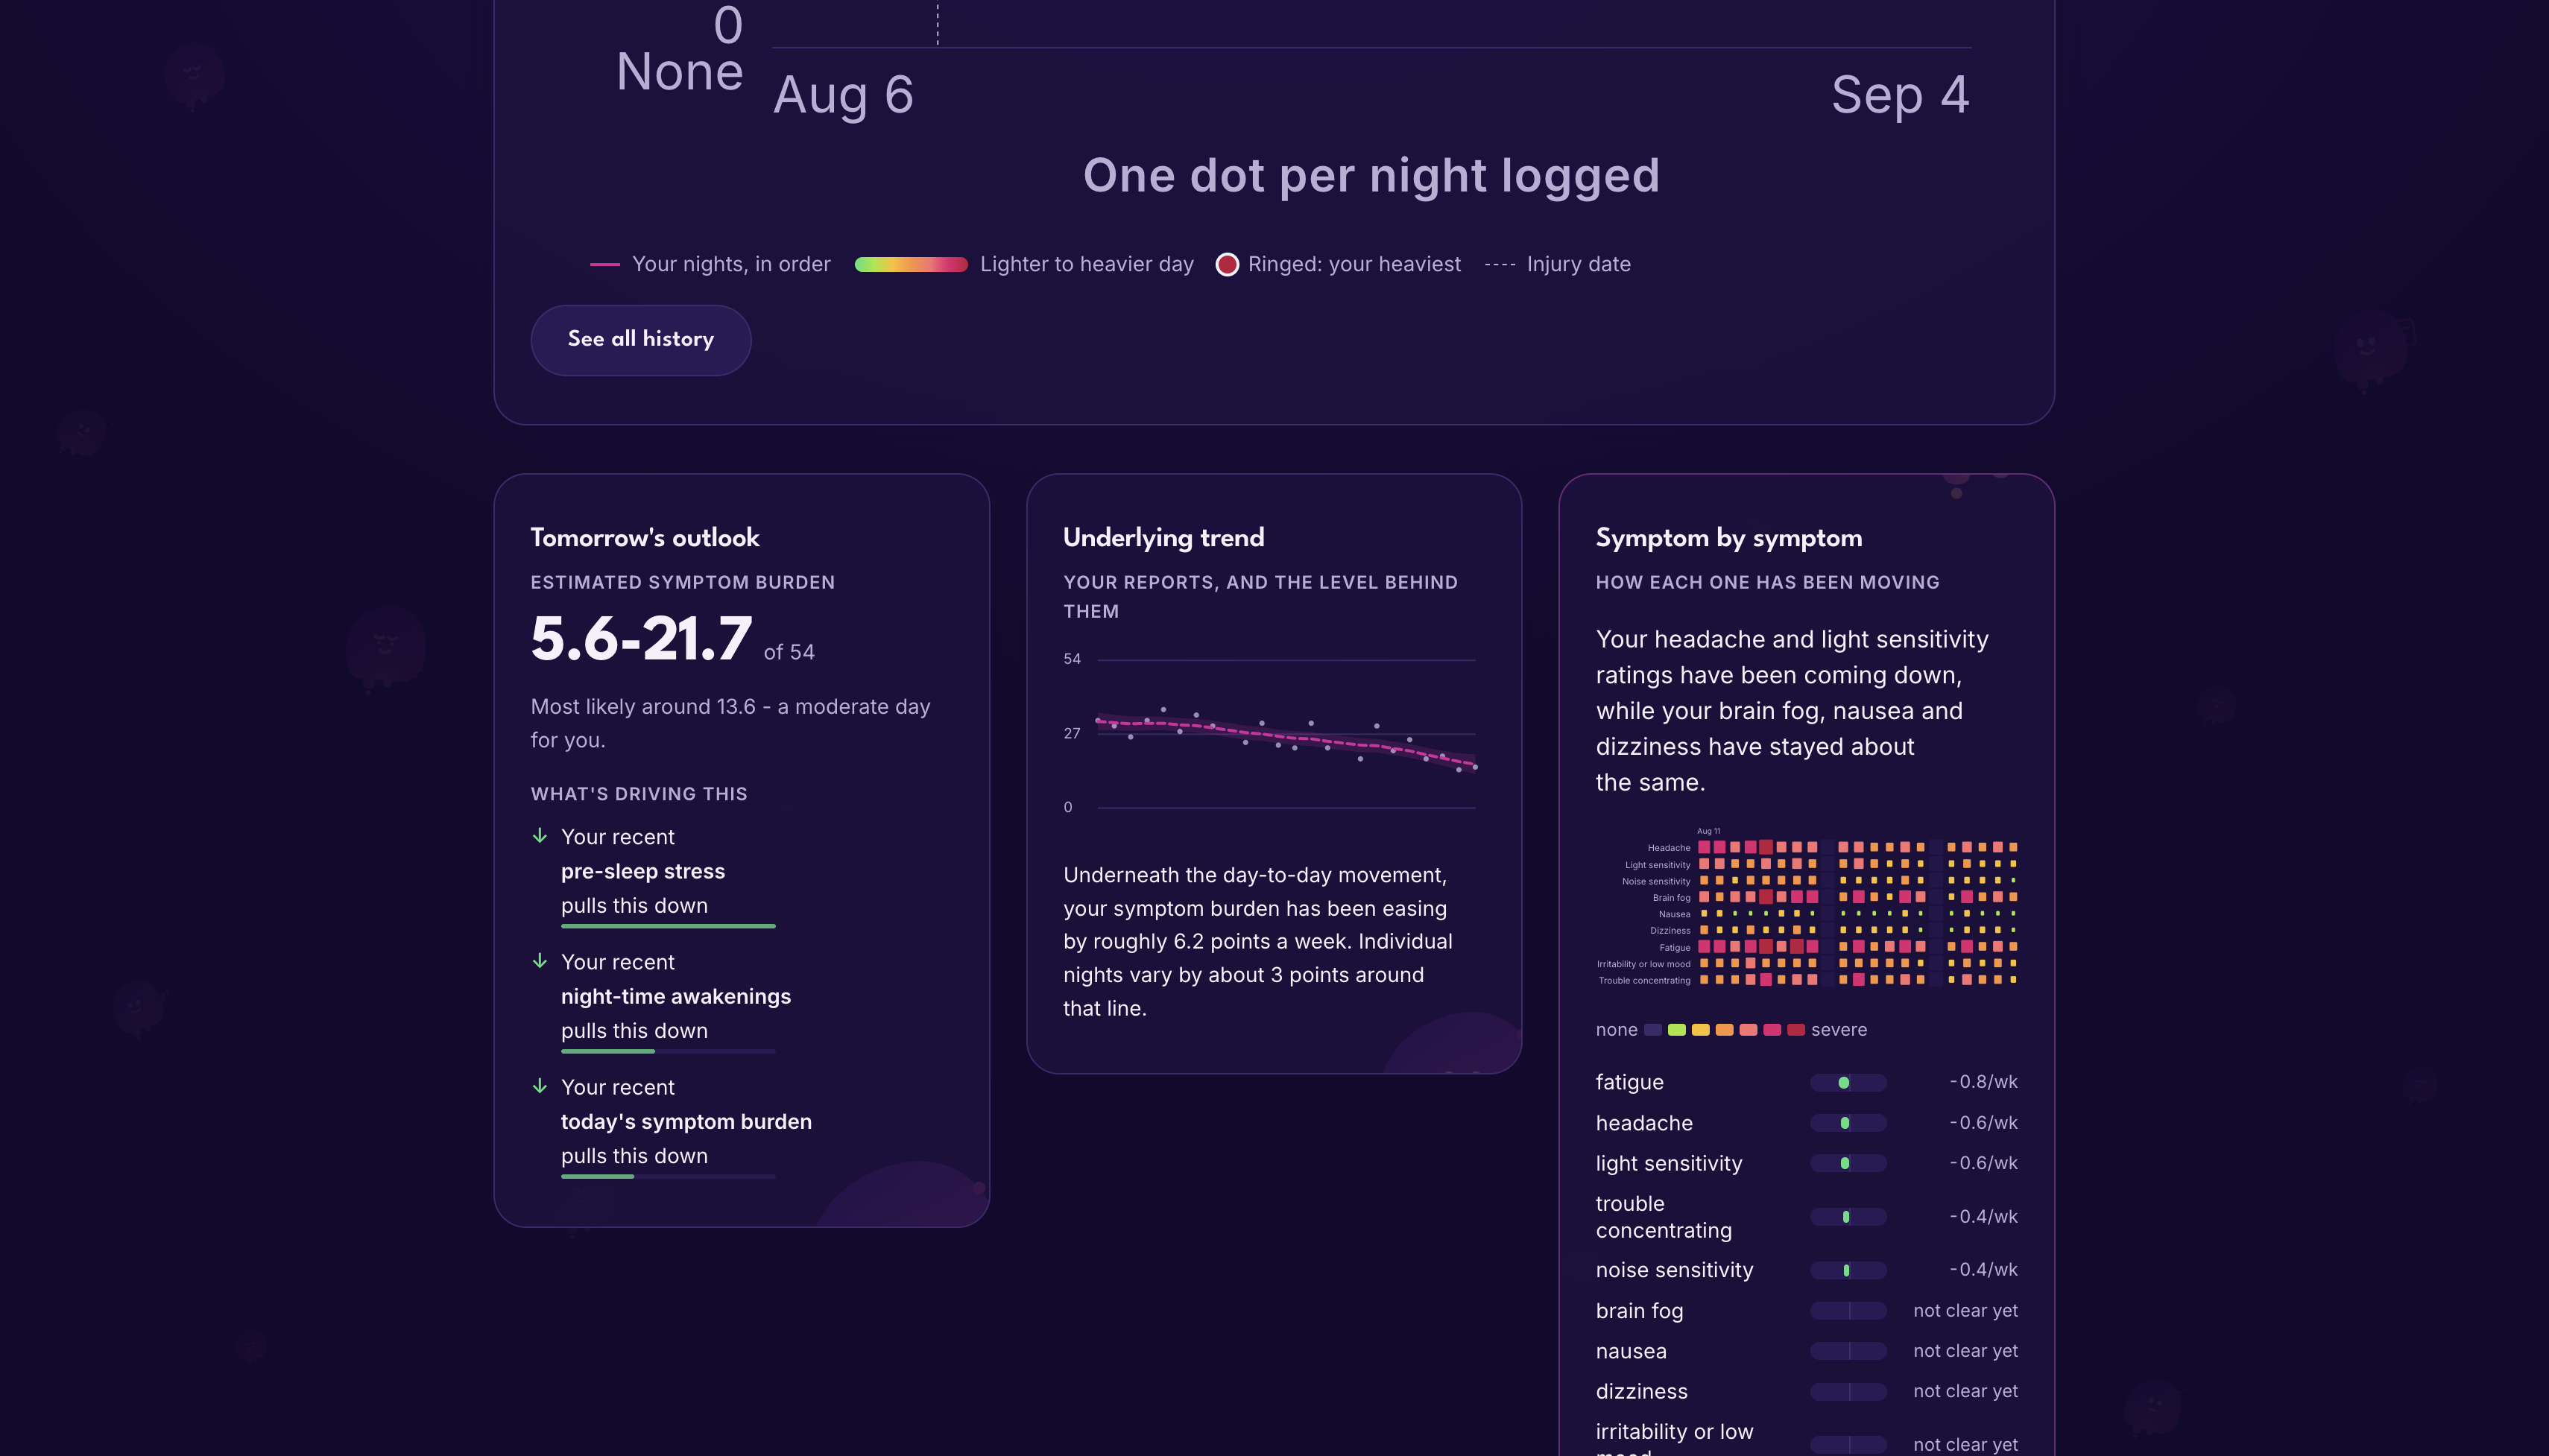
Twice a day it asks a short check-in: the nine PCSS symptoms, mood, a pain map, sleep, and an optional journal entry. Over a few weeks it finds correlations in your own data, phrased as "on days following less sleep," never "caused by"; forecasts tomorrow's symptom burden with an interval and shows what it leaned on; estimates the recovery trend beneath the daily noise; tracks which individual symptoms are resolving; flags unusual days as "worth noting," never as an alarm; and runs red-flag safety rules locally, so a safety prompt never depends on a server being awake.
Mental health is part of the clinical picture, not a separate feature. Irritability and low mood is one of the nine PCSS items, carried through the same Holm-corrected trend model as every other symptom, and pre-sleep stress is the heaviest input to the forecast on our demo data.
What it will not do matters as much. Under 7 complete nights it emits no prediction at all, not a hedged one. No diagnosis, no recovery stage, no recovery date, and it states in the product that it cannot detect an emergency.
How we built it
React 19 and Vite, all data in localStorage, no account and no user id. The
backend is a stateless FastAPI service on Render: the browser posts a
de-identified numeric snapshot, a model is fit on it, an answer comes back, and
the request is discarded. No database exists and payloads are never logged.
Six model modules, hand written in numpy and scipy, fit per request and thrown away: Spearman rank correlation with Holm-Bonferroni for the correlation engine, ridge regression in closed form for the forecast, a walk-forward backtest with split-conformal intervals for validation, a Kalman filter with an RTS smoother for the recovery trend, Theil-Sen slopes for per-symptom trends, and median/MAD robust scoring for anomalies. A separate NLP package handles sentiment and linguistic complexity on journal text.
The forecast solves
$$\hat{\beta} = (X^\top X + \alpha I)^{-1} X^\top y$$
with $\alpha = 1.0$ on standardized features. Ridge over OLS because sleep duration, quality and awakenings are collinear by nature. Ridge over gradient boosting because standardized ridge coefficients are the explanation, read straight off the fitted model rather than reconstructed by a separate method that might disagree with the number it is explaining.
Render runs both halves from one blueprint: the stateless API with a health check, and a static CDN frontend that never sleeps. We also committed a notebook that imports the real model modules and runs them on the demo data, so every number in the product can be checked rather than taken on trust.
Challenges we ran into
Our prediction interval was lying. An 80 percent interval promises the truth lands inside it about 80 percent of the time. Ours built its interval from in-sample residuals, and backtested, real coverage was 51 percent - barely better than a coin toss while labelled 80, because in-sample residuals understate error on unseen data. We rebuilt it as a split-conformal interval from a walk-forward backtest, refitting on nights 0 through $t-1$ to score night $t$. Coverage went to 92 percent.
Multiple comparisons. We measured it on pure noise: testing seven features at $p < 0.05$ produced a confident finding in 30 percent of datasets containing no signal at all. Holm-Bonferroni brings that to 6 percent. That is the difference between a tool that finds patterns and one that manufactures them.
Fitting noise parameters failed. The textbook move for the Kalman filter is to fit process and observation noise by EM. At our sample sizes it collapsed, over-smoothing and producing estimates worse than the raw self-reports in two of three trials. Fixing the ratio from a clinical prior and estimating only the scale beat the raw self-reports in 24 of 24.
Missing data. An unanswered field cannot become a 0, because a fabricated 0 enters the clinical record as a real observation. An unmarked pain region is not a 0 either. That meant dropping incomplete rows rather than imputing, and breaking chart lines across unlogged nights instead of interpolating.
Accomplishments that we're proud of
We built the validation layer that was allowed to embarrass us, and it did. The 51 percent finding is the accomplishment, not the bug. A validation layer that can only return good news is decoration. Ours grades the forecast against "tomorrow will be like today" and reports the result either way: 4.9 mean absolute error against the baseline's 5.9, a skill score of 0.17.
Privacy is structural. One documented chokepoint builds every outbound request, and its schema has no field that could carry free text. Journal writing leaves the device only on explicit opt-in. Pain region names never cross the wire, because a map of where one person aches night after night is closer to a fingerprint than a measurement. Tests fail the build if any of that stops being true, including one that fails if any of six causal phrasings reaches a user.
The models refuse. On the demo data, four of nine symptom trends come back "unclear" after correction, including one whose point estimate is larger than a symptom that was reported as easing, because the interval decides rather than the point estimate.
Accessibility as a clinical requirement. Photophobia and cognitive fatigue
mean dark-first purple at minimum brightness, one action per screen, nine symptoms
three at a time, 44 pixel tap targets, severity encoded by size as well as colour,
and all motion honouring prefers-reduced-motion. Lumi's concerned face has a
level mouth rather than a frown, because a frown reads as pity. Milestones
celebrate what the data now enables rather than congratulating improvement,
because recovery is not monotonic.
844 passing tests, including ones that exist purely to enforce the ethics.
What we learned
A model that cannot deliver bad news is decoration. Nearly everything we are proud of came from building something that could tell us we were wrong: the backtest that caught the interval, the noise simulation that caught the multiple comparison problem, the EM comparison that told us not to fit the parameters. Each made the product less impressive-sounding and more true.
The hard part of applied statistics is restraint, not technique. Writing the correlation was an afternoon. Deciding how many features it was allowed to test took far longer and mattered more.
Explainability is a constraint you choose up front. A gradient-boosted model would likely have predicted slightly better. We could not have said why it said what it said, so it did not ship.
Some things are safer left unbuilt. We track mood carefully, but we explicitly refused to treat a low mood slider as a suicidality signal. A 0-100 slider is not a risk assessment: telling someone the app thinks they are in crisis because they dragged a slider low is a serious harm, and a false negative is worse. Mood reaches the red-flag rules only through aggregate symptom burden, and that is as far as it should go.
What's next for MyLumi
- Export and delete, restored to the UI. Both existed and were cut in a design pass. The functions remain in the codebase and tested, but on a localStorage-only app their absence means no way to back up entries before clearing a browser. Most important thing to fix.
- Clinician-shareable summaries the patient generates and controls, so a follow-up starts from structured data instead of "I think it has been better?"
- Validation against real recovery data. Everything is currently demonstrated on a seeded dataset with a planted effect the models must discover on their own.
- Offline-first service worker and self-hosted fonts.
- Wider accessibility work, including screen reader passes on the 3D pain map.


Log in or sign up for Devpost to join the conversation.