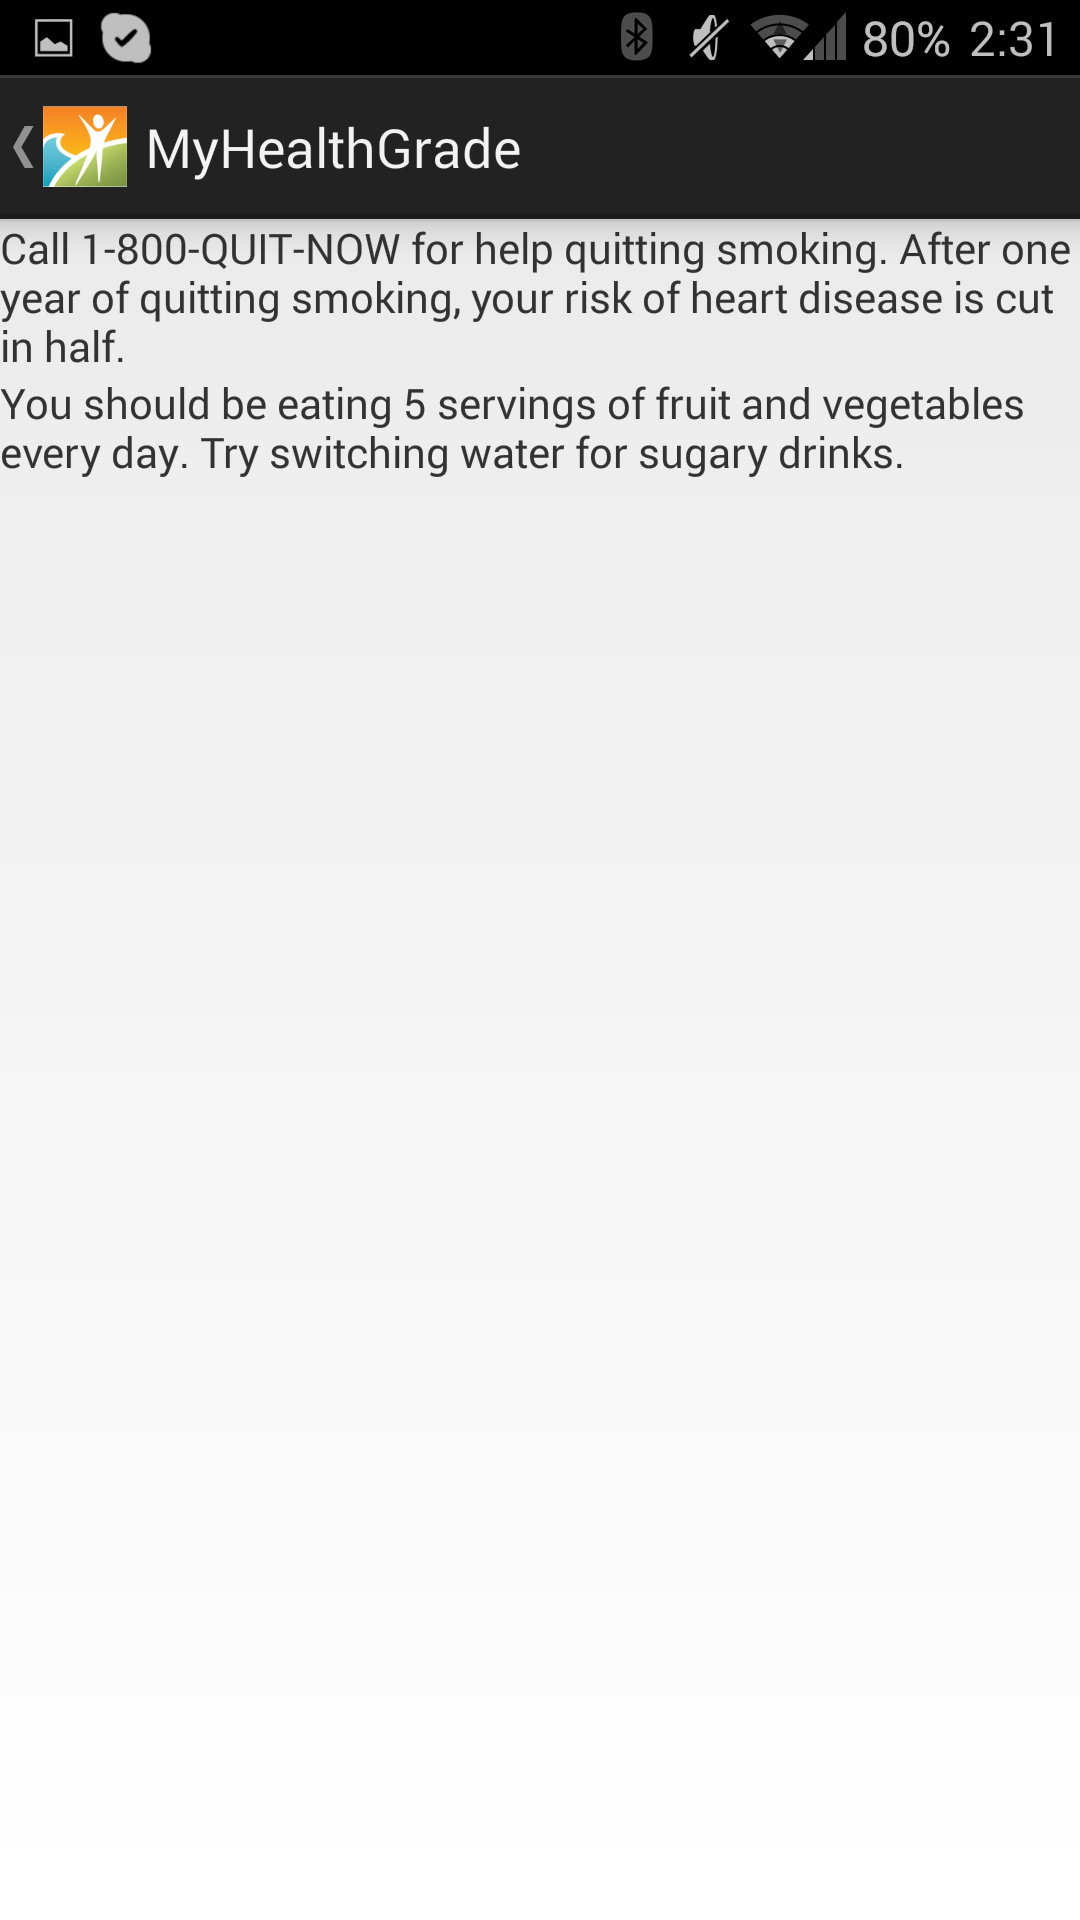
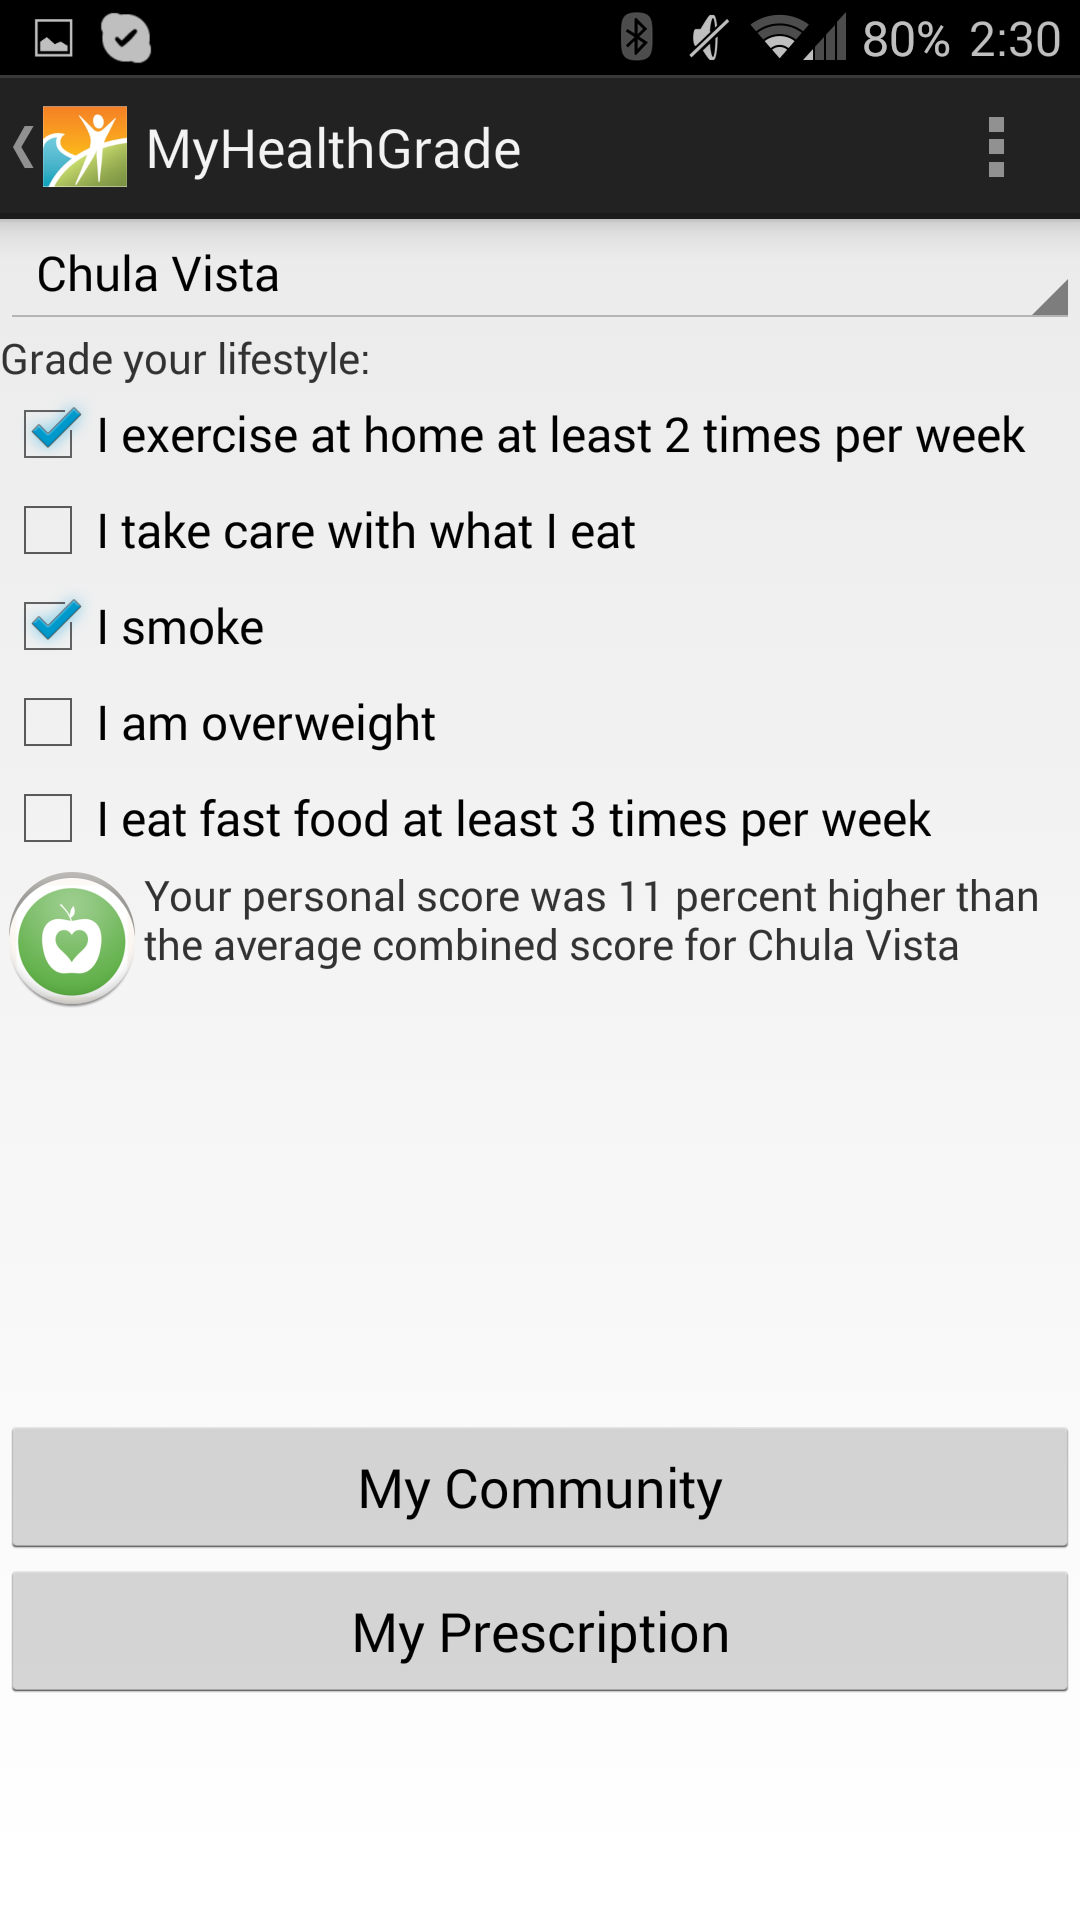
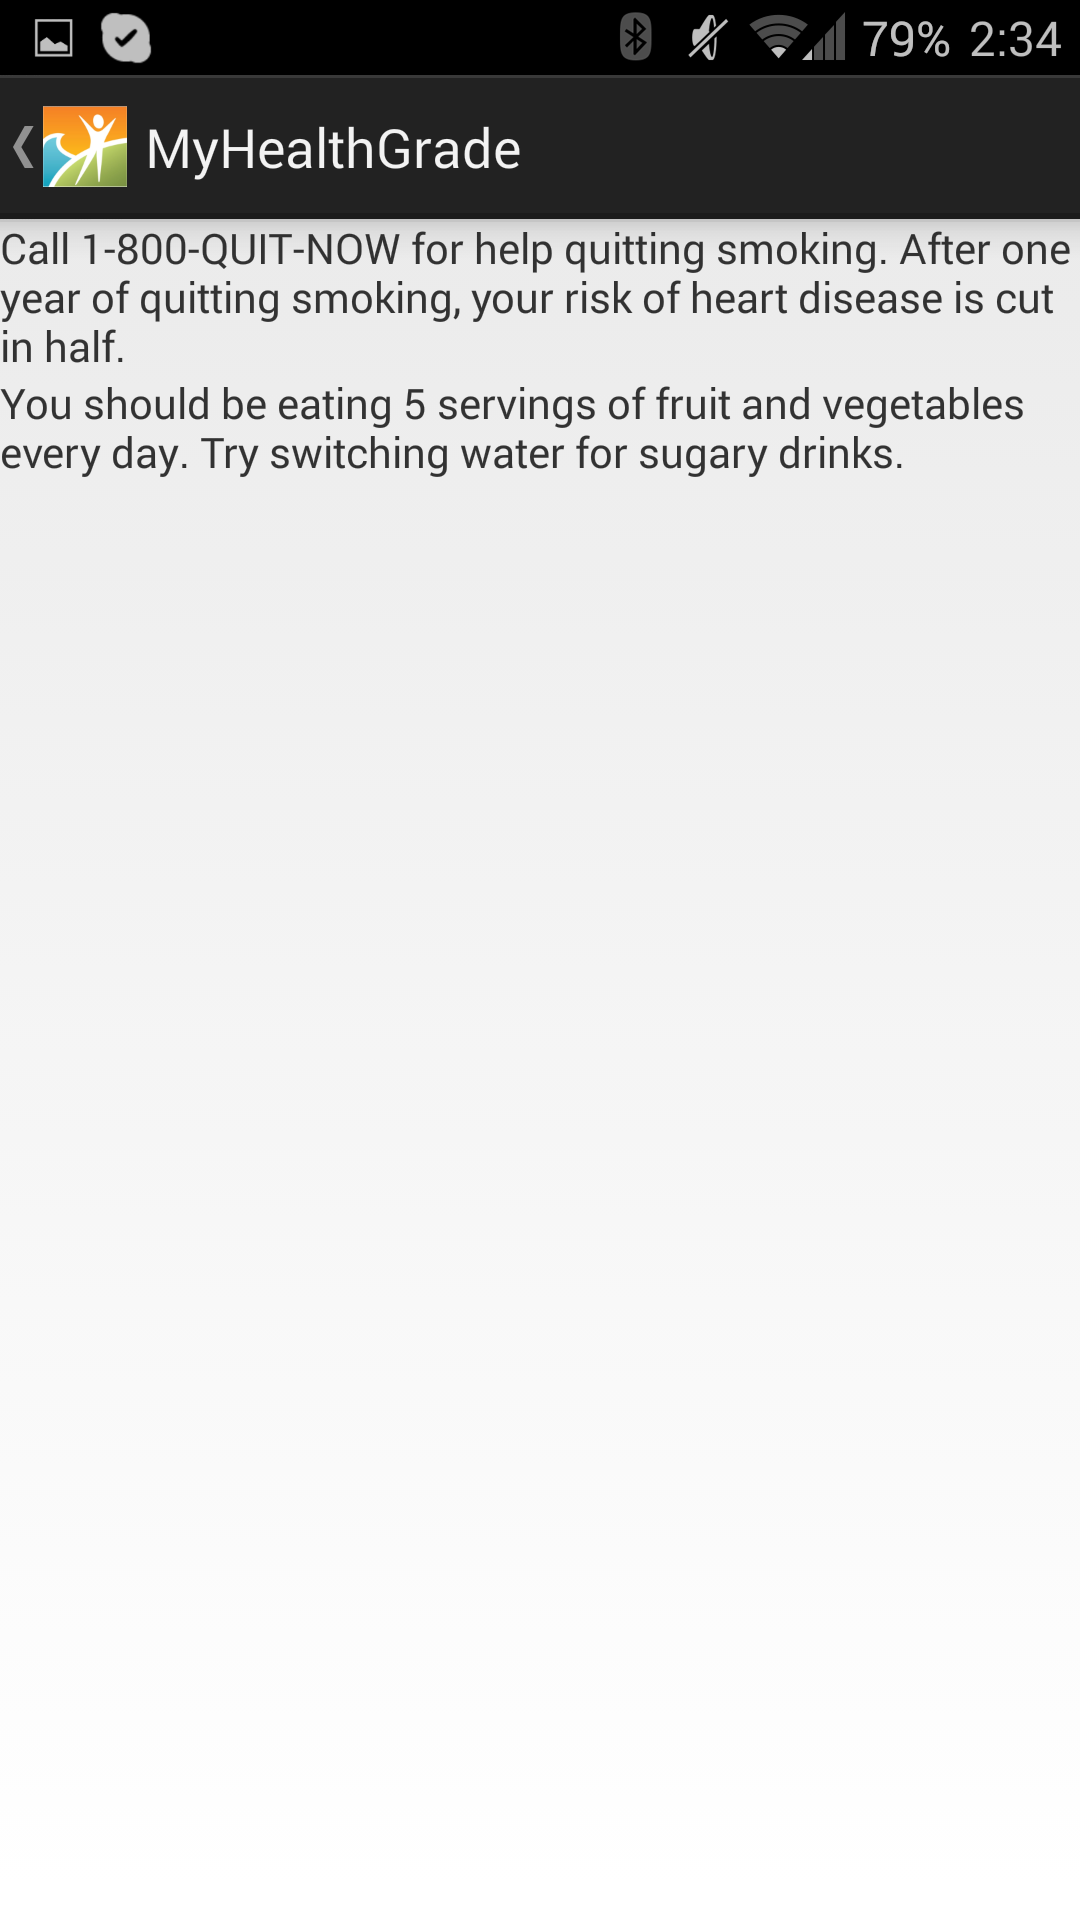
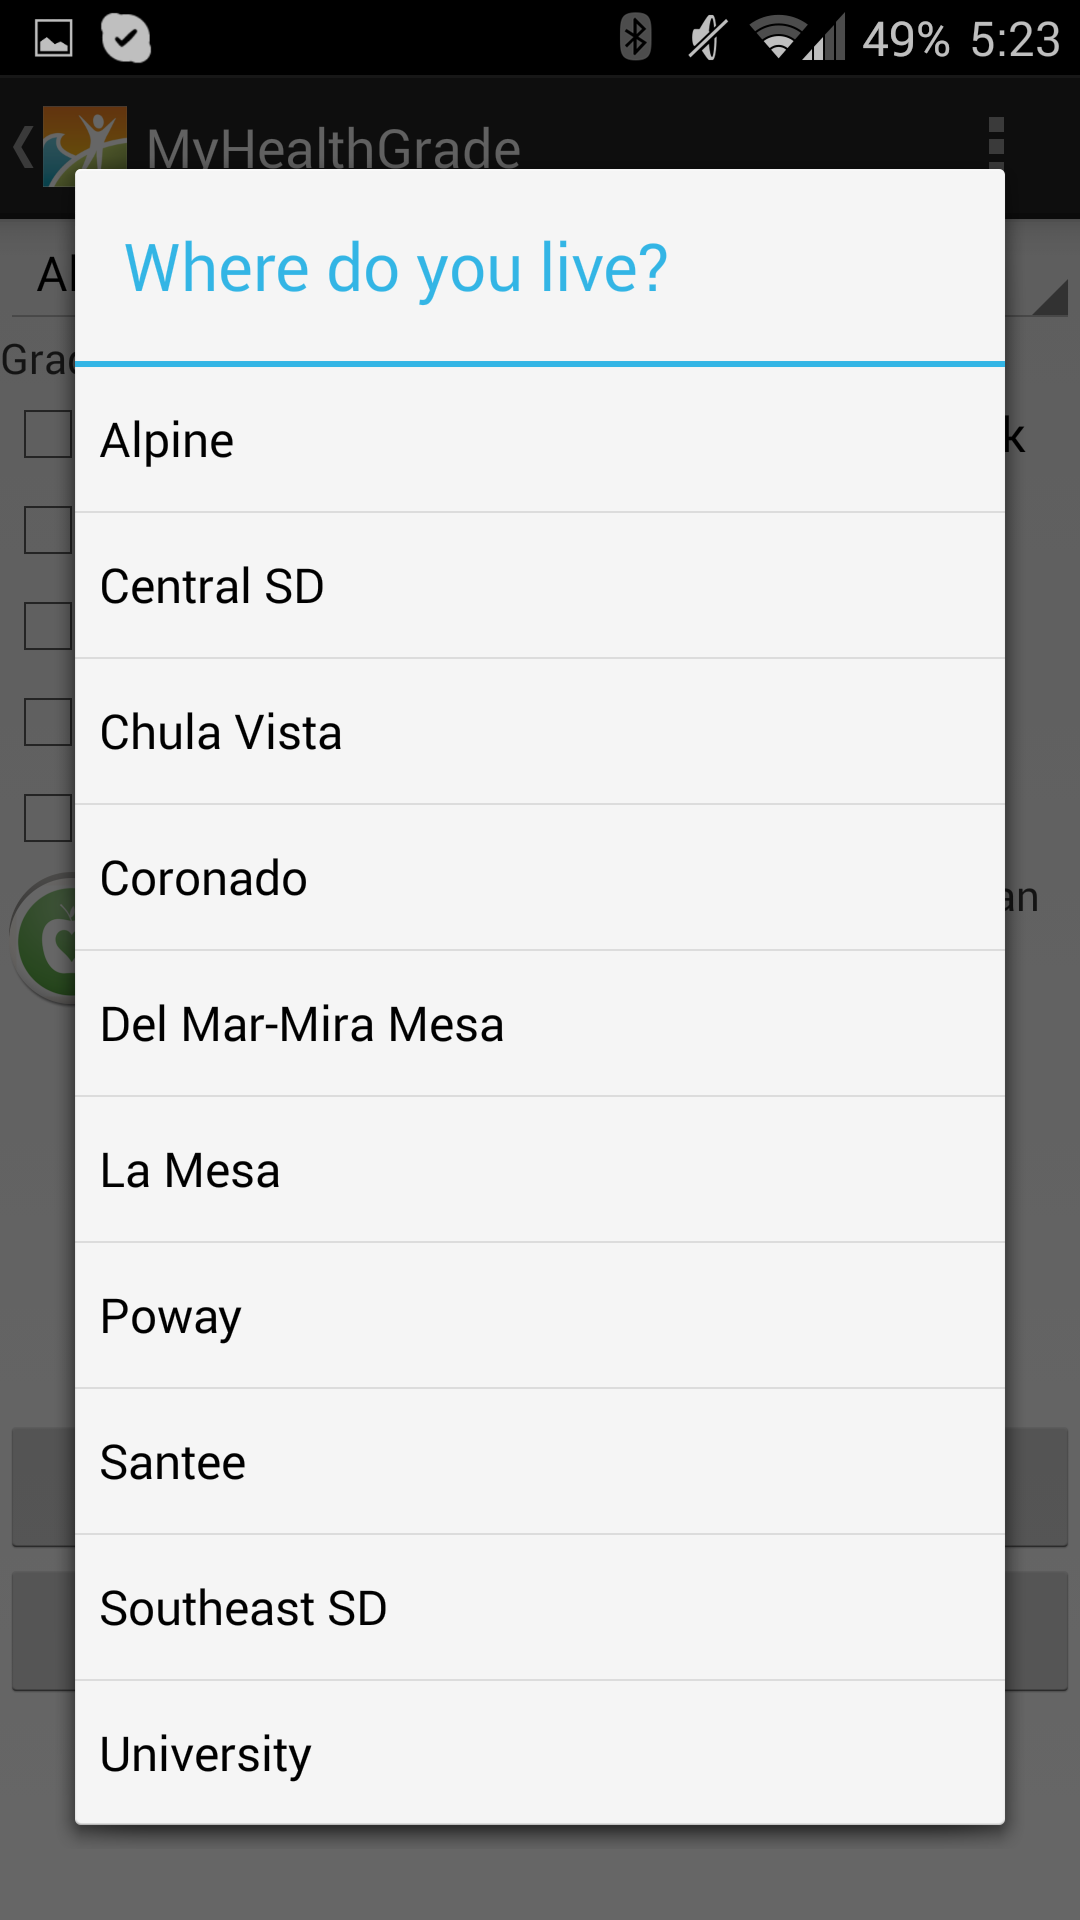
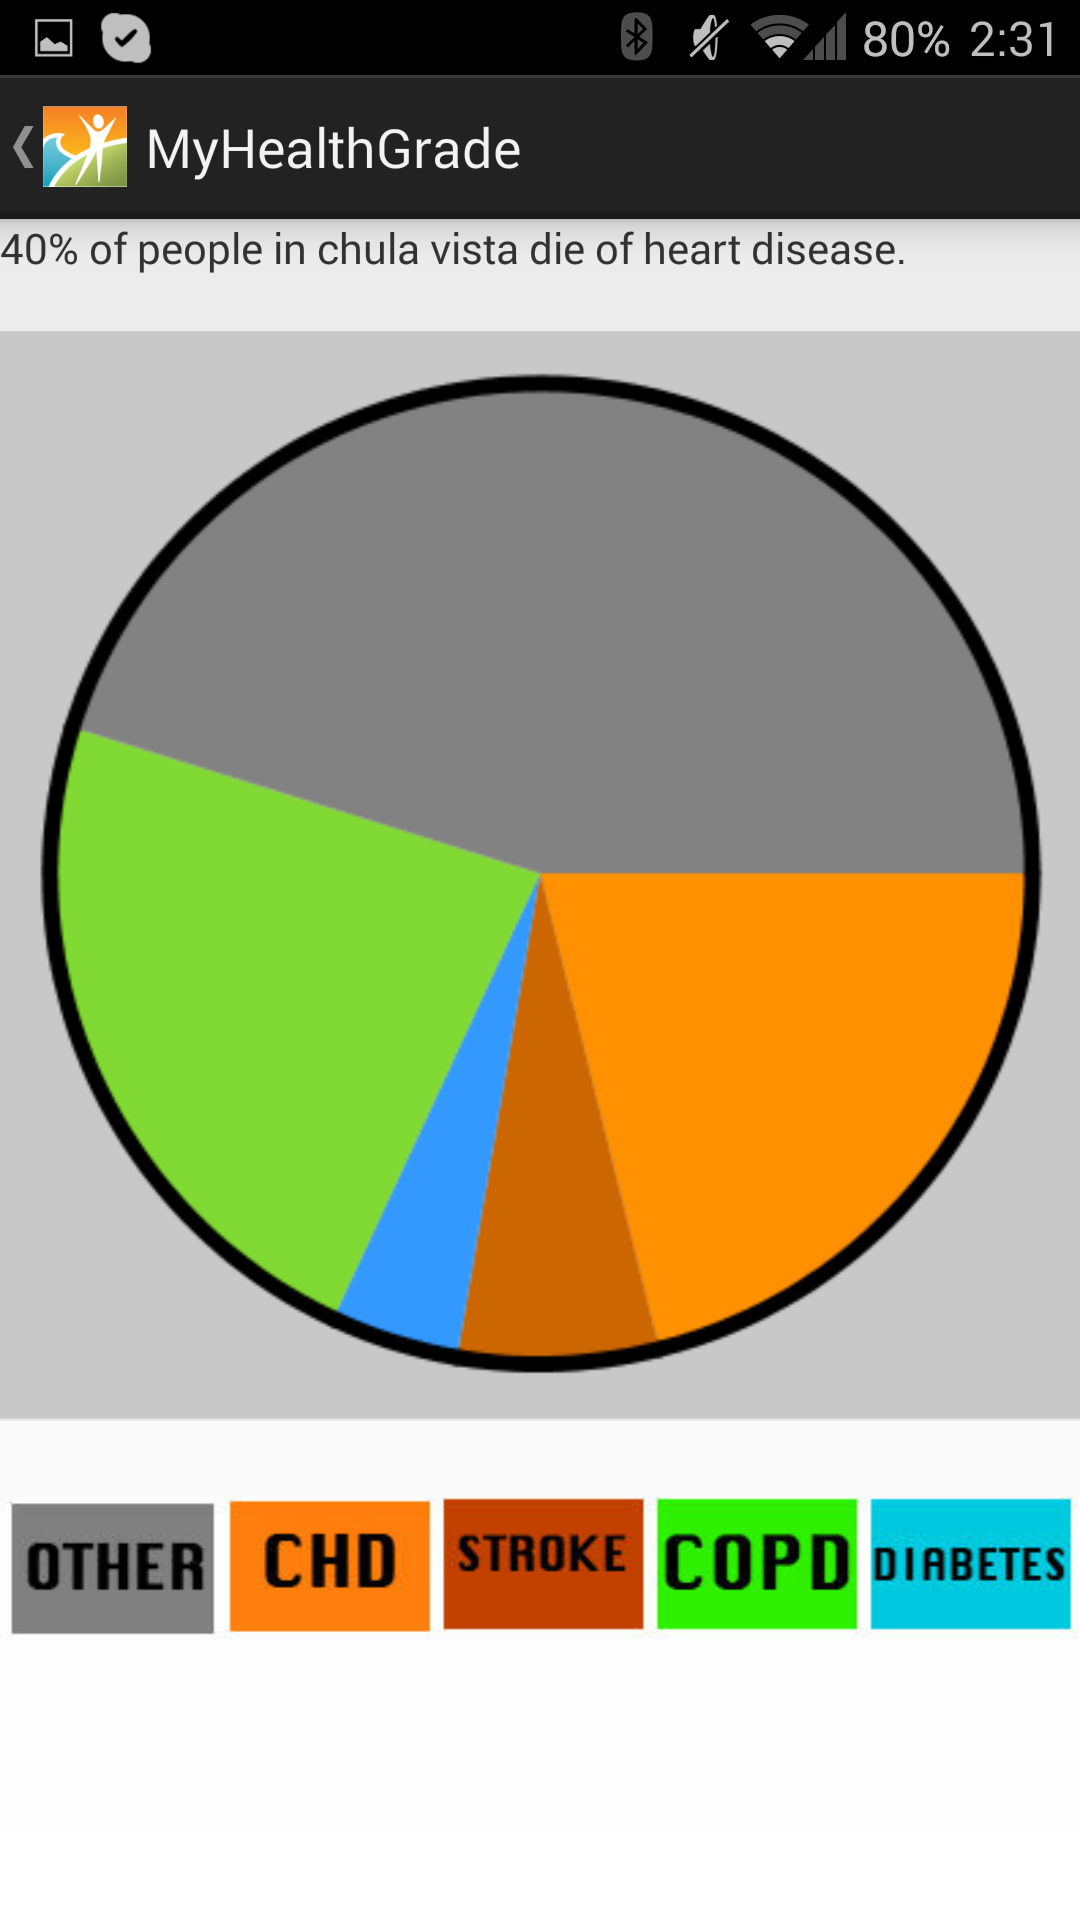
This application was originally entered into a codeathon for the county of San Diego. The purpose of this application is to take complex data regarding health concerns in different sub-regional area and display it in a simple and meaningful way, that could easily be understood by the general public. When using our application, the user selects their neighborhood and answers a few yes or no questions about their health, and then receives information about how their health compares to the average health of their community, and what they can do to improve their personal health. This application is also useful for politicians, because it lets them understand where they should talk about certain health problems to better the health of their region. For example, if a certain area had a lot of people that smoke and are dying because of it, it would be more beneficial to give a speech on the dangers of smoking in that area compared to giving the same speech in an area with a lower percentage of smokers. This application was designed to be used by the general public, and we have made it free and easy to get access to our application. Programmed in Java and XML using Processing and Eclipse. Created code to generate pie charts. Reads data from Excel spreadsheets to provide useful information and generate charts. The application is capable of displaying different data by changing the spreadsheets that it reads from. Runs on all Android devices and can be downloaded from the Google Play Store. The Pixlr editor was used to generate most of the images used in our application. While we had plenty of experience with Java and Eclipse in the past, development for Android was new and posed many unexpected challenges.
MyHealthGrade
Provides useful information about the user's health relative to their neighborhood and how they can improve.
Updates

Leave feedback in the comments!
Log in or sign up for Devpost to join the conversation.