

Inspiration
We all know that taking care of yourself is important, but what about taking care of the planet? While it is true that feeling good should come from within, it is doubly true that people gain fulfillment from good deeds that they know will help their fellow humans. That is why we developed MyCare, an application for self-care and personal growth that also encourages users to be better humans every day through mindfulness, not only of their physical and mental health but also their impact on the climate and community. We were inspired to create this application through our combined skills and interests: personal growth, data science, sustainability, web development, and UX/UI. With this application, users can track their personal stats such as hydration, nourishment, and wellness, as well as feel in community with other eco-conscious individuals, feel good about their impact on reducing CO2 emissions, and know that we are all in this together.
What it does
MyCare allows users to keep a daily reflection and activity log. For example, tracking well-being activities (such as exercise, gratitude), sustainable choices (biking, meals, public transport), and emotional state (logging their daily moods), and making a care plan for themselves by tracking everyday tasks. MyCare users can make entries in a dynamic journal, where they can write down moments in their lives with gratitude prompts to encourage consistency; the journal is dynamic because of its use of natural language processing to analyze sentiments from the entries and display an overview of their feelings over the week. In addition to tracking the individual, MyCare promotes periodical eco-impact tracking, providing a summary of users’ sustainable choices to make them feel good about their impact on making the world a more livable place. To marry those concepts are the “mindful reminders”, which generate motivational prompts based on recent user activity on the application and keep users engaged with their self-care and eco-friendly habits. Wrapping it all up is the social good meter, which shows how the user’s individual efforts contribute to a larger community goal like mental wellness and carbon reduction, which discourages them from feeling alone on this big blue planet.
How we built it
We used Google Colab/Jupyter Notebooks/Python and its libraries for data processing, Figma for UX/UI design, and HTML/CS/JS for front-end development. Open-source code was used from Our World in Data to compare individual CO2 emissions and reductions to those all over the nation, allowing the user to see in real-time their impact on sustainability. Google Sheets API was used to store data as it aggregates with real user input to then use for front-end development.
- ChatGPT was used to generate simulated journal entries, generate motivational phrases and responses from the application, and check bugs/syntax errors in code.
Data Processing and Analysis
- Started with simulating user data for weekly activity, and hard coding the user data that would then be replaced with genuine user inputs. Numpy was used to randomize figures for realism.
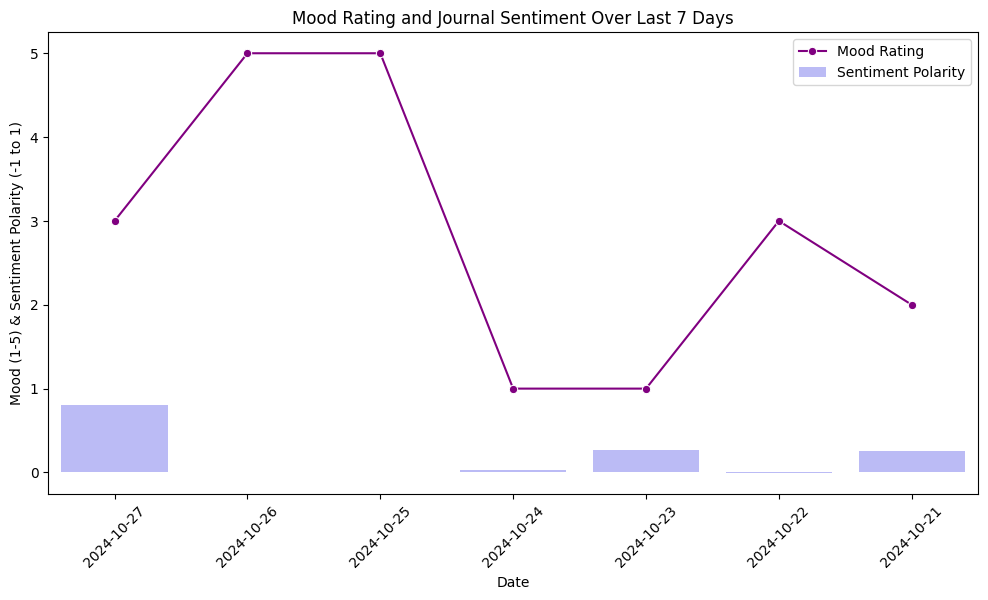
- The textblob library was used to analyze the sentiments of each journal entry, classifying them as positive, neutral, or negative.
- The open source data was used to determine CO2 emissions in the US and determine the impact of each sustainable action. CO2 reductions between the user and emissions data were used to calculate daily, weekly, and monthly CO2 reductions from the user.
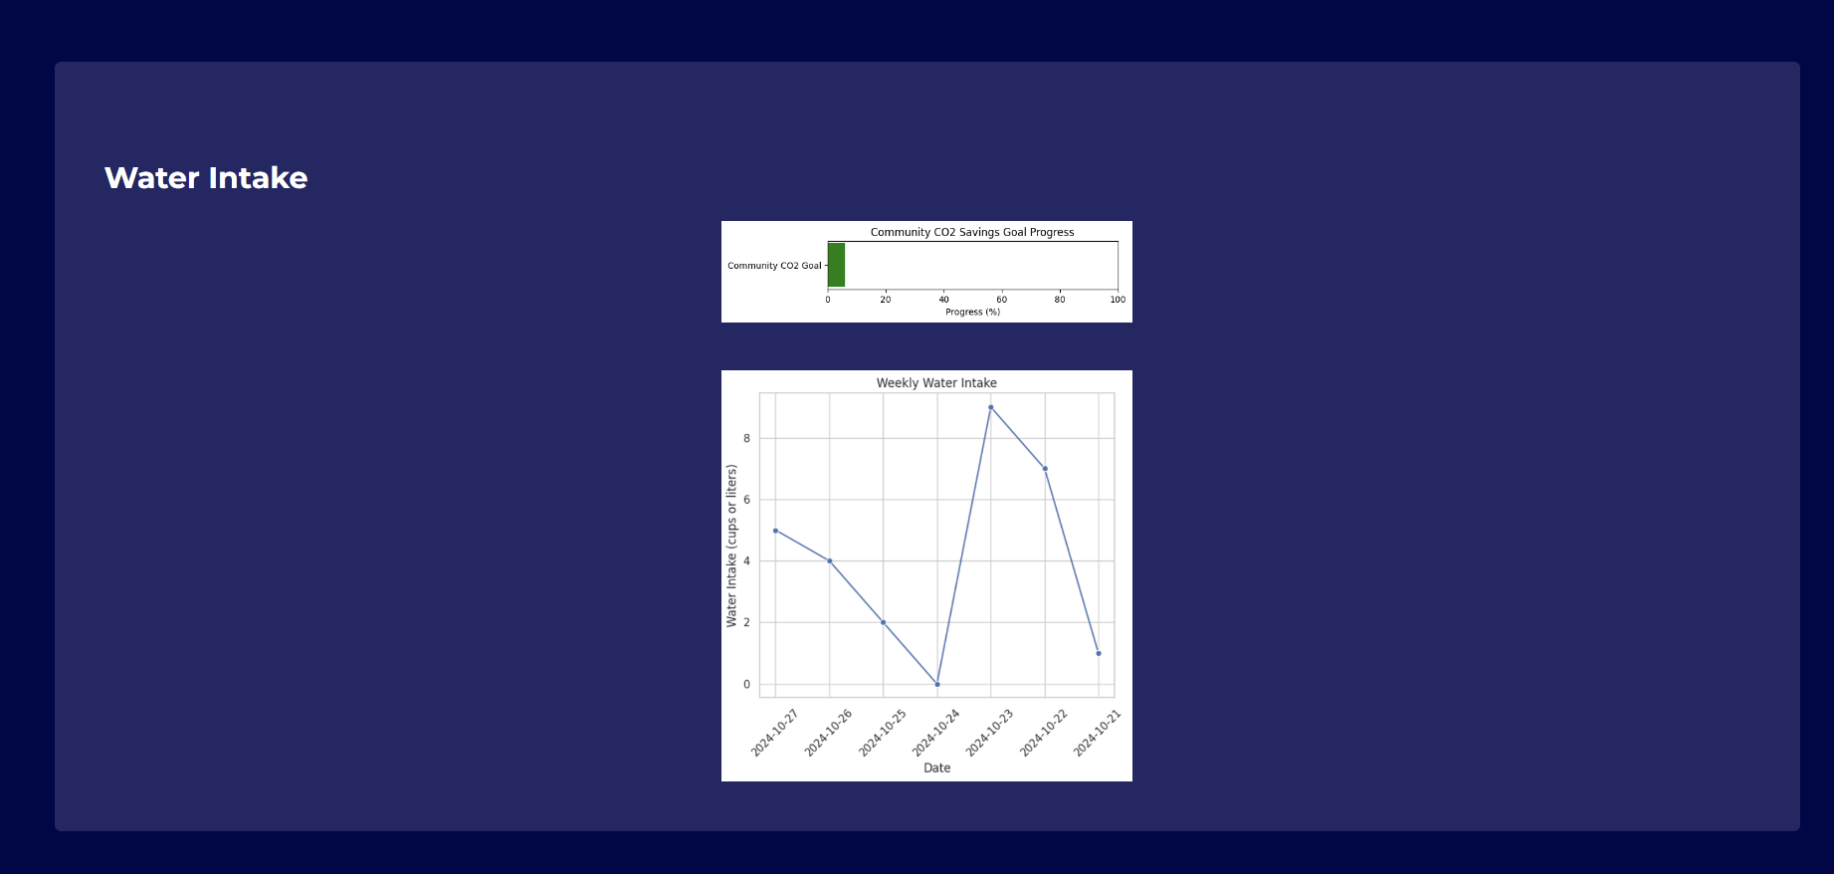
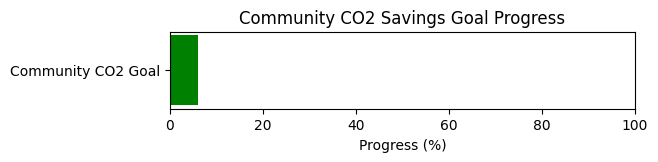
- The community CO2 reduction goal calculates the user’s progress against a community goal as more users log their activity. Similarly, the same is done with the community goal of mental wellness. A progress bar is plotted for both to determine weekly progress.
- A daily, weekly, and monthly summary of users’ actions is calculated with metrics such as total exercise, hydration, nourishment, and sustainable habits The user’s mood is also logged on a scale of 1-5 to be tracked over time, and depending on the rating, MyCare generates a motivational line to encourage the user to better themselves no matter what they feel like that day.
- Mindful reminders are generated based on a user’s sustainable activities, reminding them of their carbon footprint and encouraging them to stay mindful and present in their actions.
- Data visualization from Matplotlib includes: weekly exercise, weekly CO2 saved, mood rating over the week, journal sentiments over the week, and hydration and sleep over the week.
- At this point, real user input is taken and the above analysis is done with real user data instead of simulated hard code, the user’s data over one week is loaded into a dataframe and stored in Google Sheets using the Google Sheets API. The dataset is now updated with the weekly averages for tracking, and ready to import to JSON for front-end employment.
Figma
- We used Figma to illustrate how we want our website to look and feel for the user
HTML/CSS/JS
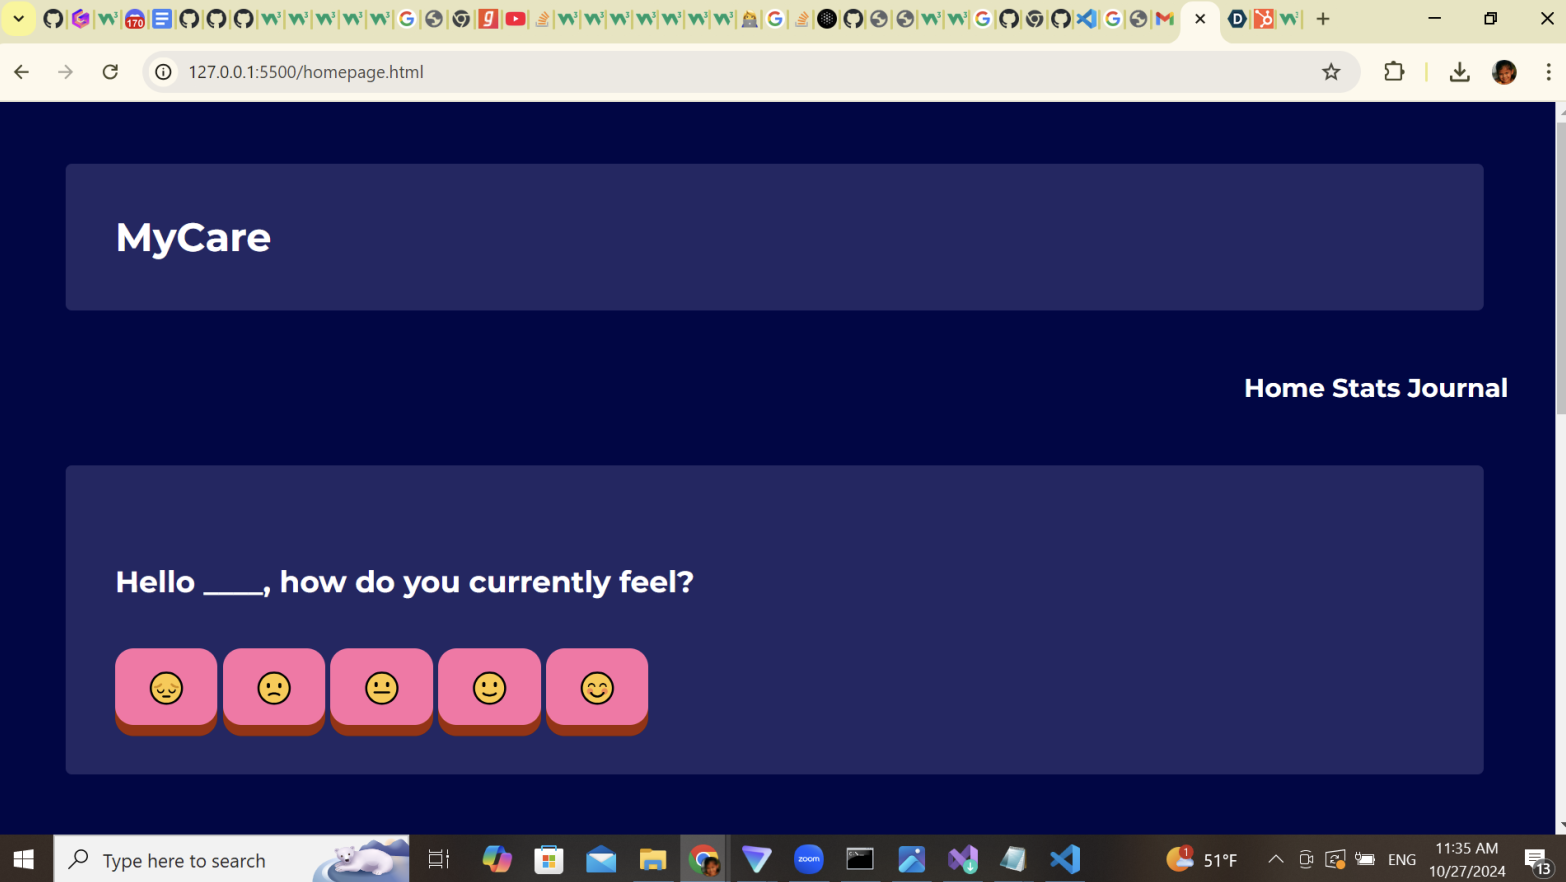
- Landing Page
- The landing page has all your daily checkmarks, like what was your mood that day, did you accomplish the basic needs for your body, and how did you feel that day.
- Journal Page -Has a button that links to your thought page which could either be gratitude or thoughts that you need to process and feel through.
- Thoughts Page
- The thoughts page is a safe and confidential space to write down all your scrambled thoughts about life.
Challenges we ran into
- marrying our ideas of self-care sustainability and data-driven insights with our tech stack and skills.
- collaborating on front-end.
- integrating open source data in co2 emissions with our application and how that can work with the user input data
- storing data for real-time usage of user input.
Accomplishments that we're proud of
- We successfully created the front and back end of our website.
- We were able to make a Google spreadsheet that accounts for users’ data in real-time.
- We were able to store data in a table.
- Successful visualizations of weekly metrics for users to see in their summaries.
What we learned
- Trinity: I learned a new Python library (TextBlob) and finally got a touch on AI techniques like natural language processing and sentiment analysis. I also got more familiar with the lambda function in pandas, which used to be really tricky; as well as the DateTime library which I seldom get the opportunity to use meaningfully. It was a great challenge processing data to use with a front-end interface, and exciting getting to perform all of the interesting analyses and visualizations with real user input data.
- Navya: I definitely learned a lot about the data piece of the whole project, as well as how to connect the front and back end of the whole website. I think in the future, I can definitely tap into more languages that I know to help out more.
- Amy: I learned a little more about CSS during the times that I’ve done the challenge as well as attending UI/UX seminars. I learned more about implementing complementary colors as well as providing easy usage for users. I haven’t exactly mastered the CSS flexbox due to time constraints, but I will implement it next time.
What's next for MyCare
- Definitely finding the right color scheme that portrays biodiversity as well as using CSS flexbox/grid for users to easily read sections.
- Right logo and graphic design for a potential mascot as that will attract more audiences into sustainable lifestyles
- Use some machine learning predictions to see how one could be more sustainable or healthier the following week if their record for that week was poor/below average.
- In the future, we will definitely try to find the right structure for our website and add a profile page for users.
- MyCare would be interesting to see in a mobile application, so learning mobile app development and tools like SwiftUI could level this hack up a notch.
- More unique users to fully realize the community wellness goals and social good meter.
- Fully pushing the processed data to use in JavaScript to see the project at its full potential.

Log in or sign up for Devpost to join the conversation.