-
-
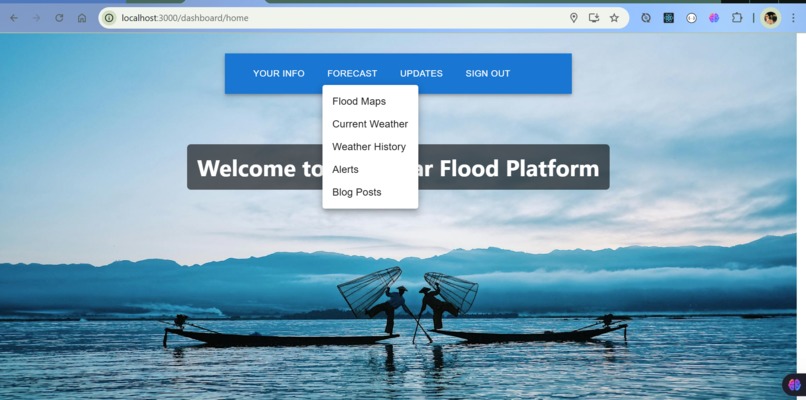
Home page (With the navbar displaying Some of the sections My app provides)
-
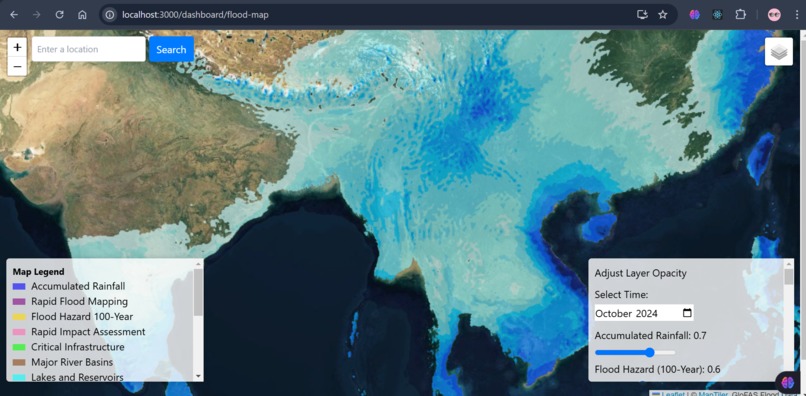
Flood map with different layers (Displayed Layer is Accumulated rainful layer ) :areas with higher accumulated rain may have upcoming flood.
-
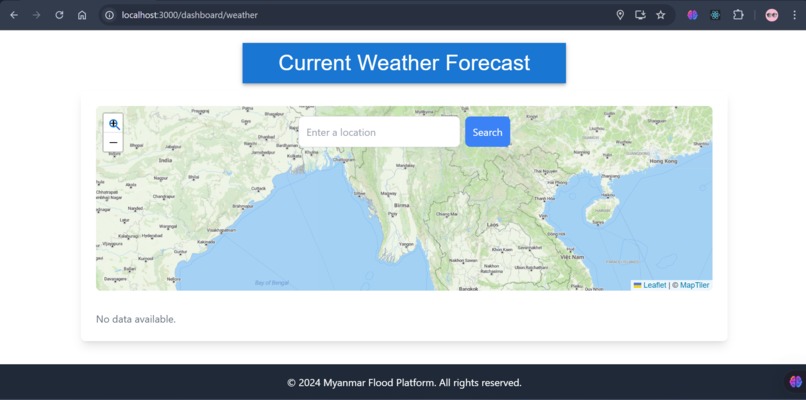
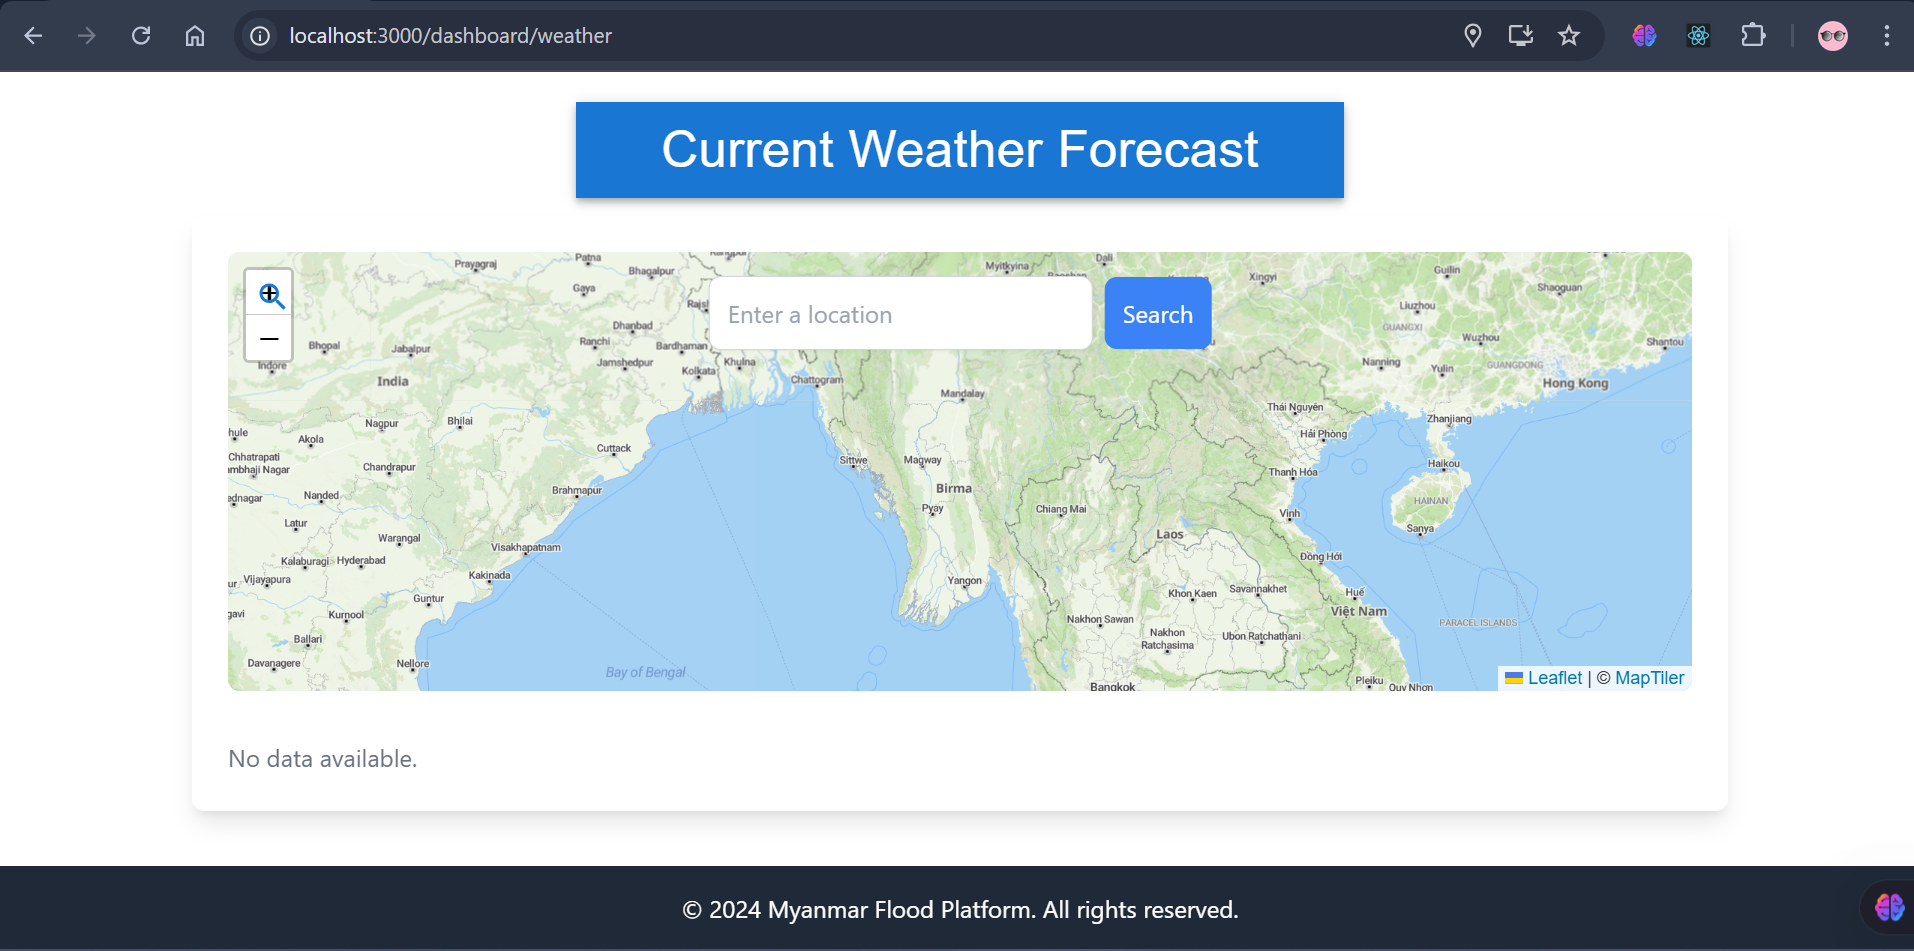
Current Weather (real time) where user can search for any location in the world
-
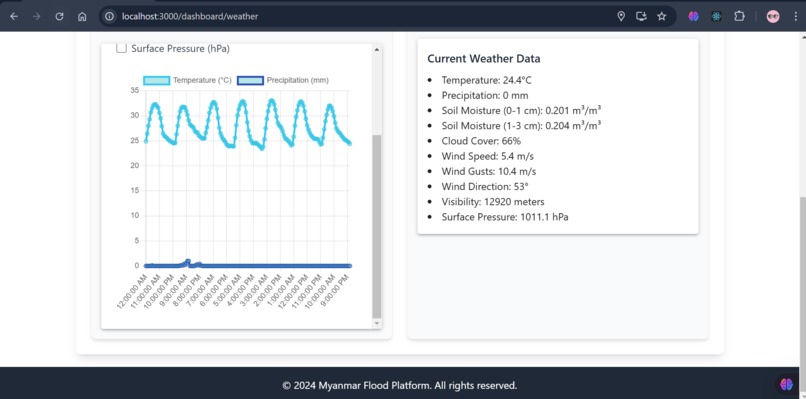
Current Weather (real time) is supported by easily managed graphs (You can combine relations as much as you can to get best deduction).
-
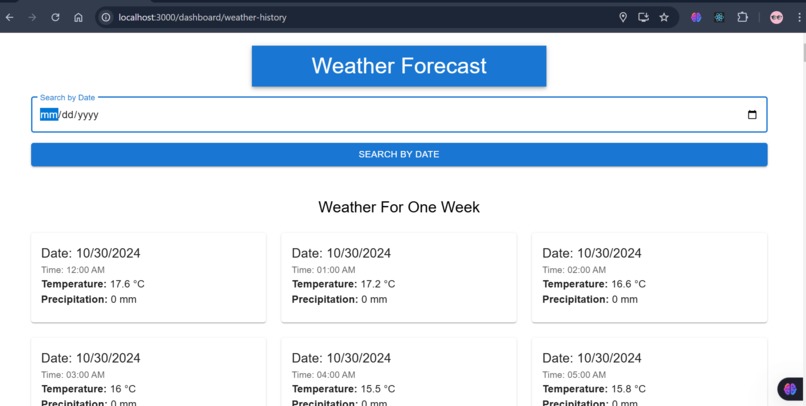
Weather Forecast section which provide fore cast for one week and we can search by date (so we can analyze current weather with other data)
-
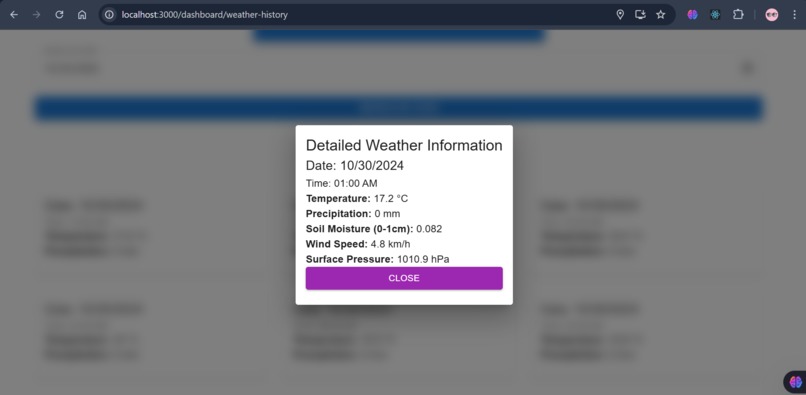
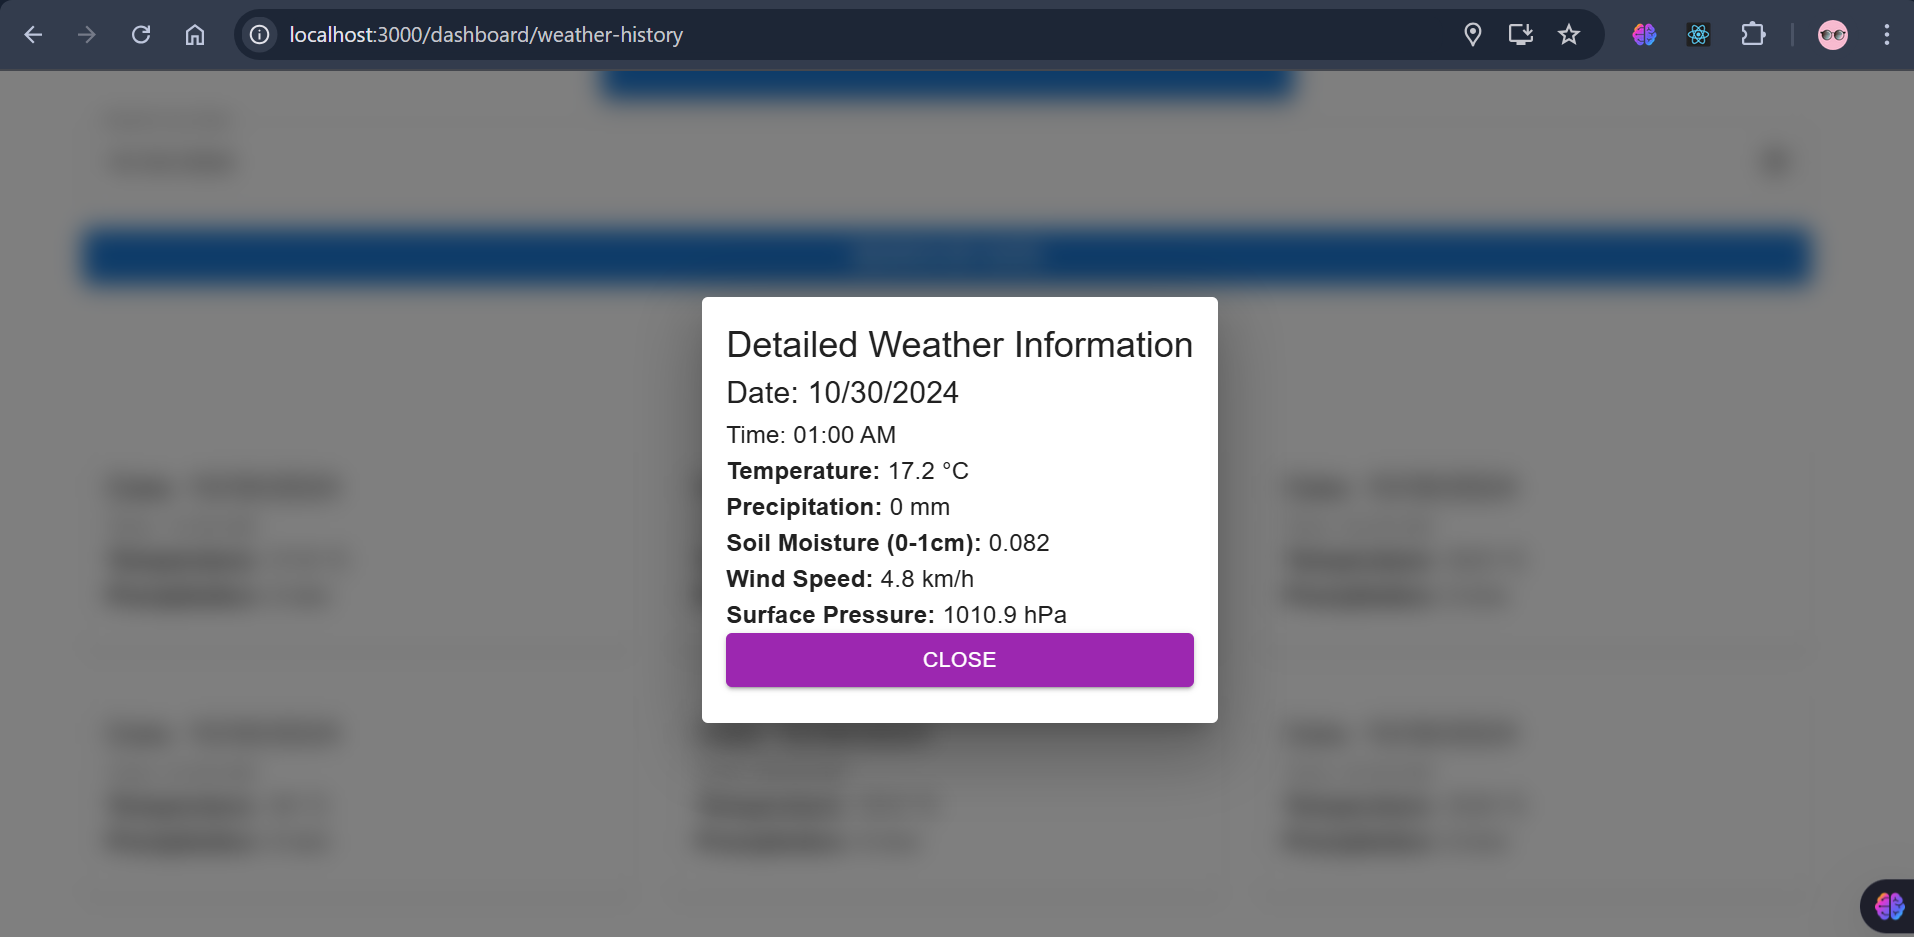
User can click any of obtained weather data to see all details in this great way.
-

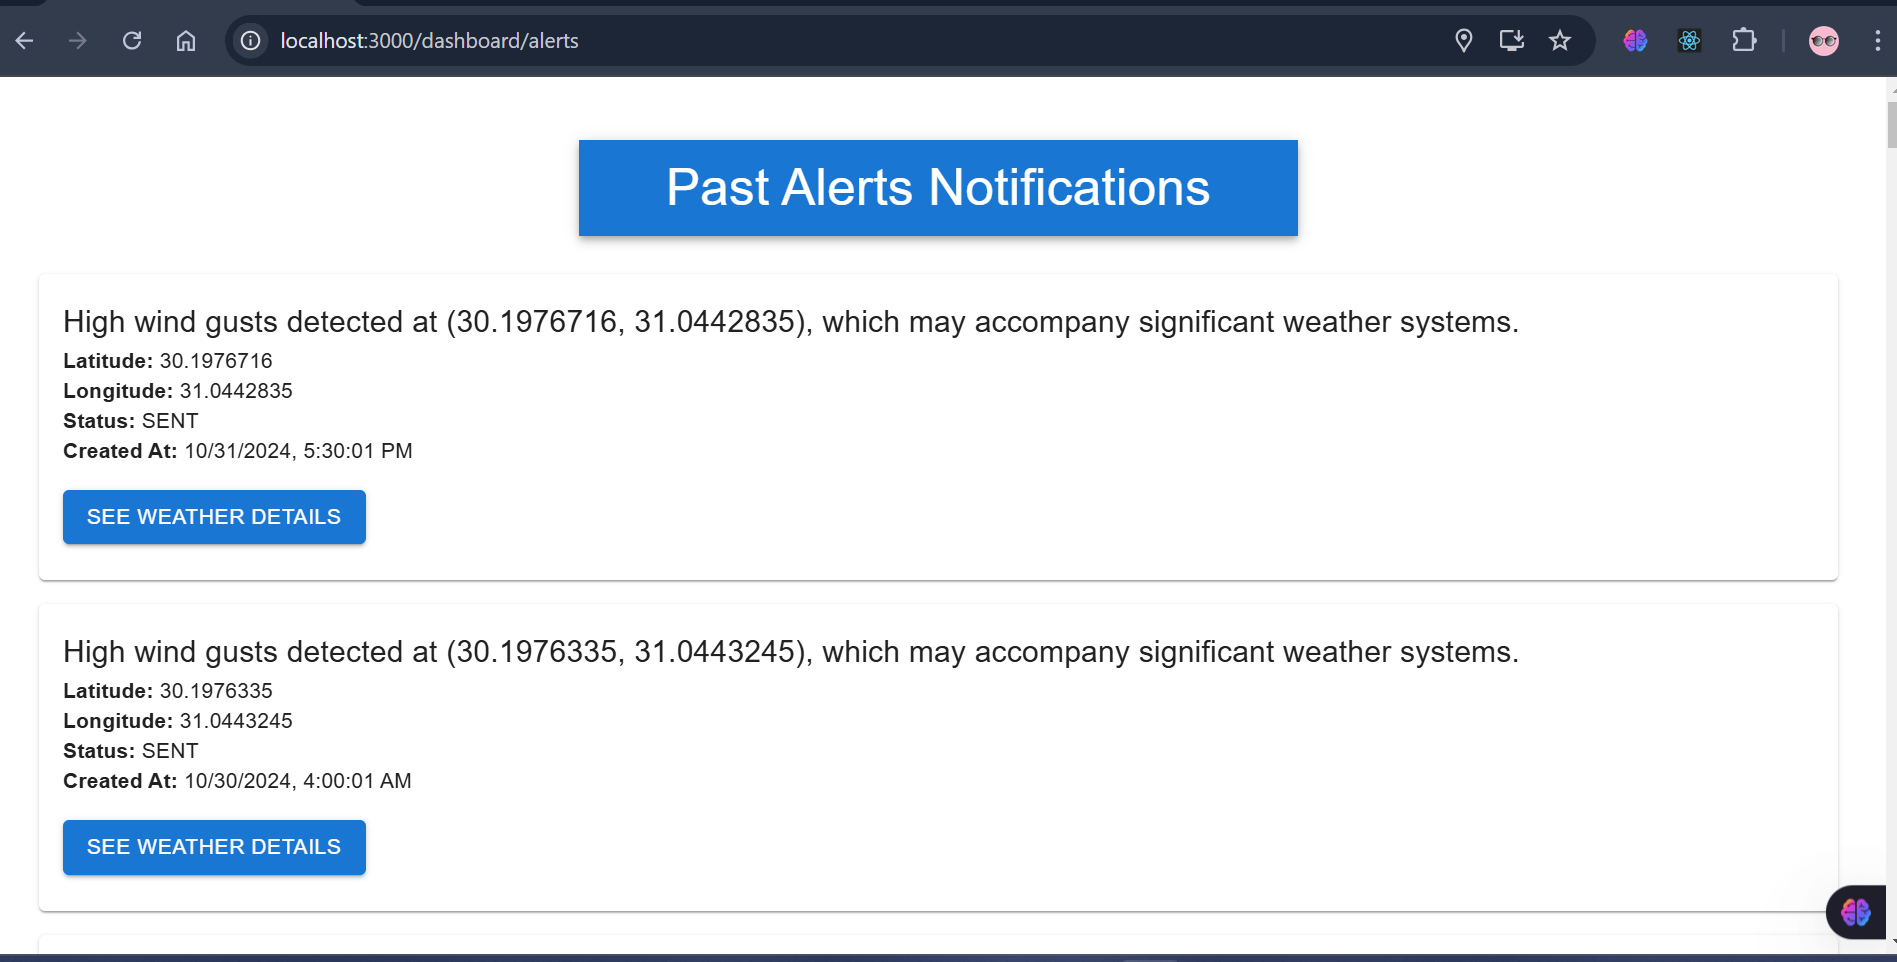
Alert section showing all past notifications that user might have missed (everything is recorded)
-
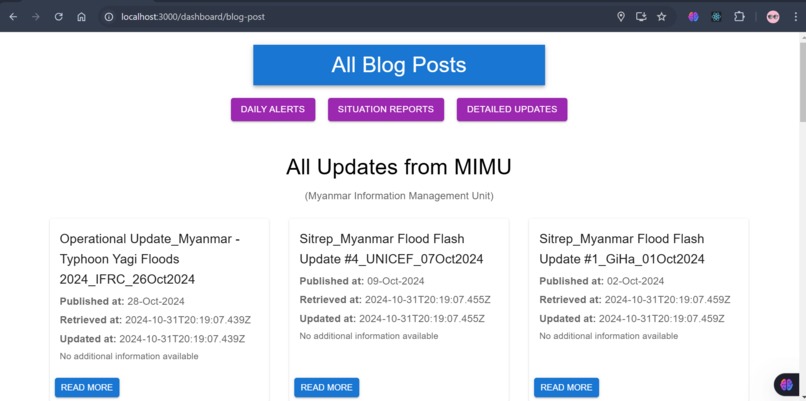
real time reports from different resources (to save users time and for decision makers to see all available data and get best prediction)
-
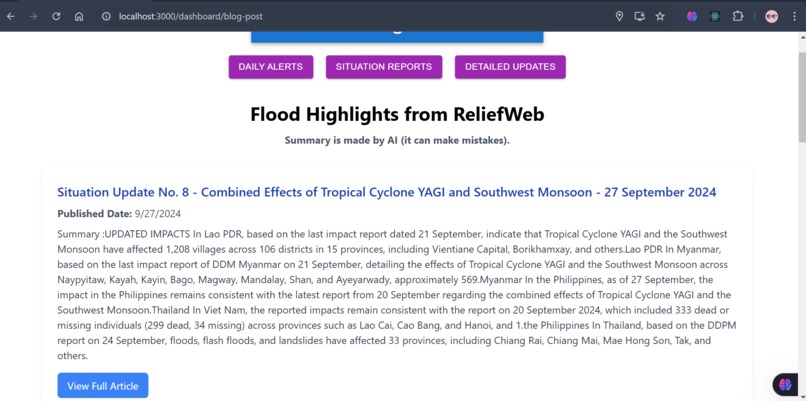
Reports from ReliefWeb which offers global disaster updates, and the Myanmar-Flood app filters this to show only Myanmar-related reports.
-
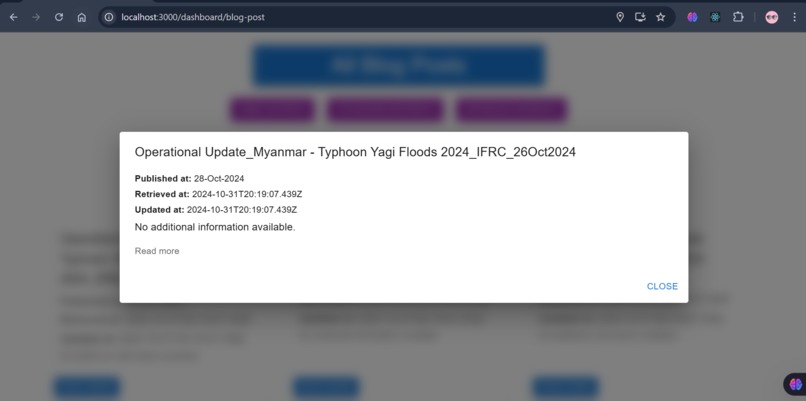
user-friendly design and user can click read more button to read whole pdf
-
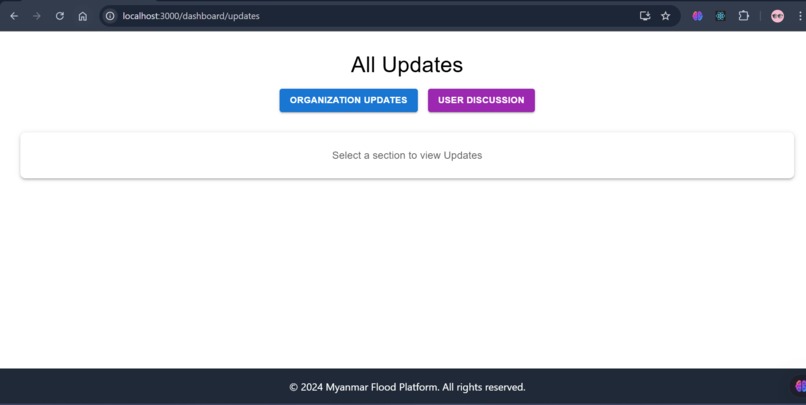
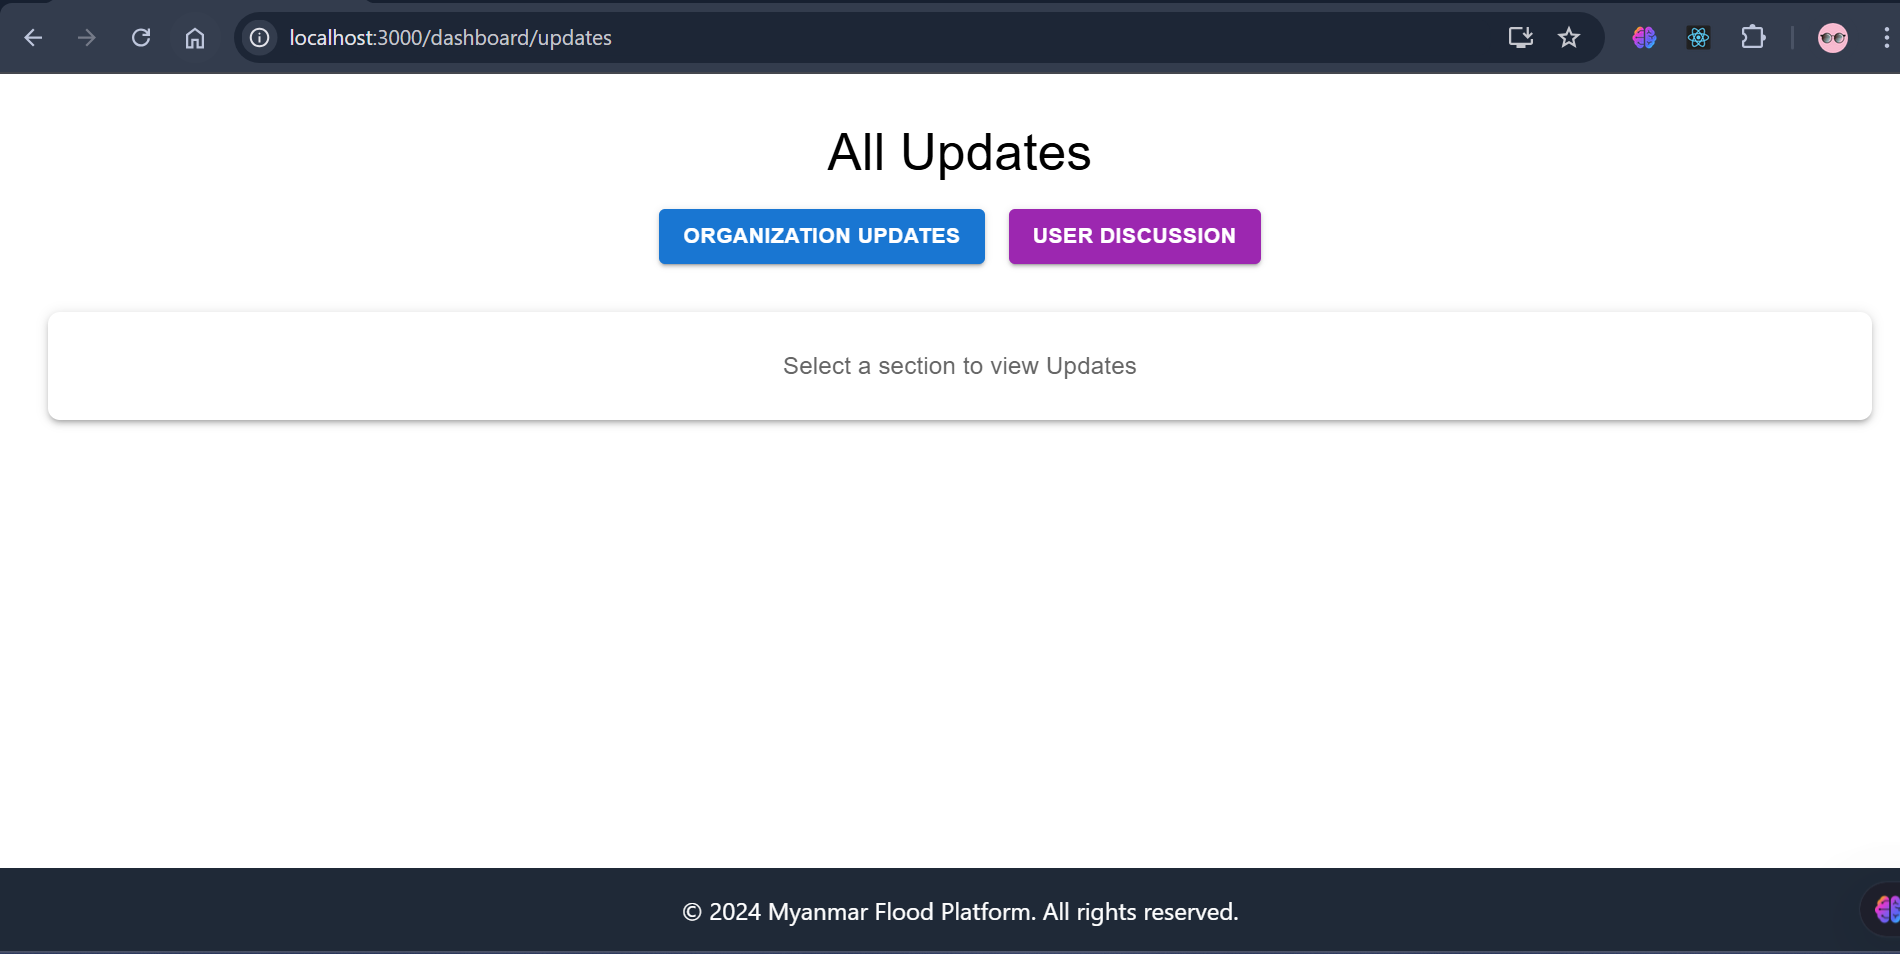
Here all users and organizations can interact with each other through posts, votes, comments
-
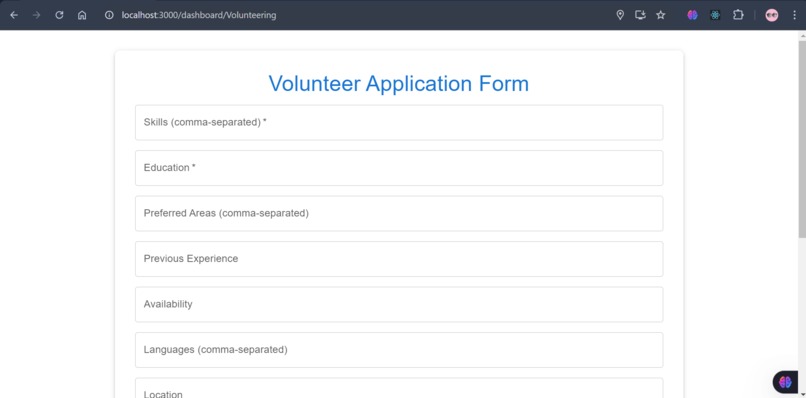
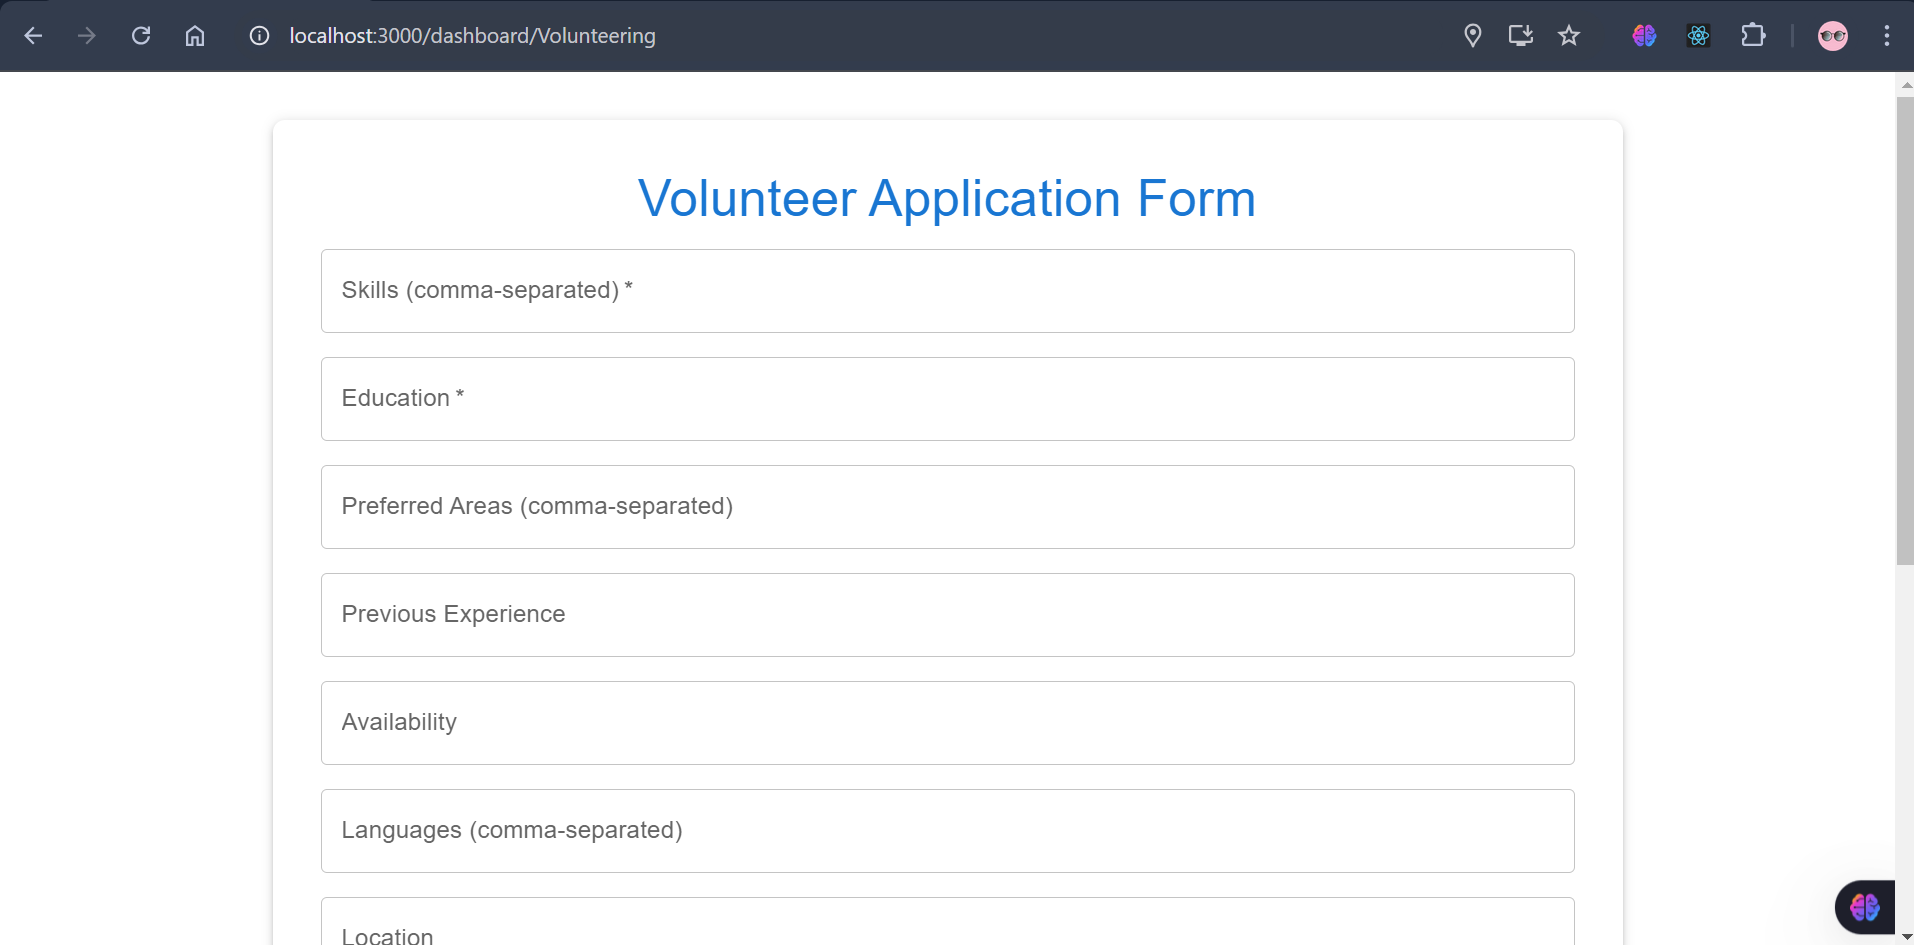
sending volunteering application which will be seen by all organizations and any of them can accept
-

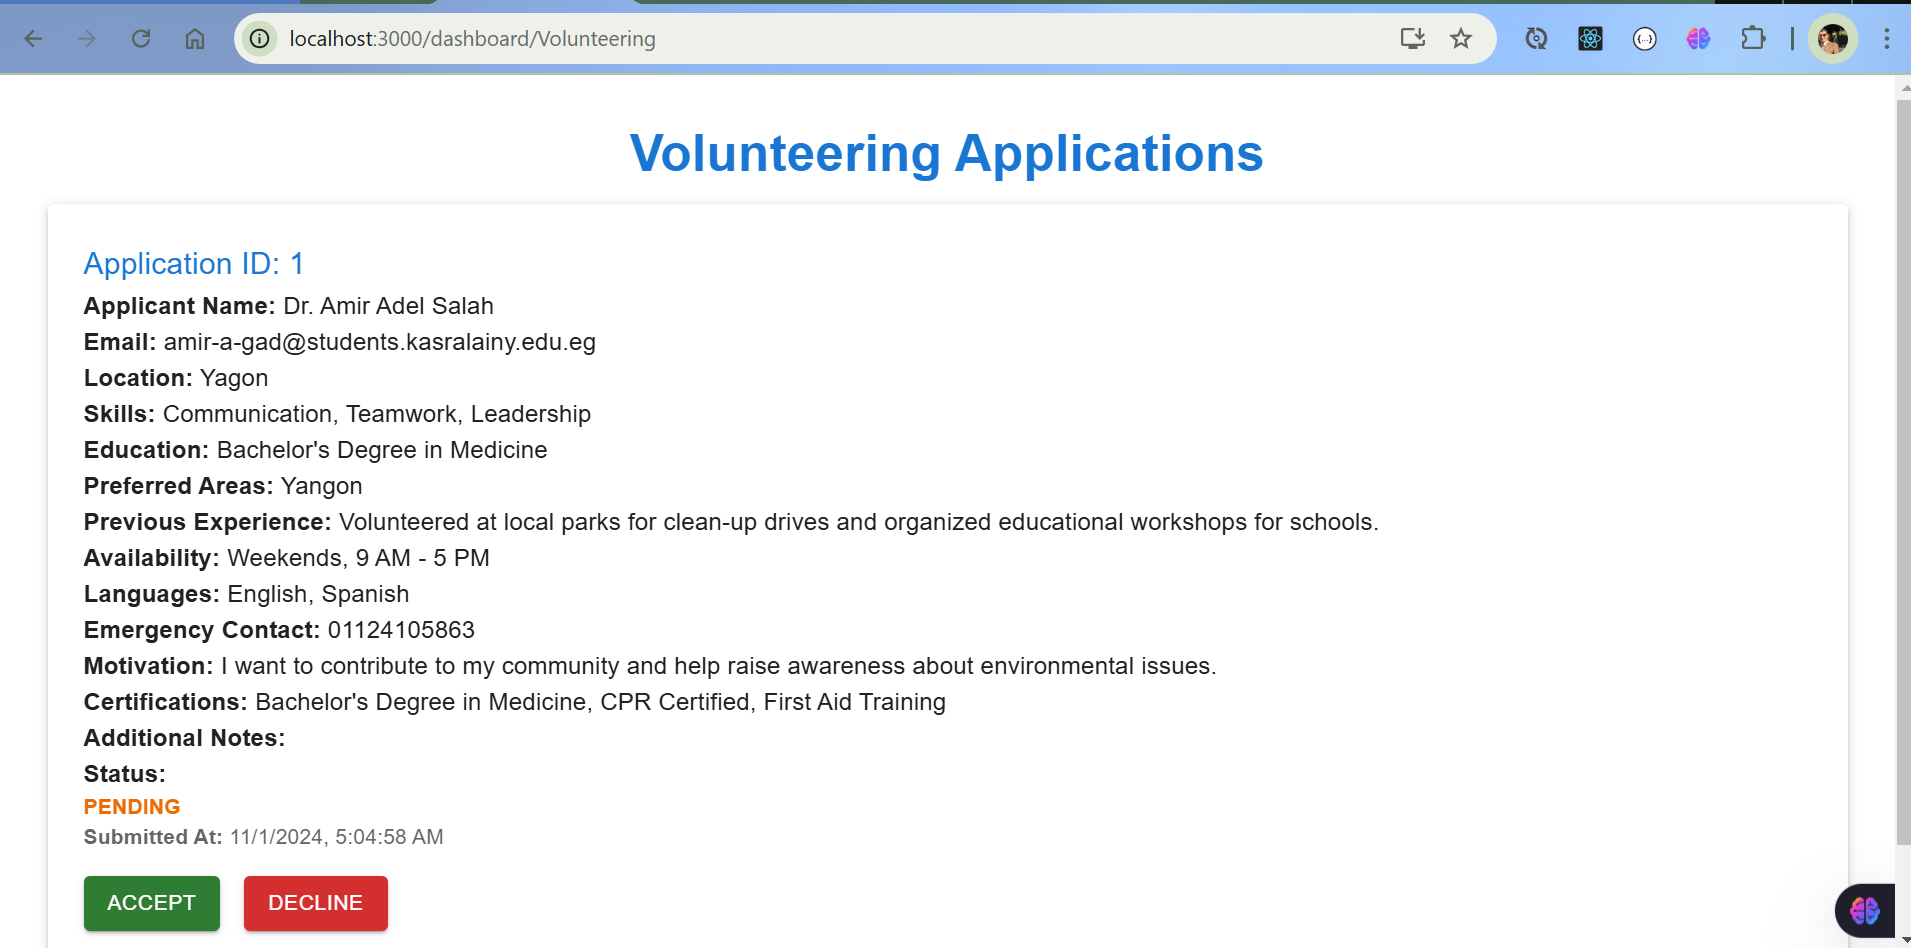
organization can accept or decline volunteering app


Inspiration
The Myanmar-Flood platform started as a standard weather dashboard concept but quickly transformed into a tailored solution for Myanmar. Inspired by the FloodHack event and GLOFAS's forecasting capabilities, I envisioned a solution that would go beyond traditional tools. The platform makes flood data accessible, visually engaging, and actionable for local users, including non-technical individuals, by centralizing information in one place. With a commitment to simplicity and user-friendliness, this platform serves as a one-stop resource to help communities prepare for and respond to flood risks with clear, localized, and real-time insights.
What it does
The platform generates a localized flood simulation by combining GLOFAS forecast data with other sources to provide more accurate results. Users can view emergency-level information on potential floods, including visualized severity levels through infographics. This setup allows users to understand and prepare for the possible impacts of floods with greater clarity.
How we built it
I built it using : Backend: -PostgreSQL: A SQL database for storing application data. -Express.js: A web application framework for Node.js. -Node.js: A JavaScript runtime for server-side programming. Prisma: An ORM for database modeling and querying with PostgreSQL.
ForntEnd: -React.js: A JavaScript library for building user interfaces. Tailwind CSS: A utility-first CSS framework for styling the frontend. Material Ui : for modern design Clerk: An authentication and user management service to handle user sign-up, sign-in, and access control. Leaflet: for client-side mapping
API and Extrnal sources used:
-Flood Data: GLOFAS API – Accessed via Rasdaman for building flood animations and interactive visualizations with varied elevation thresholds. -Weather Data: Open-Meteo API -Maps: MapTiler API for robust mapping layers. -Push Notifications: Web-Push library for real-time alerts. -Reports and Alerts: Aggregated from ReliefWeb, Department of Meteorology and Hydrology (Myanmar), and MIMU (Myanmar Information Management Unit) to provide a unified source for disaster updates.
Challenges we ran into
One of the main challenges was integrating and visualizing data from GLOFAS, which involved handling both coarse and fine-grained data for accurate predictions. Managing user roles and dashboards for different types of users (such as decision-makers, volunteers, and donors) also posed challenges, especially in balancing accessibility with complexity. Furthermore, incorporating real-time notifications in an intuitive way required substantial work in optimizing user experience
Accomplishments that we're proud of
I am especially proud of:
Creating an integrated platform that unites community sectors to address disaster response collaboratively. Developing a map with multiple data layers that automatically updates with real-time flood information. Implementing advanced features like real-time flood alerts and predictions based on multiple data sources. Building a robust user management system with dynamic dashboards and multi-role support, allowing efficient communication and resource management during crises.
What we learned
-New technologies such as interactive maps and role-based UI elements. -The importance of user experience in emergency applications, along with the flexibility needed to accommodate diverse data sources. -How to implement real-time notifications and customized settings to make the platform effective for all users and Organizations.
What's next for #Myanmar Flood Platform
Looking ahead, I plan to:
-Scale the application to reach a broader user base. -Expand real-time monitoring and add predictive functionalities for better emergency preparedness. -Using more models ** to make flood prediction more accurate -Extend application to be used by **divers sectors of the community (higher level org, decision makers) -Add more local dialects to make the platform inclusive across Myanmar. -Create custom dashboards and alerts based on visualized data to strengthen community resilience and emergency response coordination. -Adding section for blogposts of health related data and adding AI supporive dashboard to provide initial advice -Managing disease outbreak during flood
-When applying Higher order org, I am planning to connect them with local org and they can assign tasks and gives order to them
-Introduce features like PDF summarization to save user time and enhance usability.


Log in or sign up for Devpost to join the conversation.