-

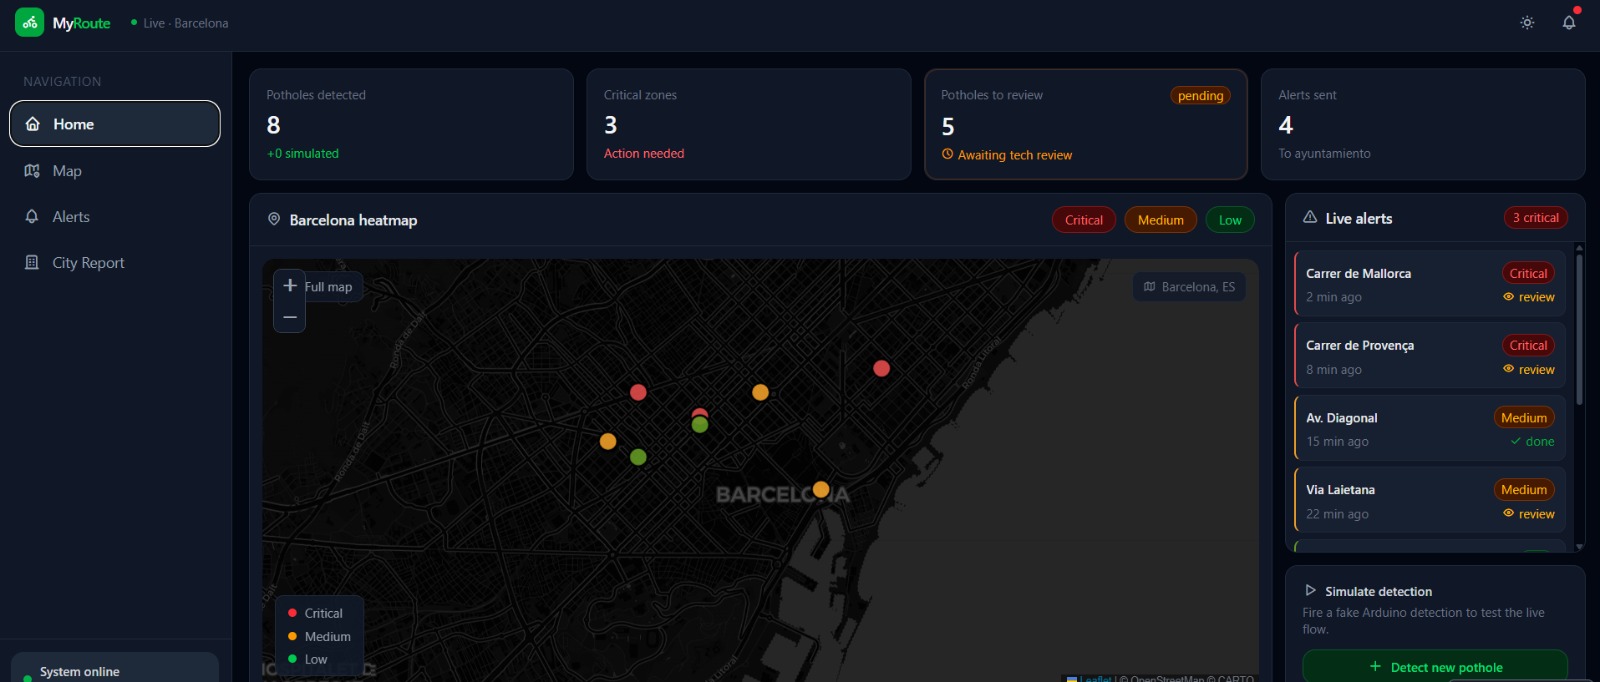
Web UI monitoring dashboard
GITHUBS
https://github.com/SanchezHL/PotholeMapTracker/ https://github.com/Shugarry/ArduinoPotholeTracker
Documentation of MyRoute App
by Psycode
Frontend Documentation
1. Motivation
Barcelona manages thousands of kilometers of cycling infrastructure across its districts. With the rapid rise of e-bikes and electric scooters, which are heavier and faster than traditional bicycles, road surface deterioration has accelerated significantly. Yet, the city's current approach to pothole detection remains reactive, relying on manual inspections, slow municipal reports, and citizen complaints that often arrive too late.
The core problem is not the absence of potholes; it is the absence of real-time, actionable data about them.
MyRoute transforms the existing public bicycle fleet into a distributed sensor network. By equipping bikes with an Arduino UNO R4 board, an accelerometer, and a camera module, the system detects, classifies, and reports road damage automatically. This allows for intervention before accidents happen, before cyclists are discouraged, and before a small crack turns into a costly reconstruction.
Our motivation is threefold:
- Safety: Undetected potholes cause serious accidents, particularly for cyclists who lack a protective frame.
- Sustainability: Every person deterred from cycling due to poor road conditions is a person who may switch to a car, increasing emissions in an already congested city.
- Economic Efficiency: Predictive maintenance costs a fraction of reactive repair. Fixing a crack today is ten times cheaper than rebuilding a sunken lane next year.
Ultimately, our vision is to make Barcelona a healthier, smarter city by leveraging technology to its full potential. While our current focus is on cycling infrastructure, MyRoute is designed to be inclusive. We aim to put ourselves in the shoes of all road users, including wheelchair users, parents with strollers, and drivers, ensuring that urban mobility is safe and accessible for everyone.
2. Interface Structure
The application is organized around four pages, each serving a distinct role in the detection-to-action pipeline.
2.1 Home Page: Live View
The operational command center. Four metric cards at the top display total potholes detected, critical zones requiring immediate action, detections awaiting technical review, and alerts sent to the ayuntamiento.
Below the metrics, a live Leaflet map of Barcelona shows all current detections as color-coded pins: red for critical, amber for medium, and green for low severity. Pins can be filtered by severity, and clicking any pin navigates to its full alert detail. A live alerts list on the right shows the most recent detections with review status, and a simulation panel allows testing the detection pipeline with fake Arduino events.
2.2 Alerts Page: Alert Categorization Interface
The triage center. Lists all incoming detections with full metadata: street name, zone, time, bike identifier, pothole count, and review status. A search bar filters by street or zone. Five filter pills narrow the list by status (All, Pending, Critical, Medium, Low) with a live count badge on the Pending filter. Each alert row navigates to its individual detail page.
2.3 Alert Detail Page: Individual Alert View
Each alert opens its own page at /alert/:id. The top navigation provides a context-aware back button, returning to home or the alerts list depending on where the user came from, plus previous and next arrows for sequential review without returning to the list.
The main card shows three info cards summarizing location, detection time, and pothole count. Below, a two-column layout places the detection image on the left and the tech review panel on the right. The review panel allows the technician to reclassify severity, add notes for the maintenance team, mark the detection as reviewed, and send it directly to the city.
2.4 Map Page: Full Interactive Map
A full-screen Leaflet map that takes over the entire viewport. Overlay cards float on top: a stats pill showing total, critical, and unreviewed counts; severity filter pills; and a legend. Clicking any pin opens a detail card with a flyTo animation. The map tiles switch between dark and light styles automatically when the user toggles the theme.
2.5 City Report Page
Designed for presentation to municipal authorities. Contains summary stat cards, a bar chart of potholes by zone with expandable detail, a zone status grid with severity breakdown, a recent activity timeline, and a reports sent table. An Export PDF button captures the entire report as a high-resolution PDF.
3. Frontend Technologies
3.1 TanStack Start
The full-stack React framework powering the application's routing and server-side rendering. Its file-based routing maps directly to the four-page structure: map.tsx becomes /map, alerts.tsx becomes /alerts, and alert.$alertId.tsx handles individual alert routes at /alert/1, /alert/2, and so on without manual configuration.
TanStack Router's Link component provides type-safe navigation with active state detection, powering the sidebar's highlighted active page. TanStack Query manages all data fetching and caching across the application.
3.2 React
Built entirely with React functional components and hooks. useState manages local UI state such as filter selections and the dark mode toggle. useEffect handles side effects including map initialization and the MutationObserver that swaps map tiles on theme change. useRef holds map instances and marker arrays that must persist across renders without triggering re-renders.
3.3 Tailwind CSS v4
All styling is handled by Tailwind CSS v4 via the @tailwindcss/vite plugin. The v4 architecture eliminates a separate config file; dark mode support is declared directly in the CSS:
@custom-variant dark (&:where(.dark, .dark *));
This applies dark: prefixed utilities whenever .dark is present on the html element, toggled by the theme button in the topbar. Both themes are fully supported across all pages, with the user's preference persisted to localStorage.
3.4 Leaflet
The mapping library used for both the home page mini-map and the full-screen map page. Loaded via CDN to avoid Vite dependency optimization issues encountered with npm imports. CartoDB tile layers provide both dark and light map styles, switching automatically via a MutationObserver when the theme changes. Pothole detections are rendered as circleMarker elements for reliability across all viewport sizes.
3.5 html2canvas + jsPDF
Power the City Report PDF export. Both are imported dynamically on demand so they do not increase the initial bundle size. html2canvas rasterizes the report DOM node at 2x resolution and jsPDF converts it to a multi-page A4 PDF, adapting the background color to the current theme.
4. Machine Learning
4.1 Implementation
Our machine learning model used more than 1,600 images to learn how to recognize potholes in the road surface and road markings. The road markings are also classified according to their level of deterioration. Recognizing these elements helps us have a clearer understanding of the condition of bike lanes, which supports lane repair and benefits different people, such as cyclists.
4.2 Problems Faced
These images come from two open-source databases: one containing images of potholes and another containing images of road markings. Our model has an accuracy of 60%. The success rate is low because combining the two databases produced images with unmarked potholes and images with unmarked road markings. One possible solution would have been to remove these images, but there were too many to do this properly. Another solution could have been to use two separate models, but this was not possible because App Lab does not allow it.
5. Data Infrastructure & Backend
These are the criteria we followed to create the engine that powers the ingestion, validation, and persistence of the information captured by the distributed sensor network across the bicycle fleet.
5.1 High-Performance Distributed Ingestion API: FastAPI
To support a real-time sensor network, I have implemented an asynchronous backend using FastAPI.
- Incident Management: The
/road-incidentsendpoint acts as the universal receiver for the Arduino units and capture devices. - Schema Validation: Using Pydantic models, I ensure that every report, including GPS coordinates, accelerometer levels, and image metadata, arrives intact and follows the strict data structure required for processing.
- Asynchronous Scalability: The architecture allows hundreds of bicycles to report potholes simultaneously without blocking the data flow to the dashboard, ensuring the system remains responsive under high load.
5.2 Cloud Persistence: MongoDB Atlas
We selected a NoSQL (MongoDB Atlas) database to manage the dynamic and geospatial nature of road incidents.
- Document-Oriented Storage: Each detection is stored as a rich document, allowing us to handle complex nested objects, such as GPS coordinates and ISO8601 timestamps, efficiently.
- Geo-Replicated Availability: By using Atlas, data does not reside on a local server but in a cloud cluster. This guarantees that municipal authorities can access the information with minimal latency and maximum security from any location.
- Frontend Integration: I have designed optimized query endpoints to ensure that the Leaflet maps (Section 2.1) receive filtered, lightweight data, significantly improving loading times and the user experience.
5.3 The Data Pipeline: From Bike to Screen
Closes the system loop through four critical stages:
- Ingestion: Secure reception of the JSON payload sent by the detection hardware.
- Processing: Normalization of coordinates and initial data classification.
- Persistence: Reliable storage in the cloud, protected against server failures.
- Distribution: Serving filtered data for the metrics on the
Home Pageand theAlert Detailviews (Sections 2.1 and 2.3).
6. Arduino Technologies
6.1 Arduino Technologies & Edge AI
To transform a standard bicycle into a smart edge-computing node, we utilized the Arduino App Lab ecosystem, leveraging a hybrid software architecture that combines the low-level efficiency of C++ with the high-level data processing capabilities of Python.
6.2 Hardware Architecture
The physical node is built around the Arduino UNO Q board, augmented with the Modulino ecosystem for plug-and-play prototyping. The hardware stack includes:
- Modulino Movement (LSM6DSOX): A highly precise 6-axis IMU to detect the bicycle's movement and stops.
- Modulino Pixels & Buzzer: To provide immediate visual (8 LEDs) and auditory feedback to the cyclist.
- Modulino Knob: A physical push-button used by the rider to signal the end of the trip and trigger data synchronization.
- Brio 105 Web Camera: Connected via USB to capture the road surface in real time.
6.3 Hybrid Software Environment (C++ & Python)
The system operates simultaneously in two layers, communicating seamlessly via Arduino_RouterBridge using RPC (Remote Procedure Call). The C++ sketch acts as the real-time hardware controller. It continuously reads the accelerometer data at high speeds and controls the LED matrix and buzzer. The Python environment acts as the central brain. It runs the machine learning model (VideoObjectDetection), manages the local SQLite database, serves the WebUI for live video streaming, and handles HTTP requests to the backend API.
6.4 Smart Energy Management
Running continuous video object detection on a battery-powered edge device is highly resource-intensive. To solve this, we implemented a "Smart Wake" logic. The C++ layer constantly evaluates acceleration vectors. If the bike stops (for example, at a red light), C++ sends a motion_stopped event to Python, which pauses the camera feed and AI processing. The moment the rider pedals, a motion_started event instantly reactivates the detection pipeline, drastically extending battery life.
6.5 Real-Time Feedback & Data Sync
The system prevents accidents by alerting the cyclist before they hit a hazard. When the Python AI detects a pothole, it instantly fires a callback to C++, which flashes the Modulino LEDs in red and triggers a warning tone on the buzzer. To prevent data loss in areas with poor 4G/5G coverage, all detections, including Base64 image captures and GPS coordinates, are cached locally in a SQLite database. Once the trip is over, the user presses the Modulino Knob. C++ registers the physical input and signals Python to execute a batch upload to the FastAPI backend, clearing the local cache upon a successful 200 OK response.
7. Deployment: VULTR
For deployment, both the web app and the backend services rely on Vultr. The web app is deployed in its own instance with docker and can be accessed via the GoDaddy domain myroute.psycode.club.
The ingestion service is deployed as a Dockerized FastAPI microservice on Vultr, using environment variables to connect securely to a managed MongoDB database.
For production, multiple Vultr instances run the same container behind a Vultr Load Balancer, which routes traffic and checks service health through the /health endpoint.

Log in or sign up for Devpost to join the conversation.