-
-
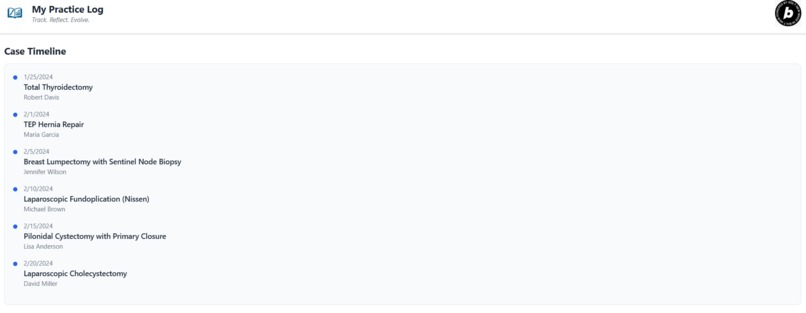
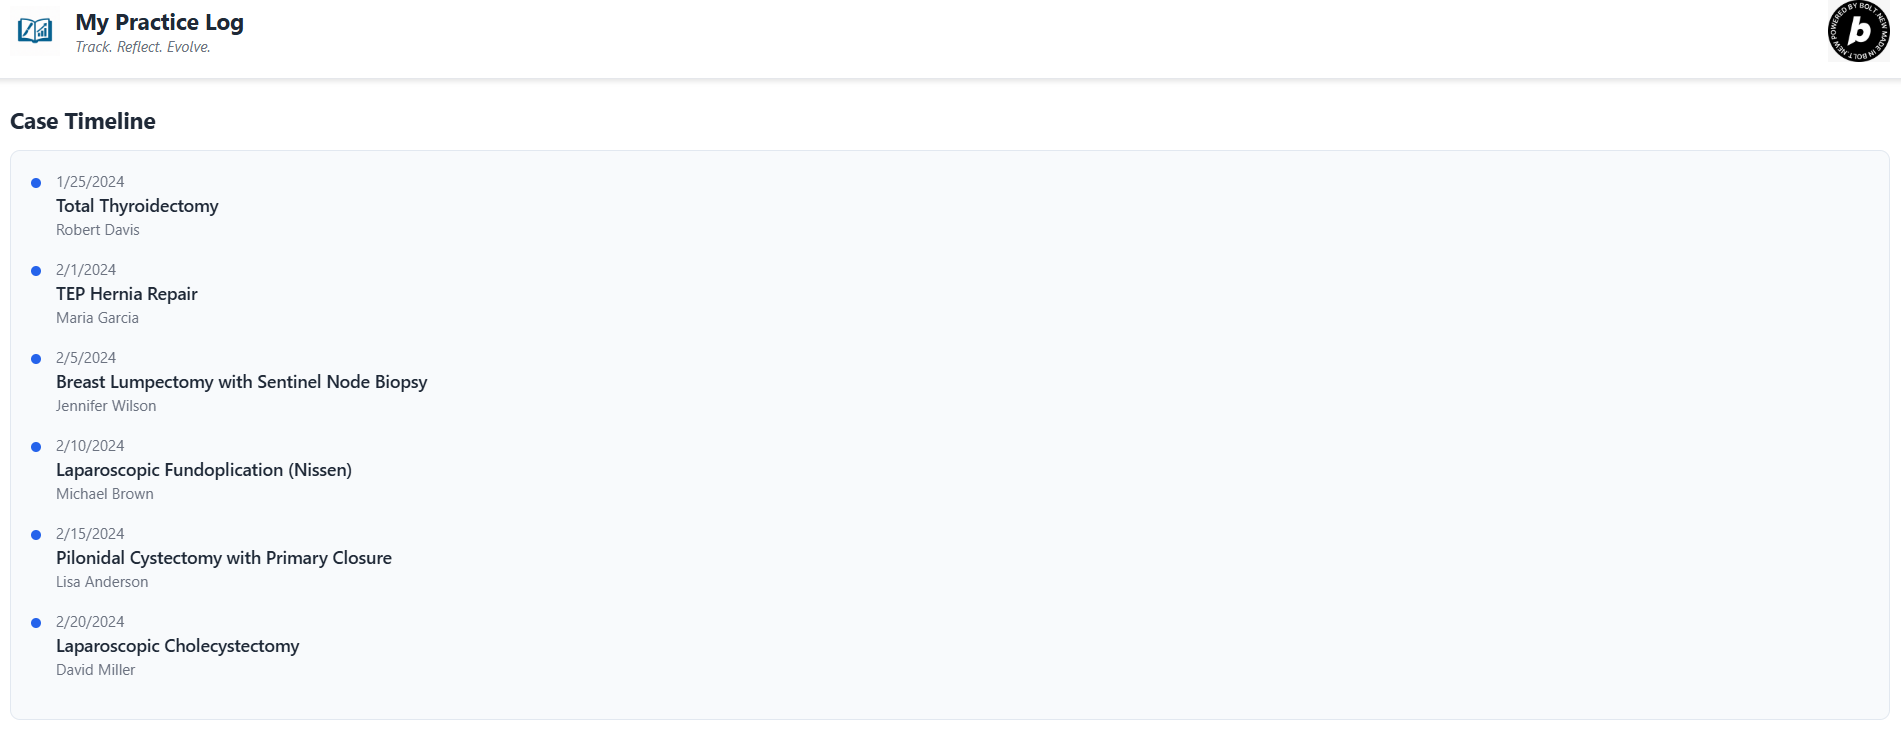
Case timeline on dashboard
-

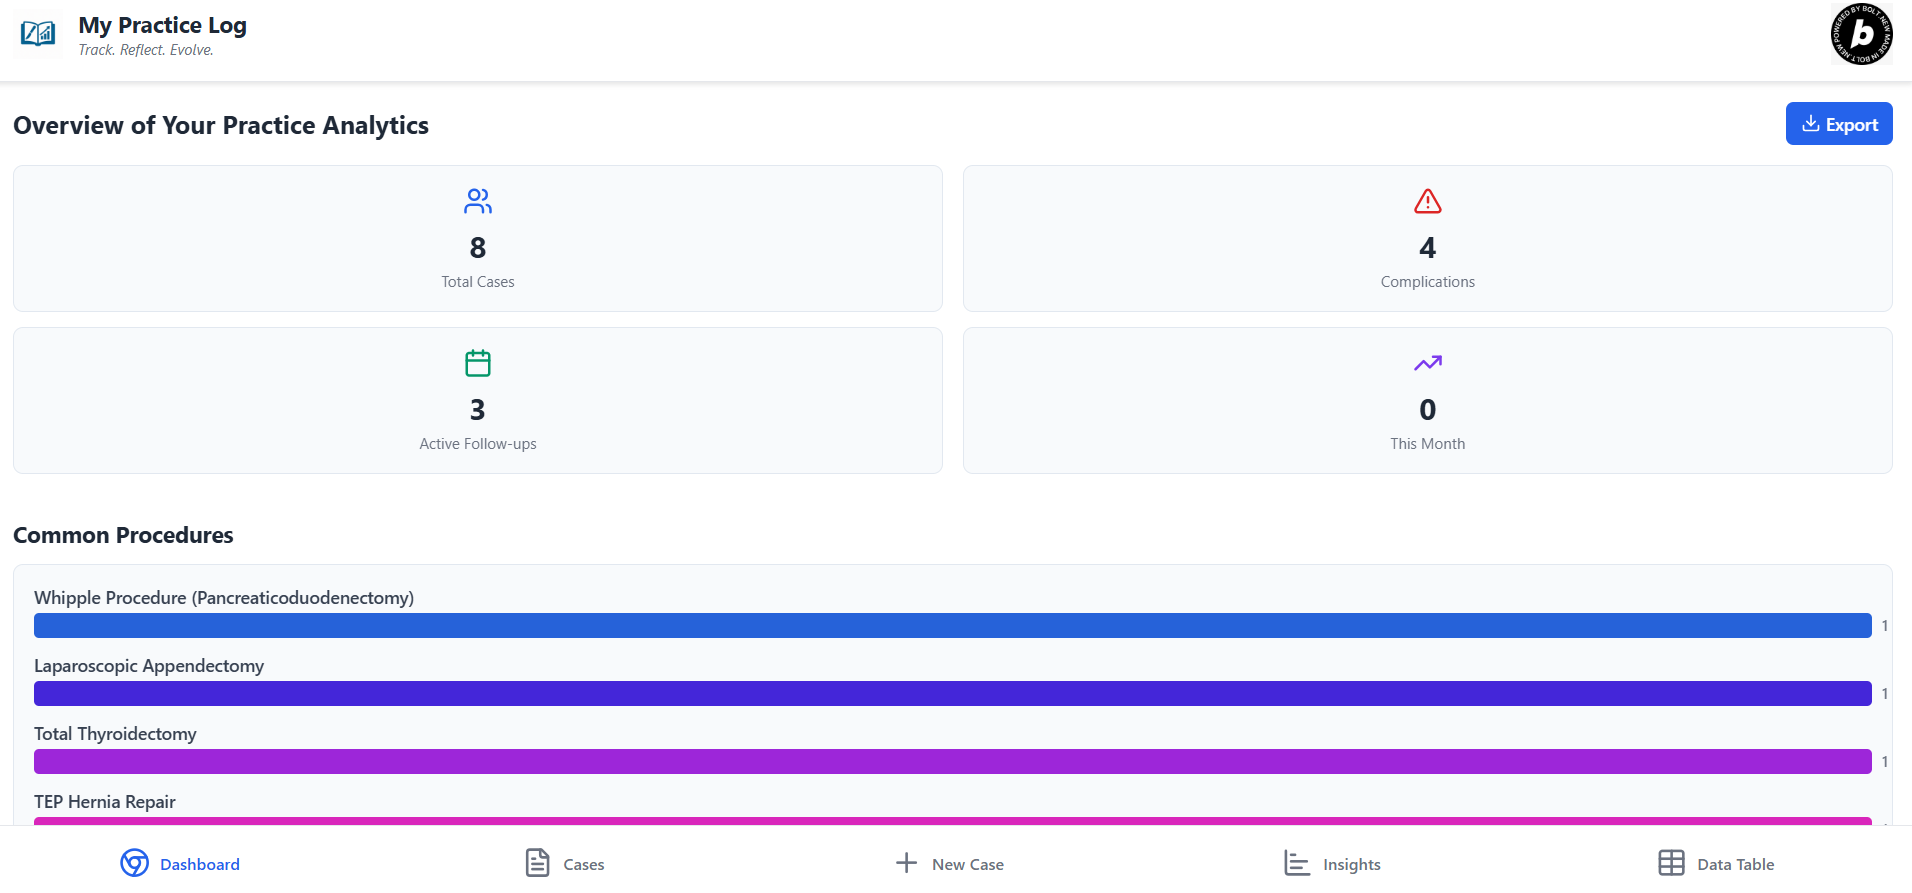
Dashboard: Review your practice at a glance
-
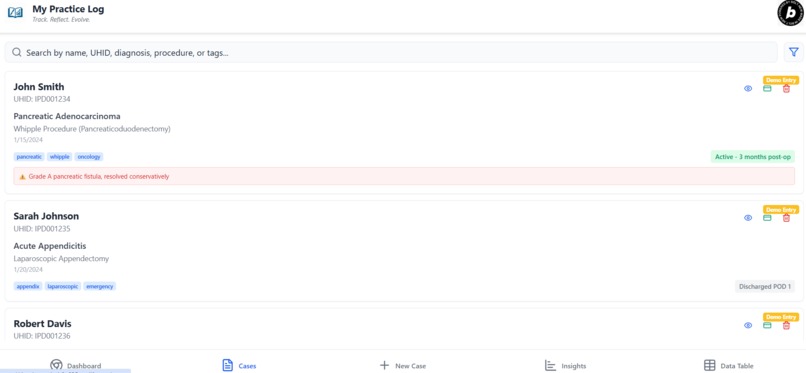
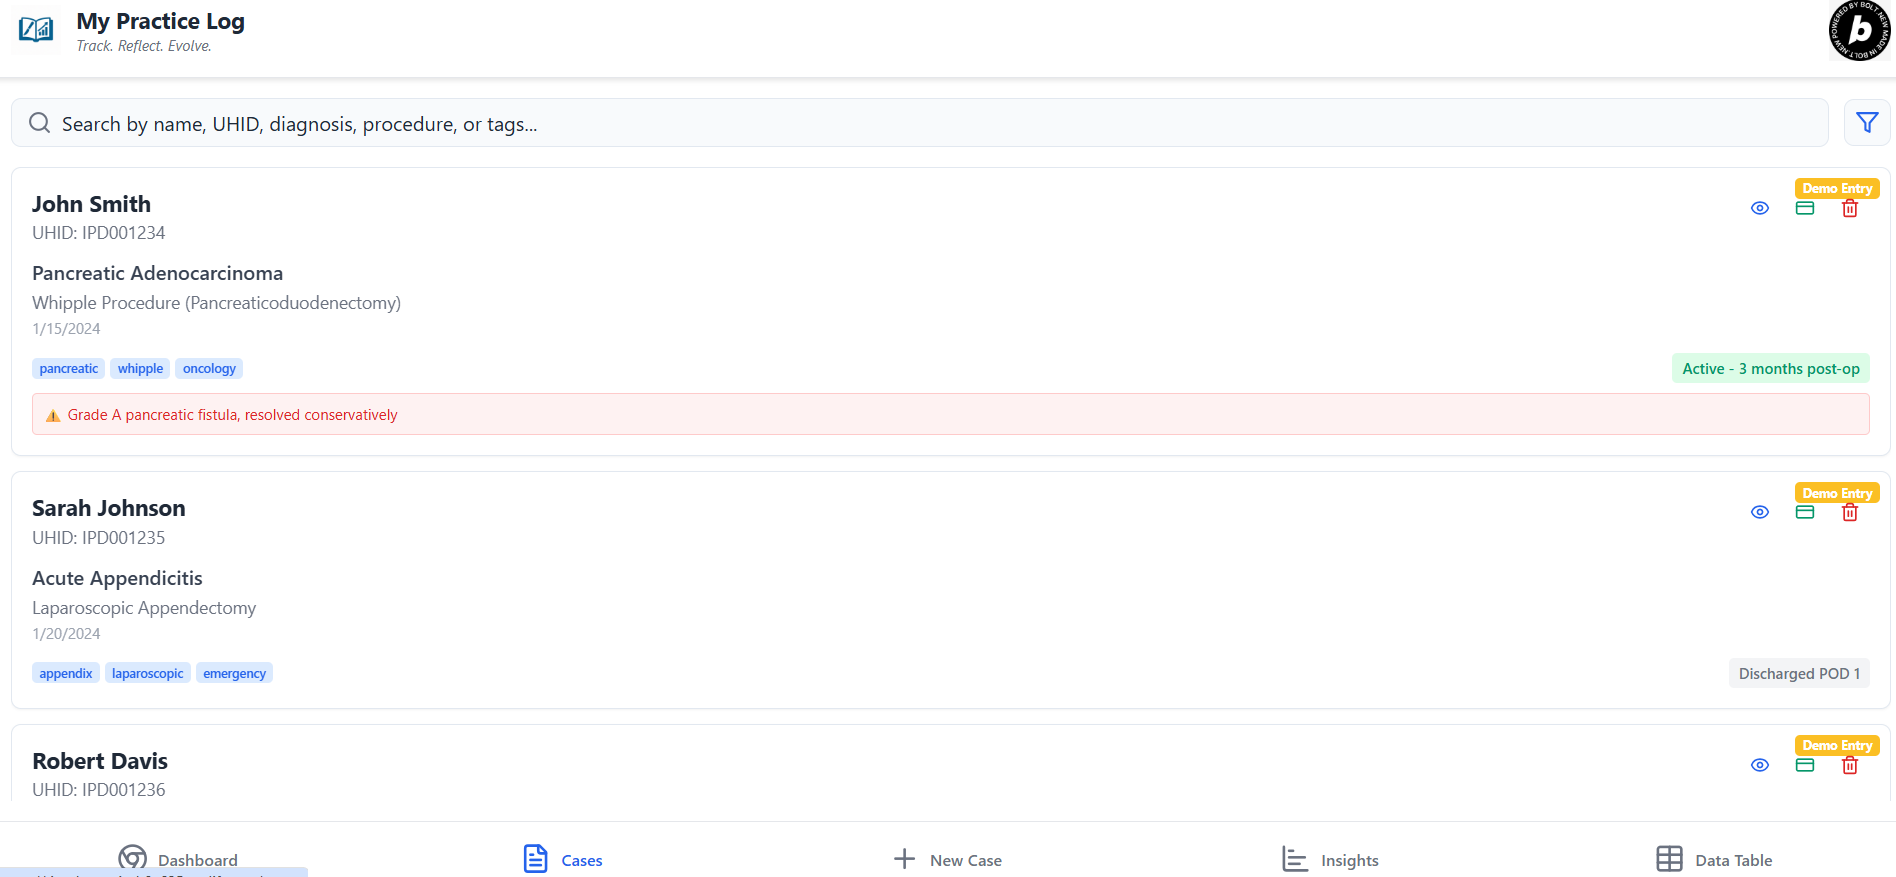
Case details
-
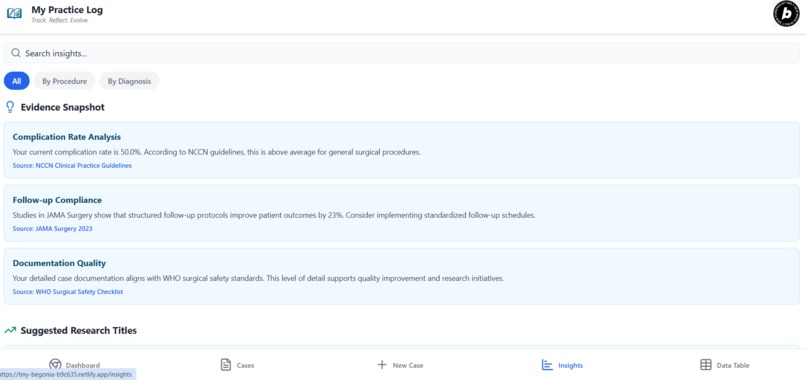
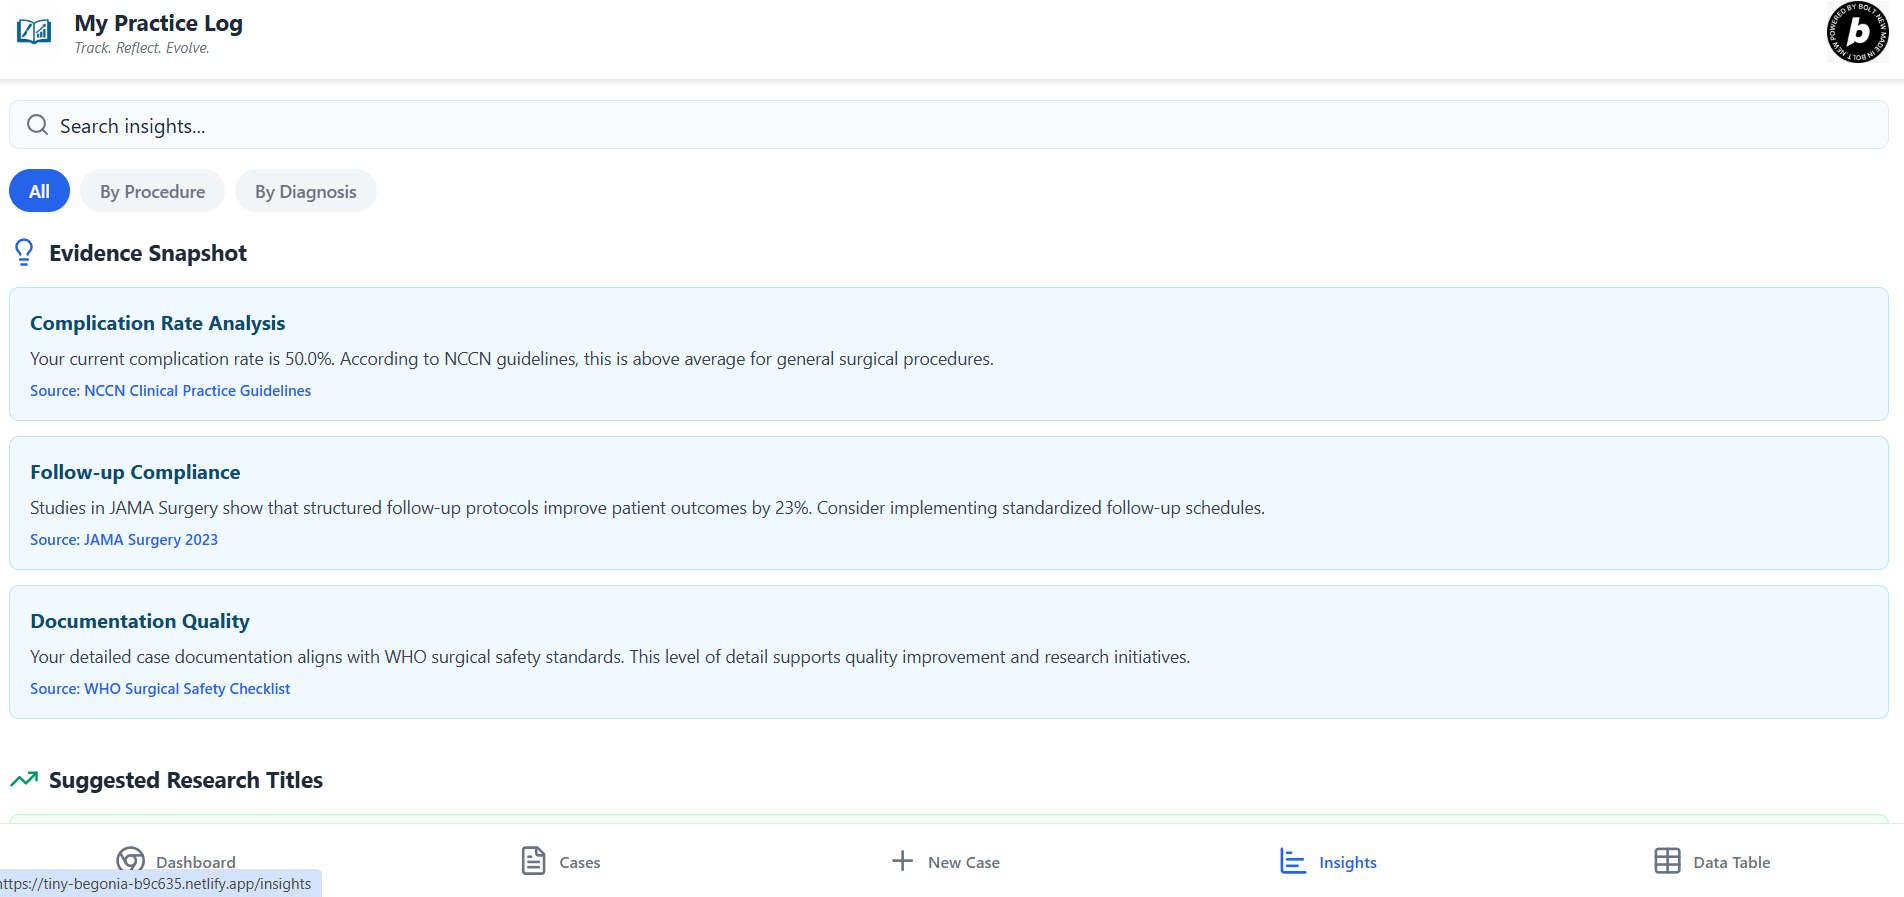
Insights: reflect upon your cases and get AI curated resources to learn from published evidences related to your insights
-

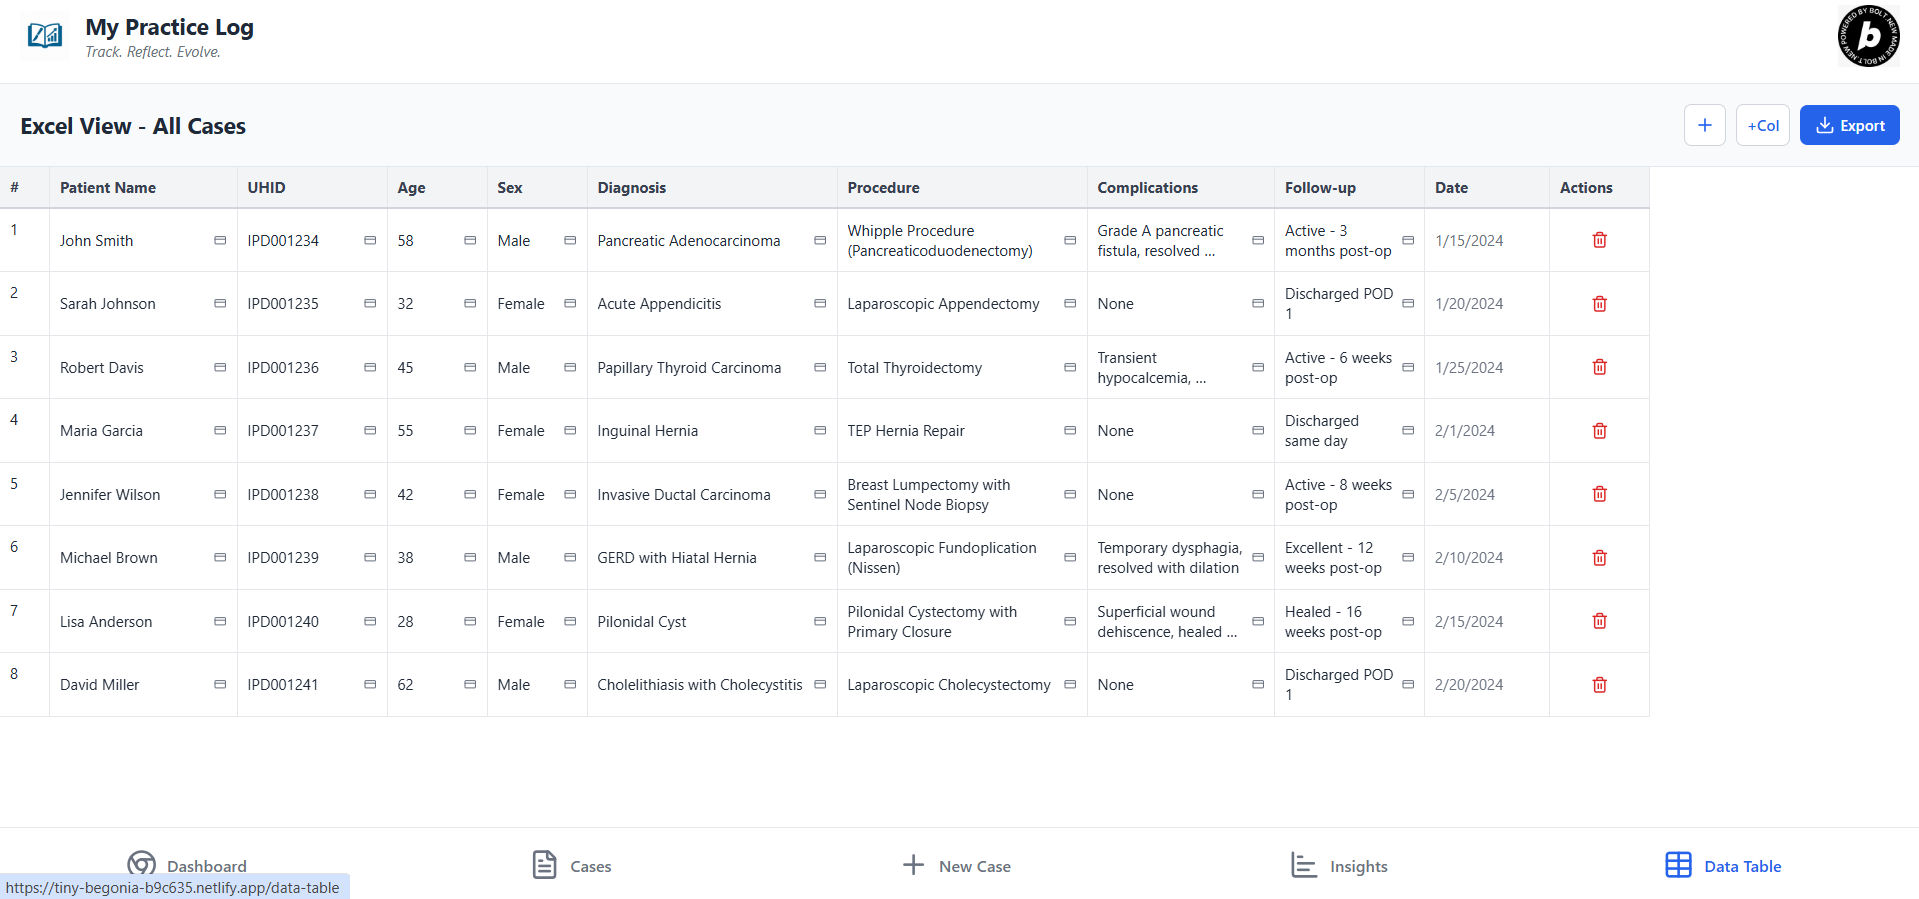
Data Table: all data in your master chart so that you can study, publish and enhance your practice!
🩺 My Practice Log
Track. Reflect. Evolve.
🚀 Elevator Pitch
My Practice Log is a mobile-first, research-grade medical logbook designed to help doctors and surgeons document cases, reflect on outcomes, and generate research-ready insights — all from a single app.
Doctors can enter detailed case data including radiology, procedures, intraoperative details, complications, follow-up, and attach any number of images, videos, or documents. A dynamic Excel-style interface allows editing, analysis, and export — optimized for publication and statistics.
An interactive dashboard visualizes trends, survival curves, and complications. Doctors can also add personal insights, while AI generates evidence-backed suggestions and research titles from reputed sources.
This Progressive Web App runs on mobile or desktop and starts with demo data to showcase all features — allowing users to delete demo entries and begin logging their own clinical journey.
💡 Inspiration
Many doctors, especially solo practitioners and surgeons, still rely on handwritten notes or basic spreadsheets to track their clinical work. This makes it hard to reflect, learn from outcomes, or prepare structured data for research.
My Practice Log was born out of the need for a tool that merges real clinical practice with academic progress — one that helps doctors track their work, extract learnings, and build a legacy of data that can power research and improvement.
🔨 What It Does
- 📁 Case Logging: Store detailed patient data (diagnosis, radiology, surgery, complications, follow-up)
- 🧾 File Upload: Add unlimited images, videos, or PDFs to any field
- 🛠️ Custom Fields: Tailor headings per user needs — usable even by non-surgeons
- 📊 Excel-Compatible Table: Editable spreadsheet view of all data, ready for statistical tools
- 📈 Dashboards: Real-time analytics, trends, procedure stats, survival curve placeholders
- 💬 Insights: Add personal learnings; view AI-curated clinical guidance with clickable references
- 🧪 Mock Data: 8 realistic demo cases to test features and visualize trends
🧱 How We Built It
- Expo (React Native) + React Navigation
- TypeScript for type-safe modular architecture
- AsyncStorage for local persistence
- Victory Charts and Chart.js for data visualization
- CSV/Excel export utilities
- PWA-ready frontend, deployed via Netlify
🧪 Challenges We Ran Into
- Cross-platform compatibility for editable tables on mobile
- Ensuring smooth UX on small devices for forms and graphs
- Making file upload placeholders intuitive across use cases
- Simulating real-world AI insights with journal-style content and references
🌟 Accomplishments
- Built a fully functional medical logbook in a single prompt
- Polished UI that works across mobile, tablet, and desktop
- Includes complete analytics, editable spreadsheet, and AI-backed insights
- Successfully deployed as a web app with mock data and real use-case coverage
📚 What We Learned
- How to modularize clinical data entry for varied medical specialties
- Best UI/UX practices for mobile-first apps in healthcare
- Effective integration of research insight generation
- PWA deployment and limitations (to be improved post-submission)
🛣️ What's Next
- Full offline-ready PWA manifest and service worker integration
- Secure cloud sync (optional)
- Real-time AI integration with APIs like PubMed or Semantic Scholar
- Patient portal, billing, appointment tracking features
- Research assistant module: automatic cohort identification and paper drafting
🔗 Live Demo
👉 https://tiny-begonia-b9c635.netlify.app
A powerful logbook for doctors who want to grow — clinically and academically.
Built With
- asyncstorage
- chart.js
- csv
- native
- netlify
- react
- typescript

Log in or sign up for Devpost to join the conversation.