-
-

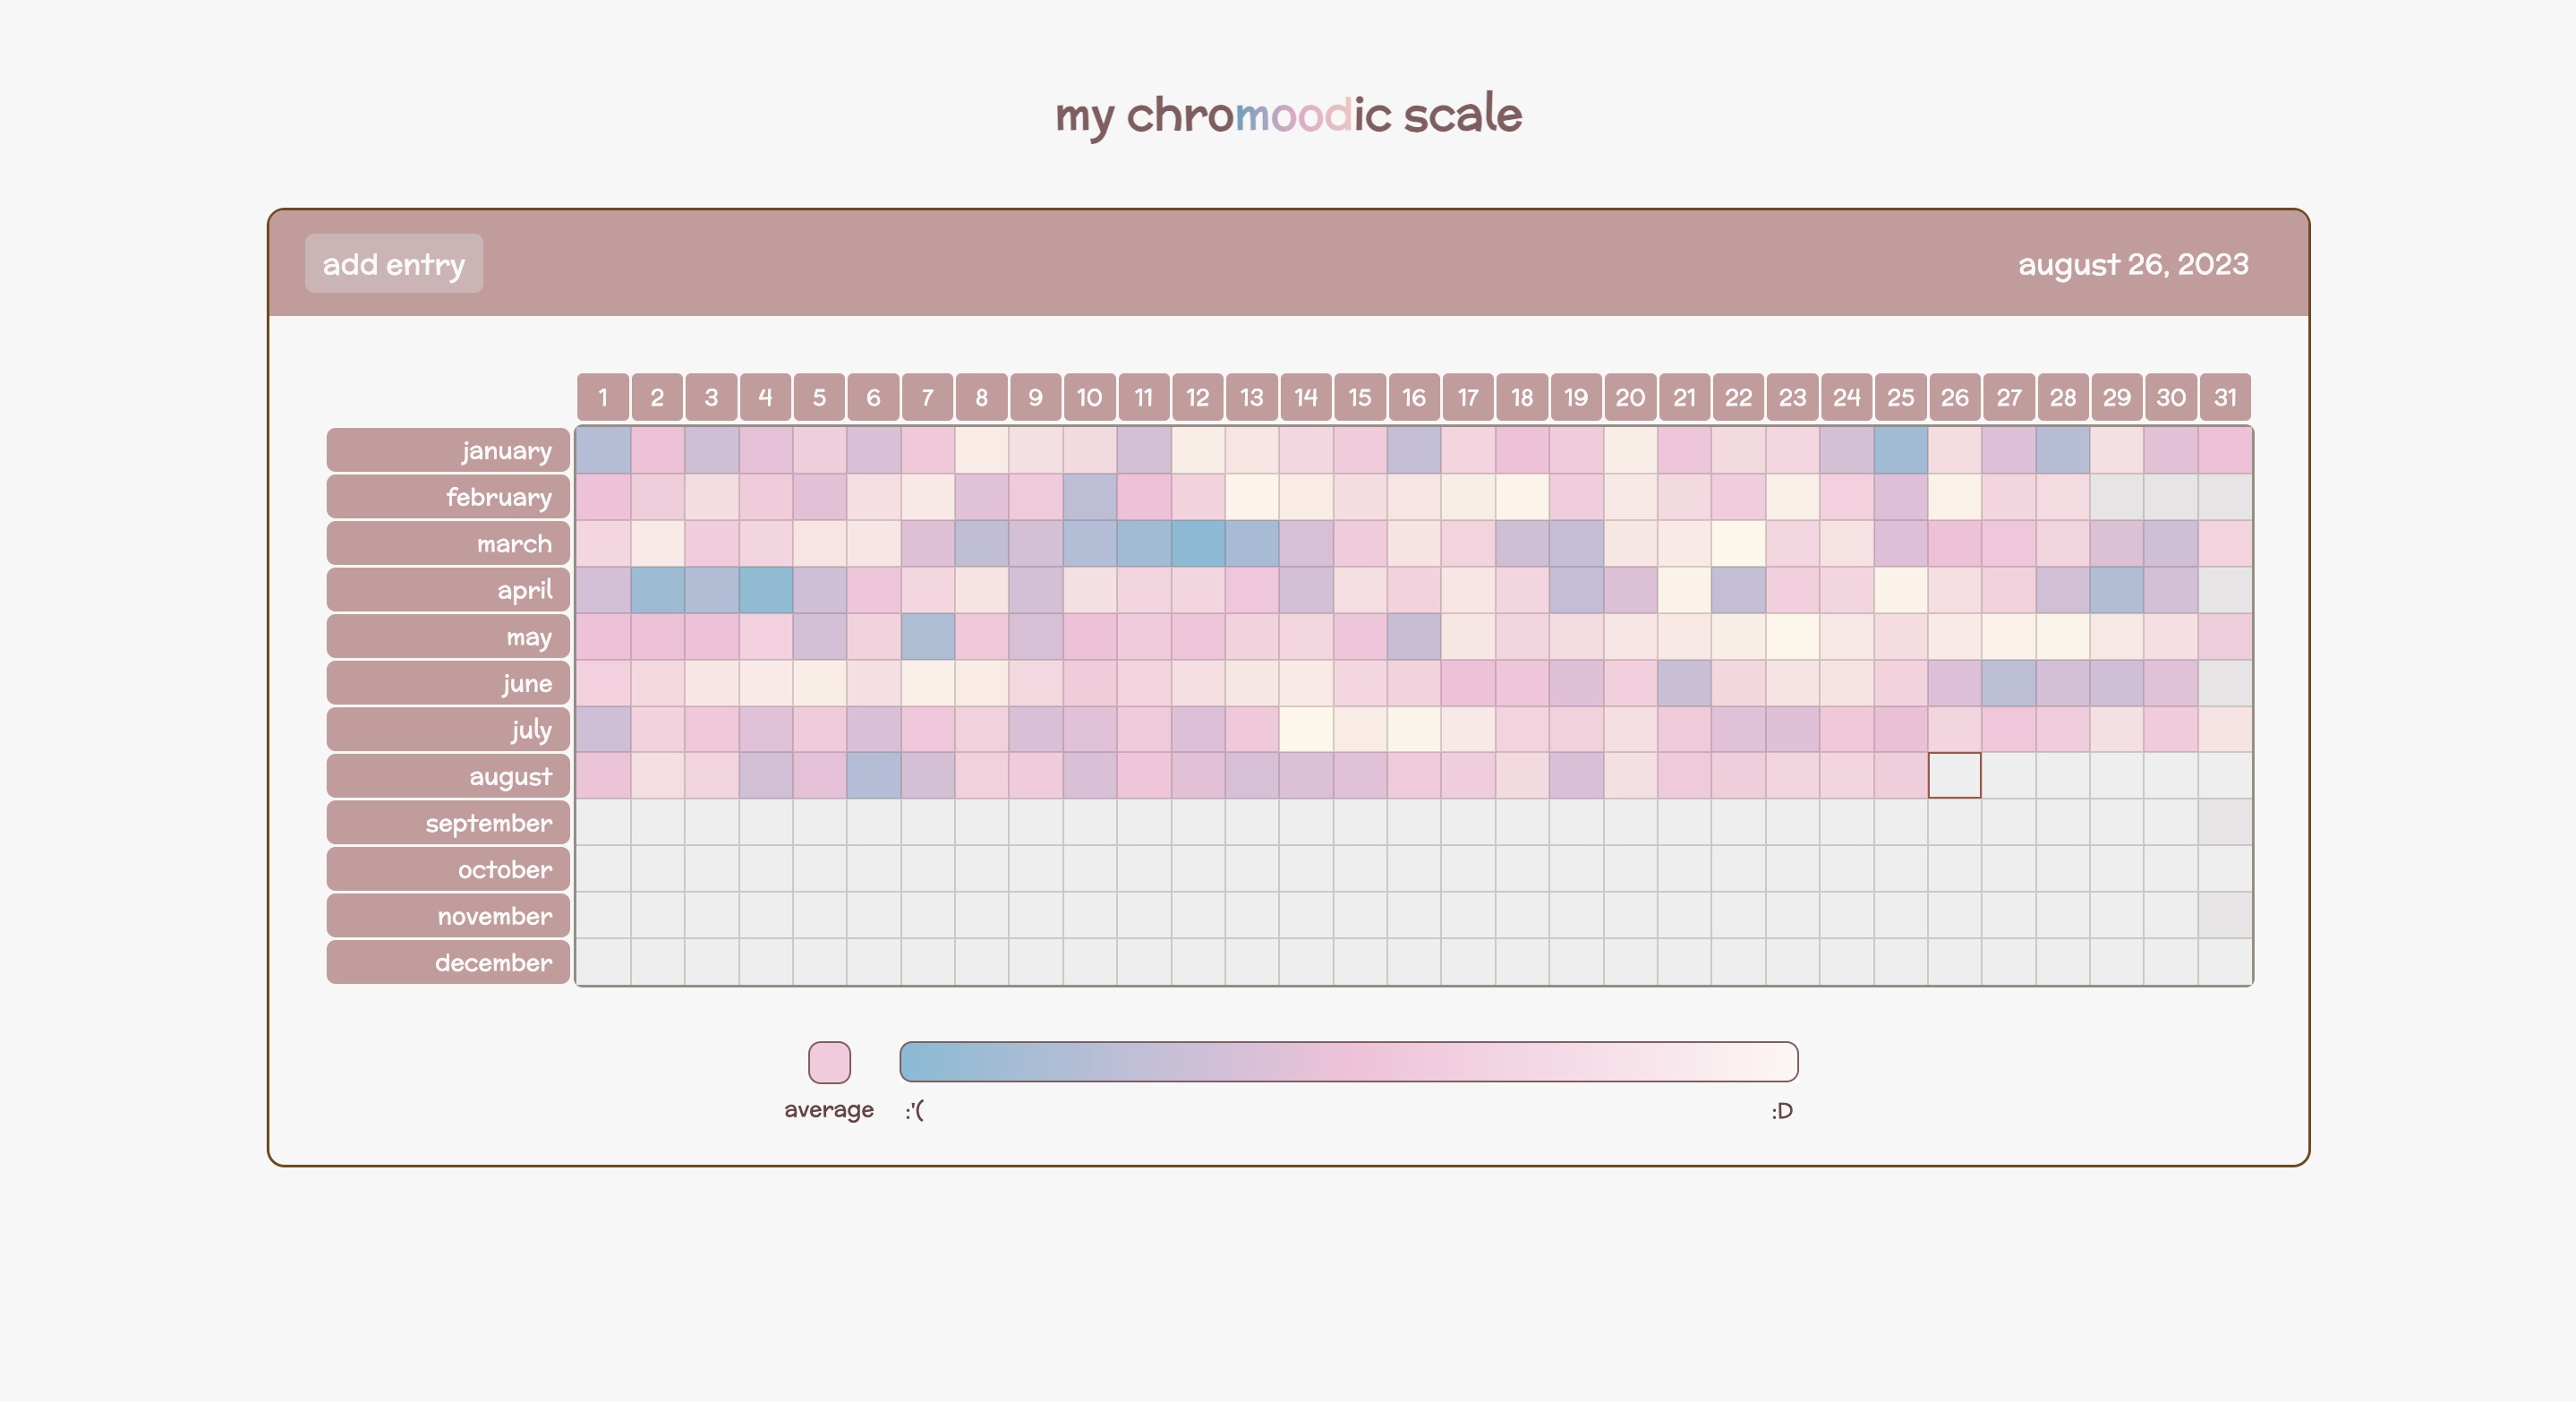
Webpage Calendar Display
-
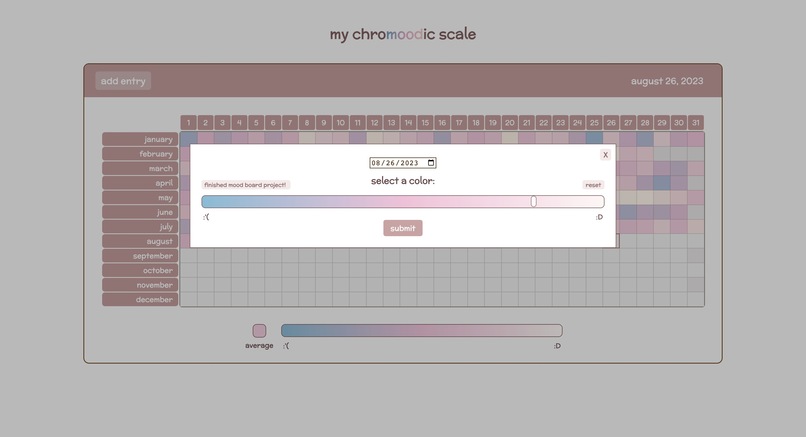
Add Entry Popup

Inspiration
Our inspiration stemmed from the desire to bring immediate awareness to journeys with mental health. Over the course of a year, it's common to experience periods of both happiness and challenges. An estimated 1 in every 5 U.S. adults struggle with some form of mental health, adding up to a total of 57.8 million individuals as of 2021.
Partially inspired by the concept of a diary or journal, we aimed to create a tool to visualize our mental health through an entire year. As the name of the project suggests, My Chromoodic Scale captures the evolving spectrum of moods one experiences, including each of the ups and downs. We hoped that this would encourage more self-reflection and introspection, allowing for a deeper understanding of one's emotions on a day-to-day basis. By offering a tool to tangibly visualize your emotional evolution, we aimed to spark more regular conversations about mental health, destigmatize the topic, and promote self check-ins, ultimately enhancing overall well-being.
What it does
My Chromoodic Scale is an interactive mood board that provides a visual representation of your emotional journey throughout the year. By depicting your daily moods as colors, the scale fills in the colors of your moods over the course of a year. The colors range from blue and purple, to pink and white. The cooler-tone shades are traditionally associated with more negative emotions, and we decided to keep that aspect to promote intuitiveness. However, we also took care to make the colors blend seamlessly overall to create a cohesive and aesthetic visualization, to avoid discouraging users from engaging with certain emotions.
The interface allows you to add an entry for each day, hopefully prompting users to reflect on their day as a whole and grow more closely in tune with their emotions. For each entry, a brief note can be written to provide a summary of the day and explain the reason behind that particular color choice. The box at the bottom holds a blended color, representing your overall mood color from the year so far.
In terms of storage, the entries are stored locally on the webpage so that it can be referenced throughout the year. We also included functionality for the site to scale properly on mobile and tablet webpages.
How we built it
We built our project using HTML, CSS, and JavaScript. We also used Figma to initially draft our design.
Challenges we ran into
During the development process, we encountered challenges with choosing the implementation for the board and determining suitable data structures for components of it. Additionally, we decided to use local storage to keep the inputted entries, which required us to consider carefully how to implement that as well.
Accomplishments that we're proud of
We're proud of effectively merging the technical aspects with the emotional intent of the project. As we are both relatively new to web development and using JavaScript, designing an interface that reflects our emotions while maintaining day-to-day usability felt like a significant accomplishment. Moreover, figuring out the math behind the color scale and converting these numbers into blended colors to display was particularly rewarding.
What we learned
We learned from the technical components and improved on our skills in JavaScript. For instance, we dynamically generated parts of the HTML using JavaScript to promote readability and scalability, as well as experimenting with certain CSS properties. We also deepened our understanding of color theory and blending, which allowed us to create a visually appealing and informative representation of emotions.
What's next for My Chromoodic Scale
In the future, we hope to implement features that allow users to set reminders for updating their daily moods, just like setting an alarm for 10 PM every night. We also plan to introduce more advanced data visualization options, such as monthly averages and trends.
Built With
- css
- figma
- html
- javascript

Log in or sign up for Devpost to join the conversation.