MX DataOps — A Tactile Data Pipeline Cockpit for Apache Airflow
DevStudio Logitech 2026 Hackathon Pitch
The Problem
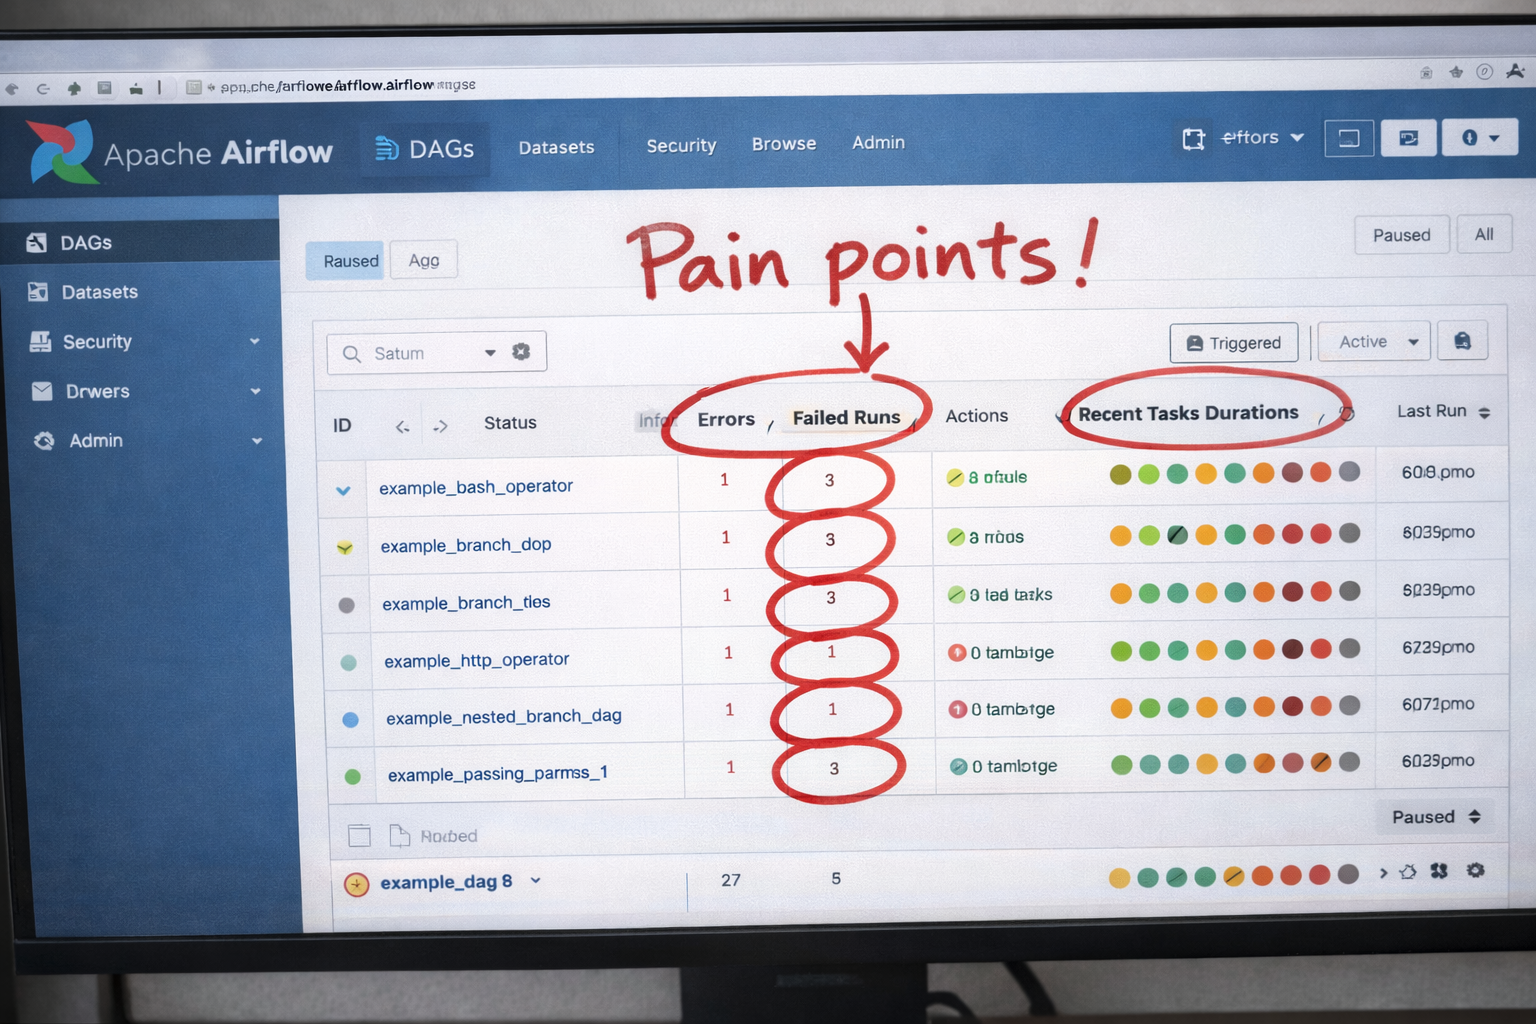
Data engineers live in browser tabs. Operating Apache Airflow across production environments means constantly switching between the Airflow UI, Grafana dashboards, Slack alerts, terminal windows, and log viewers to triage failures, backfill pipelines, check data quality, and chase schema drift.
This is slow, error-prone, and exhausting:
- Pipeline failures require manual log inspection across multiple tasks and DAG runs
- Schema changes in upstream sources break pipelines silently until downstream consumers complain
- Data quality issues (null spikes, row count drops, freshness violations) go unnoticed until a stakeholder opens a broken dashboard
- No single view of what's failing, what's stale, and what needs fixing right now
- High cognitive load from juggling Airflow UI, monitoring tools, source system consoles, and incident channels
The result: long mean-time-to-recovery (MTTR), stale data in warehouses, broken dashboards, missed SLAs, and engineer burnout.
The Solution
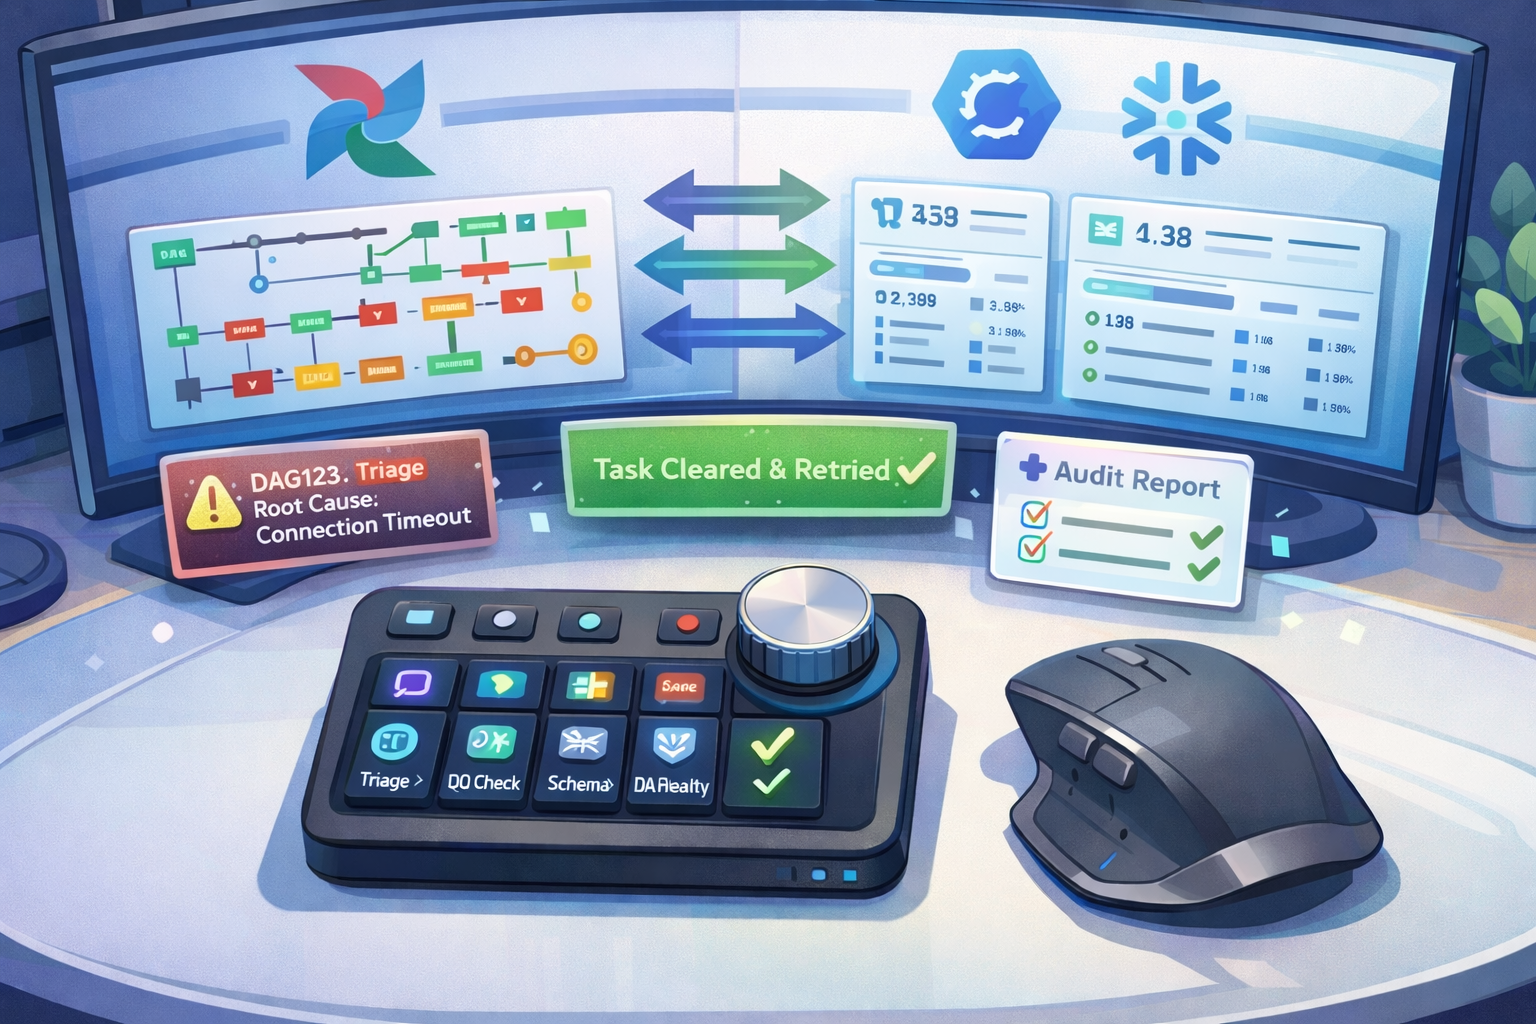
MX DataOps turns the Logitech MX Creative Console, MX Master 4, and Actions Ring into a physical operations cockpit for Apache Airflow.
Instead of clicking through the Airflow UI and tailing logs in terminals, engineers press a button to triage failures, turn a dial to review broken DAGs one by one, and confirm a fix with a single tap — all without leaving their editor or opening a browser.
MX DataOps makes data engineers more productive and reduces errors!
The system pairs two technologies:
- Claude Code Skills — reusable AI-powered workflow playbooks (structured prompts + scripts) that handle the heavy lifting: inspecting logs, classifying failures, computing data quality diffs, generating remediation plans, and applying guardrailed fixes via the Airflow REST API.
- Logitech Actions SDK — a plugin that maps MX hardware controls to those workflows, providing instant triggers, browsable results, and pipeline status at a glance.
Everything runs locally. No new web app. No Airflow plugin to install. The operator's machine calls the Airflow REST API directly, stores reports and state locally, and surfaces everything through hardware controls.
Features
Skill-based Automations (the brains)
| Skill | What it does | Trigger |
|---|---|---|
airflow-failure-triage |
Pulls failed DAG runs from the last 24h, inspects task logs, classifies root causes (connection timeout, schema change, OOM, bad data), generates a priority queue with suggested fixes | Every 6h or manual |
airflow-dq-reconcile |
Runs data quality checks across key tables (row counts, null rates, freshness, schema shape), compares against baselines, produces a mismatch report with table-level detail | Daily or manual |
airflow-schema-drift |
Compares current source schemas against the last known snapshot, detects added/removed/renamed columns, generates a migration plan as a patch file for human review | Daily or manual |
airflow-dag-doctor |
Analyzes DAG configuration for anti-patterns (missing retries, no alerting, excessive parallelism, deprecated operators), produces an improvement report | Manual only |
airflow-safe-fix |
Applies a guardrailed fix for a single DAG run: clear a failed task, update a connection/variable, trigger a targeted backfill — logs every action | Manual per DAG |
Every skill defaults to dry-run mode — it produces a plan and diff before touching anything. A "safe mode" toggle restricts unattended writes to task-clearing and variable updates only (no DAG code changes). Every run generates an audit report.
Hardware Controls (the hands)
| MX Control | Action |
|---|---|
| Actions Ring slice | Trigger any skill: "Failure Triage", "DQ Reconcile", "Schema Drift", "DAG Doctor" |
| Creative Console dial | Scroll through failure cards (DAG by DAG, task by task) |
| Creative Console button | Confirm "Apply Safe Fix" for the selected DAG run |
| Creative Console soft keys | Jump between sections: Failures / Data Quality / Schema / DAG Health |
| MX Master 4 gesture button | Open the DataOps Actions Ring profile |
| Status overlay (HUD) | Last triage time, failure count, DQ violations, SLA breaches, safe mode on/off |
Architecture at a Glance
flowchart TD
  OP[Data Engineer<br/>MX Master 4 / Creative Console / Actions Ring]

  OP -->|triggers workflow| SKILL_PATH
  OP -->|instant UX action| REG_PATH

  subgraph SKILL_PATH[Skill-based Automations]
    direction TB
    S1[airflow-failure-triage]
    S2[airflow-dq-reconcile]
    S3[airflow-schema-drift]
    S4[airflow-dag-doctor]
    S5[airflow-safe-fix]
  end

  subgraph EXEC[Skill Execution Layer]
    direction LR
    CLAUDE[Claude Code<br/>SKILL.md + scripts] --> DIFF[Analysis engine<br/>plan + guardrails]
    DIFF --> ART[Local artifacts<br/>reports / state.json]
  end

  subgraph APIS[Airflow & Data Infrastructure]
    direction LR
    AF[Airflow REST API]
    WH[Warehouse<br/>Snowflake / BigQuery / Redshift]
    META[Metadata<br/>connections / variables / pools]
  end

  S1 & S2 & S3 & S4 & S5 --> EXEC
  EXEC <-->|read/write| APIS
  EXEC --> ART

  subgraph REG_PATH[Regular Automations - Actions SDK]
    direction TB
    R1[Open Latest Report]
    R2[Browse Failure Cards]
    R3[Toggle Safe Mode]
    R4[Status Overlay HUD]
    R5[Run Now triggers]
  end

  R1 & R2 & R4 -->|reads local files| ART
  R3 -->|toggles| CFG[config.json]
  R5 -.->|invokes skill| SKILL_PATH
Why Logitech MX Creative + Skills Makes Sense
1. Hardware solves the interface problem
Airflow automation already exists — but it lives behind the Airflow UI, Grafana, and Slack bots. The MX Creative Console and Actions Ring bring those workflows to the engineer's fingertips. A dial to scroll through failed DAGs, a button to clear and retry a task, a ring slice to trigger a full triage. No context switching. No tab hunting.
2. Skills solve the reliability problem
Ad-hoc airflow dags trigger commands and manual log inspection are fragile and inconsistent. Claude Code Skills package each operational workflow as a structured, versioned playbook with built-in guardrails (dry-run defaults, safe mode, audit trails). They're repeatable, schedulable, and reviewable — the same triage process every time, whether it's a senior engineer or someone on-call for the first time.
3. Together they create a new interaction pattern
No existing tool combines physical hardware controls with AI-powered pipeline operations. This isn't "AI in the Airflow UI" or "a better monitoring dashboard." It's a tactile operations surface where the engineer stays in flow — reviewing failures, approving fixes, and acting through muscle memory instead of clicking through DAG run logs across browser tabs.
4. Local-first means zero deployment friction
Everything runs on the engineer's machine. No SaaS subscription. No Airflow plugin to install or upgrade. No changes to the production Airflow deployment. Just an API endpoint, a Claude Code instance, and MX hardware. This makes it accessible to any team running Airflow — cloud-managed (Astronomer, MWAA, Cloud Composer) or self-hosted.
5. The market gap is real
AI tools for Airflow are emerging fast — Astronomer's AI SDK, Vayu copilot, DAGForge, airflow-chat, MCP servers — but they're all UI-centric or chat-centric. Nobody has built a hardware-native pipeline operations layer. MX DataOps positions Logitech MX devices as the physical interface for AI-powered data engineering, not just creative workflows.
Prior Art & Ecosystem
The data engineering community is actively building pieces of this pattern:
- Astronomer Airflow AI SDK —
@task.llmand@task.agentdecorators for orchestrating LLM reasoning directly within DAGs, including multi-agent pipelines with human-in-the-loop steps. - Vayu: The Airflow Copilot — Presented at Airflow Summit 2025. A conversational copilot with a Troubleshooting Agent (inspects logs, configs, runtime state), a Pipeline Mechanic Agent (suggests and commits code fixes), and a DAG Manager Agent (triggers runs conversationally). Built on Google ADK + a custom Airflow MCP server. Open-sourced.
- airflow-chat — A plugin embedding a conversational AI interface directly in the Airflow UI, backed by an Airflow MCP server. Inspect DAGs, query task states, and operate pipelines in natural language.
- mcp-server-apache-airflow — A full MCP server wrapping Airflow's REST API, enabling AI agents to manage DAGs, runs, tasks, variables, connections, and pools programmatically.
- DAGForge — AI-powered DAG builder: describe pipelines in plain English, get production-ready Airflow code with retries, alerts, and best practices.
None of these combine AI-powered operations with a physical hardware control surface. MX DataOps fills that gap.
Demo Flow (Hackathon MVP)
- Press Actions Ring → "Failure Triage" → skill queries Airflow REST API, inspects logs, classifies failures, generates priority report
- Turn Creative Console dial → browse failure cards DAG by DAG (root cause, suggested fix, severity)
- Press "Apply Safe Fix" → clears the failed task and triggers a retry (guardrailed, logged)
- Press "Open Latest Report" → audit trail shows what failed, why, and what was fixed
Time from trigger to actionable triage: under 15 seconds.
Build Plan
| Day | Deliverable |
|---|---|
| Day 1 | Implement core skills + scripts (Airflow REST API client, log parser, failure classifier, DQ checker), local report generation |
| Day 2 | Actions SDK plugin: map device controls to skill triggers, dial browsing of failure/DQ cards, report opening |
| Stretch | Schema drift detection against Snowflake/BigQuery INFORMATION_SCHEMA, DAG Doctor anti-pattern analysis |
Platform Note
The Logi Actions SDK (Node.js) currently runs on Windows only; macOS support is coming soon. Claude Code runs natively on Windows, making it a natural fit for the Actions SDK today. All skills and API scripts are cross-platform — once macOS Actions SDK support ships, the stack works there too with zero changes.
References
Built With
- airflow

Log in or sign up for Devpost to join the conversation.