inspiration - I have always been fascinated by music—not just listening to it, but understanding what makes certain songs popular while others go unnoticed. I noticed that some tracks perform exceptionally well on Spotify but don’t get the same attention on YouTube, and vice versa. This made me curious about the factors that influence a song’s popularity, such as genre, artist, release year, or even audio features like energy and danceability. I wanted to create a tool that could bring these insights to life, allowing anyone to explore and compare music trends across platforms in an interactive and visual way. This curiosity and desire to uncover hidden patterns in music streaming became the inspiration for Music Streaming Analytics.
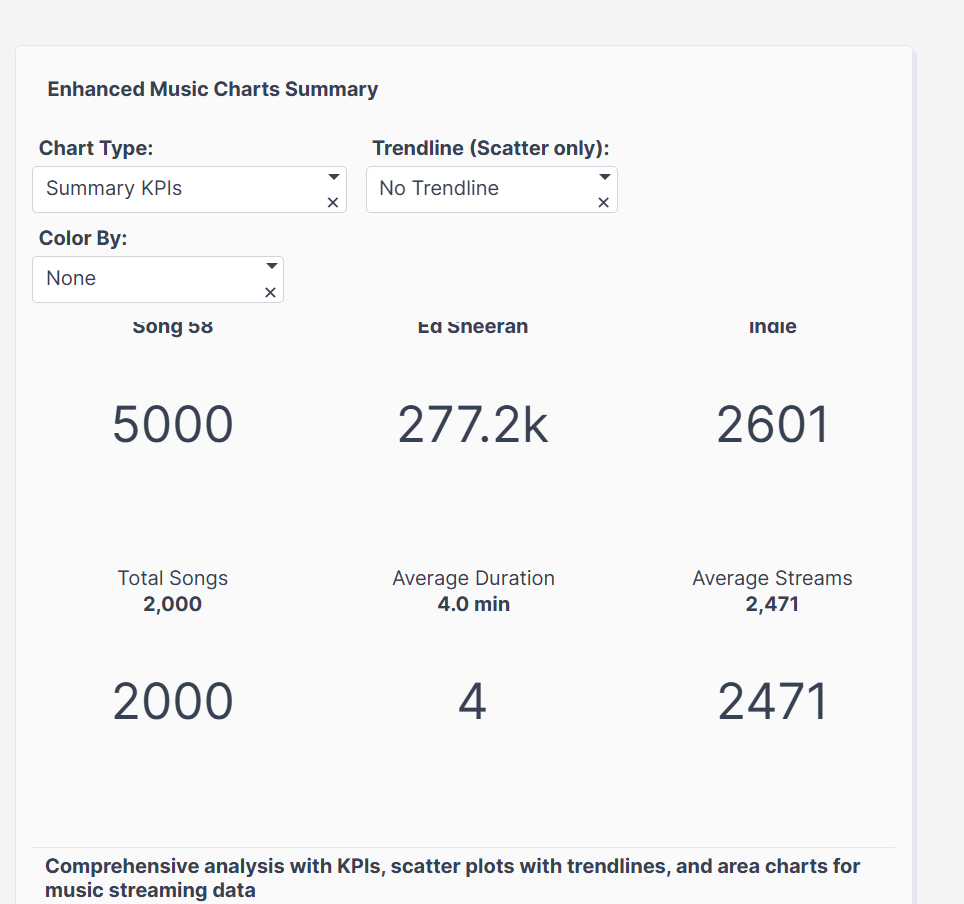
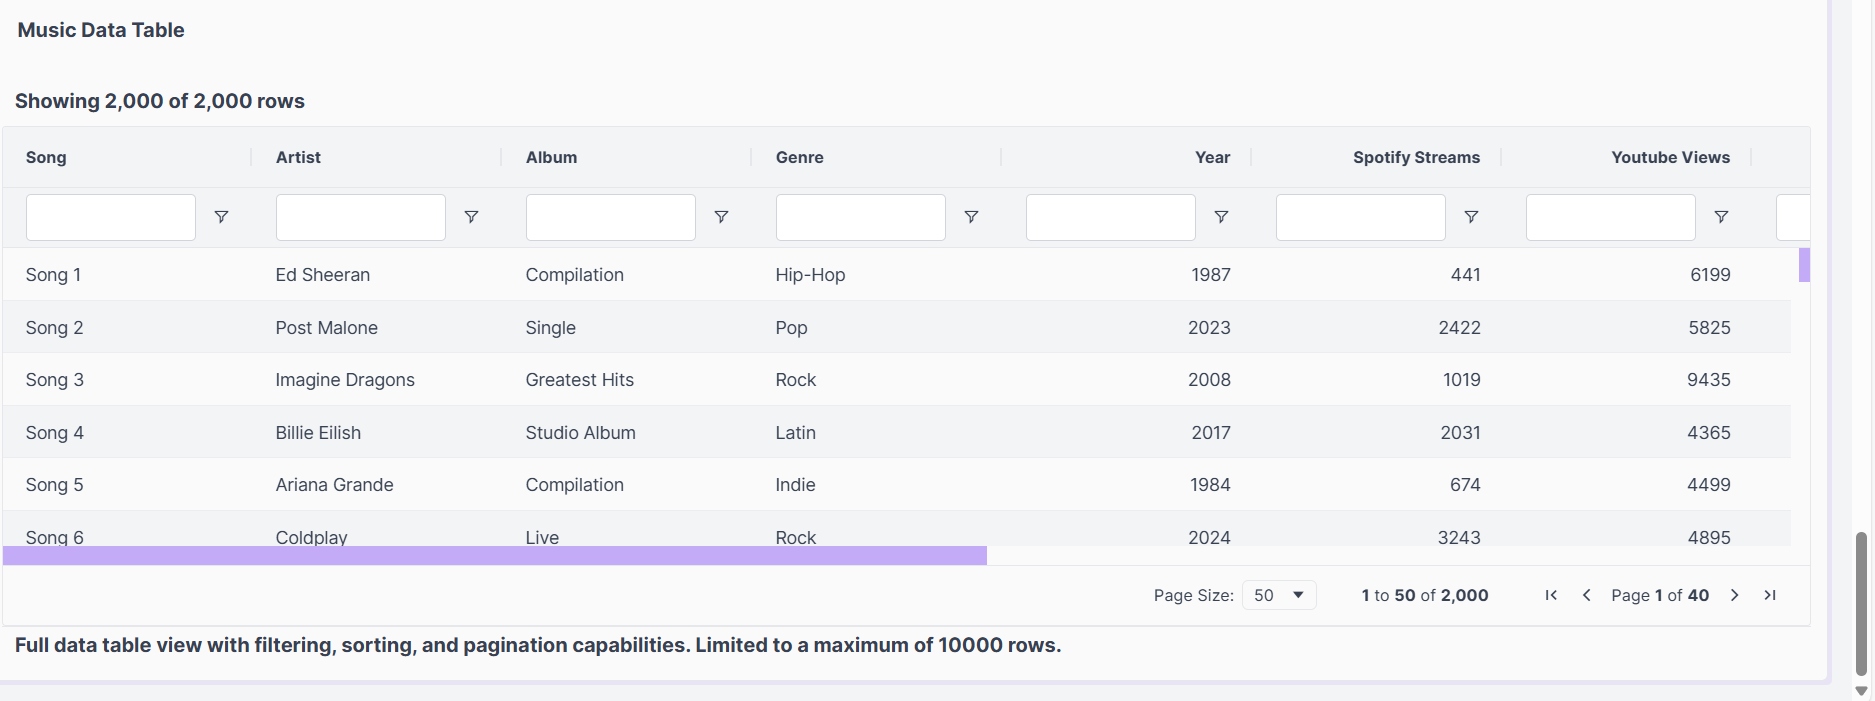
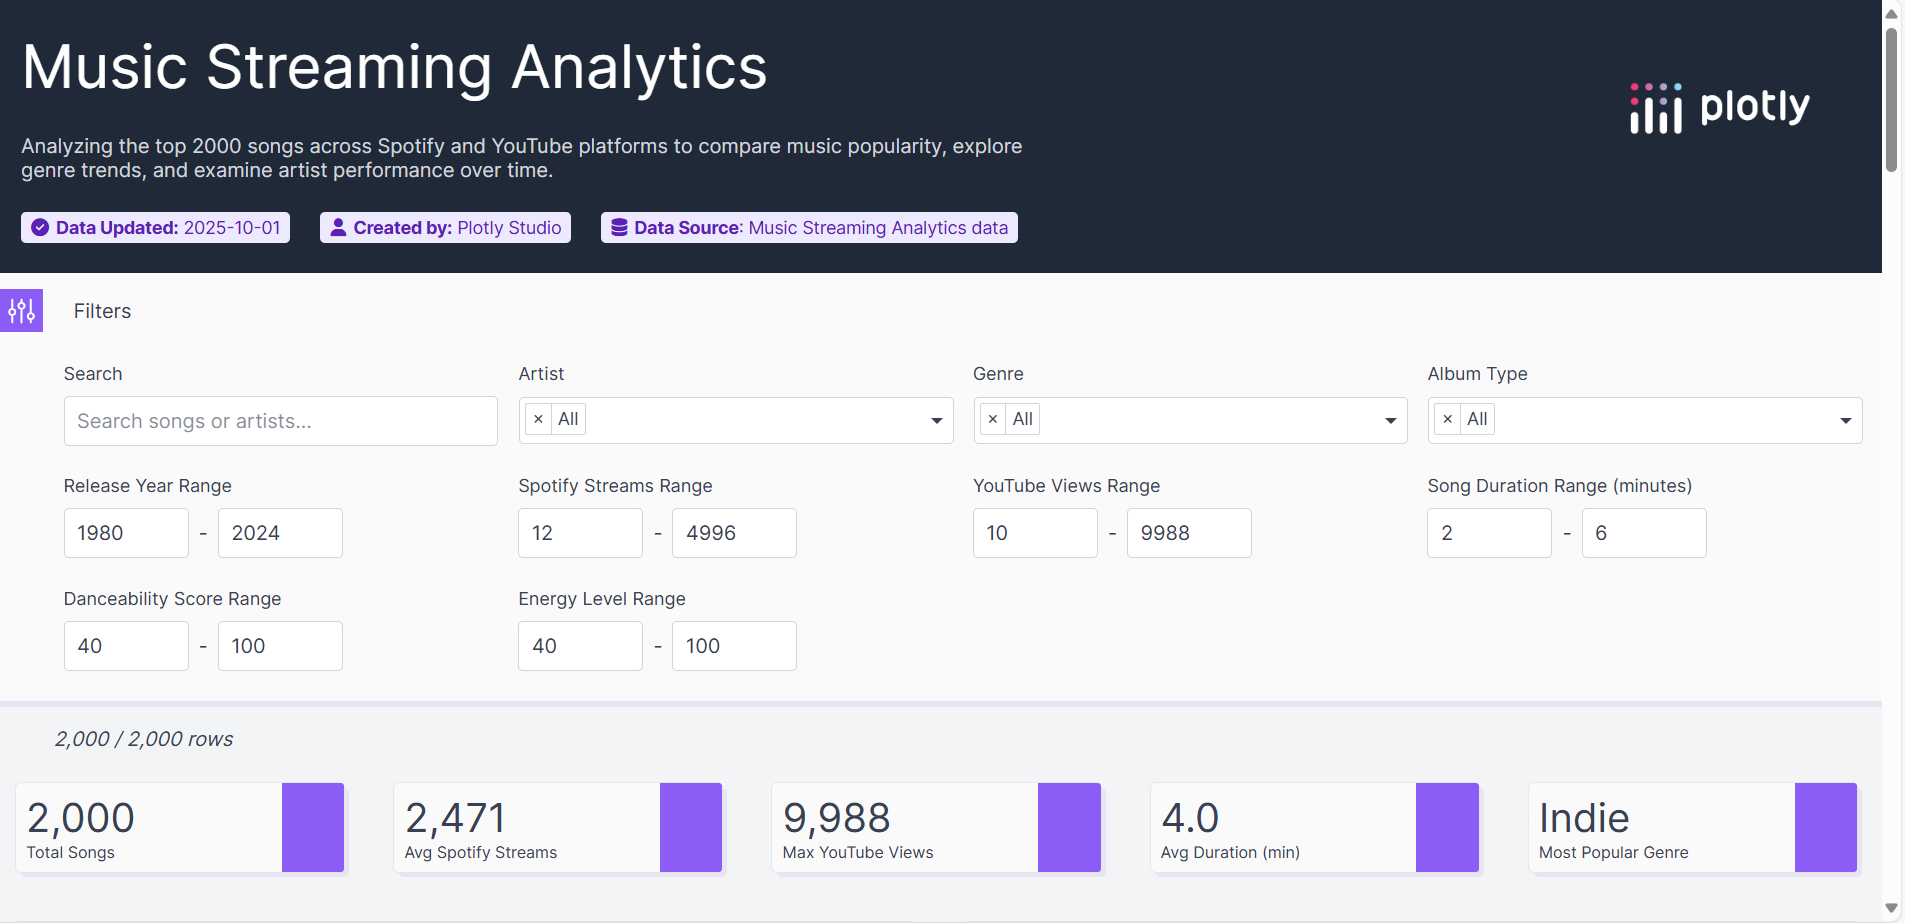
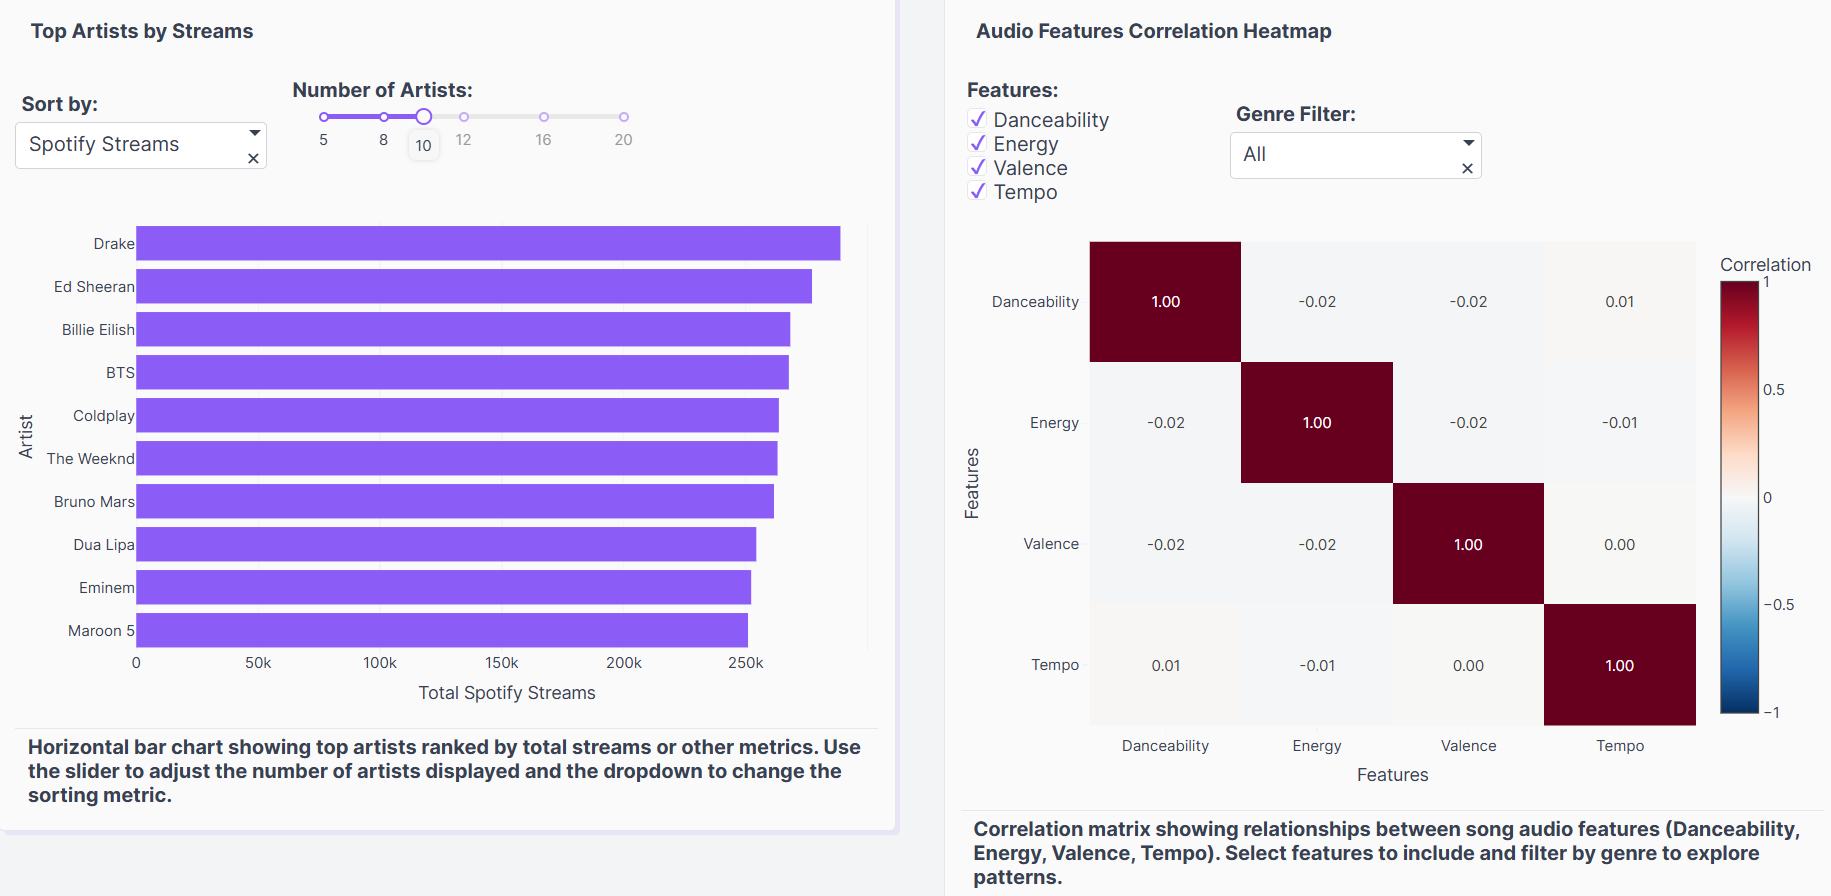
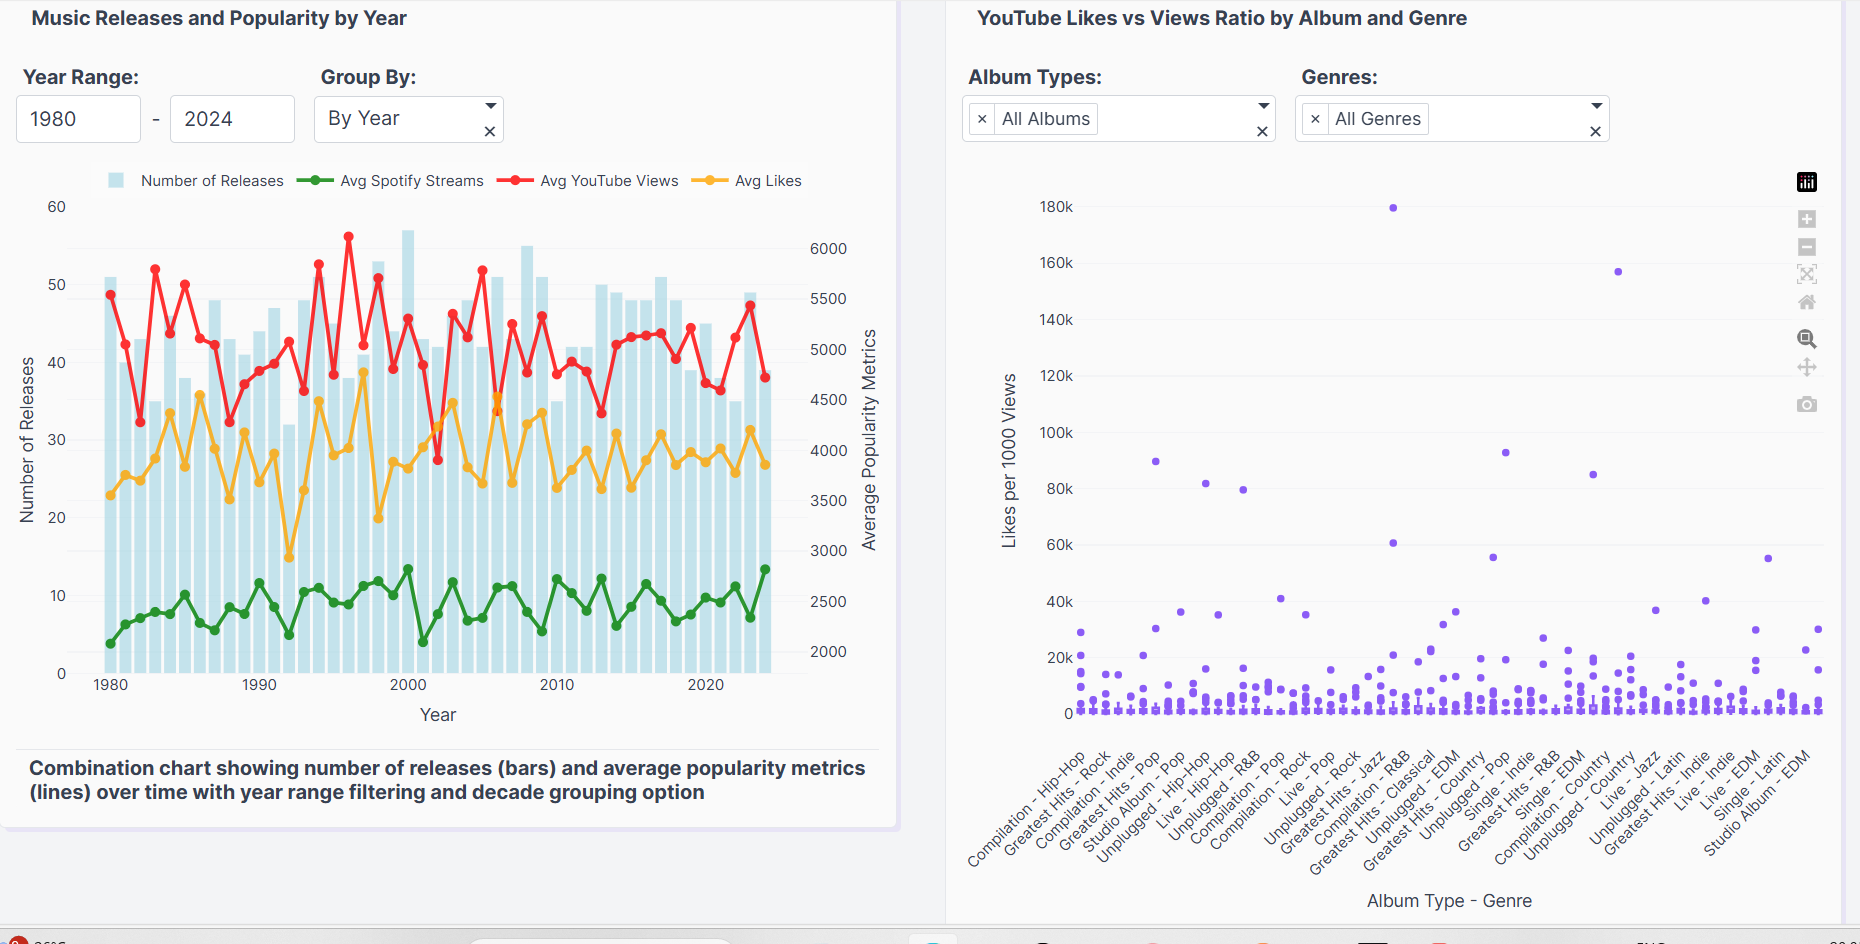
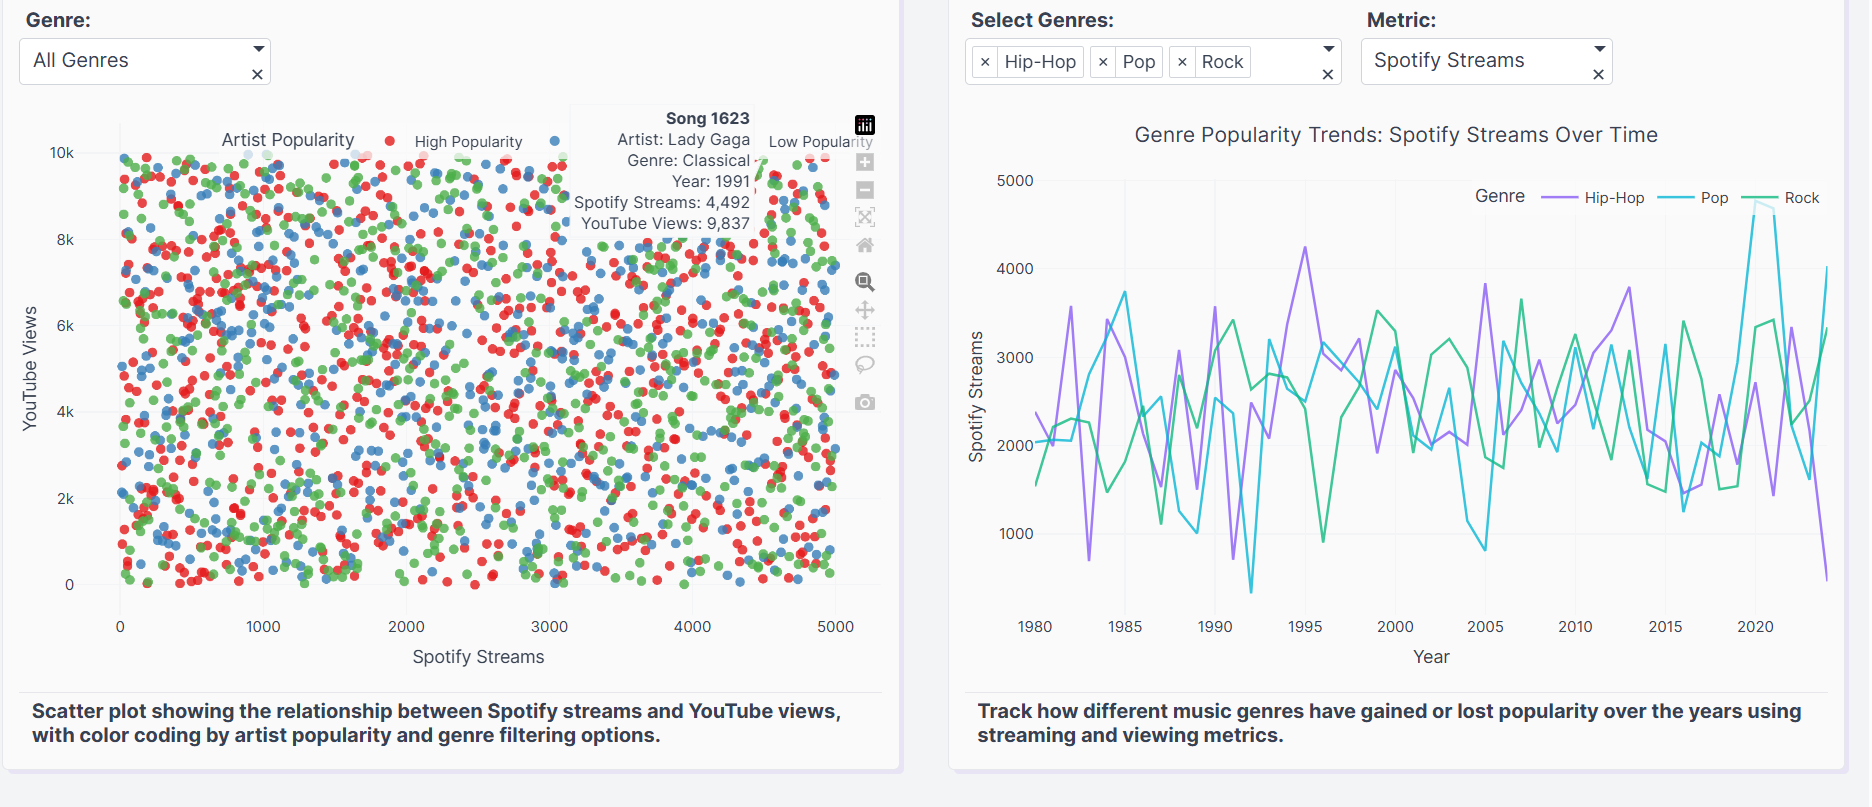
What it does-Music Streaming Analytics is an interactive dashboard that analyzes the top 2,000 songs on Spotify and YouTube. It lets users compare streams and views, explore trends across genres, track top artists, and examine how audio features like danceability, energy, and valence relate to popularity. With interactive charts, filters, and sliders, the app allows users to drill down into specific artists, album types, release years, and song characteristics, providing insights into music trends and listener behavior over time.
How we built it-We built Music Streaming Analytics by first collecting and cleaning data from Spotify and YouTube for around 2,000 songs, including streams, views, artist info, genres, release years, album types, and audio features like danceability, energy, valence, and tempo. Next, we created interactive visualizations such as scatter plots, line charts, bar charts, heatmaps, combination charts, and box plots to explore trends and correlations. We added filters, sliders, and dropdowns so users could customize their view by artist, genre, release year, album type, or audio features. Finally, we designed a modern, vibrant interface with a purple and teal theme, gradient accents, and contemporary typography to make the dashboard visually engaging and intuitive to navigate.
Challenges we ran into-We faced a few challenges while building Music Streaming Analytics. Spotify and YouTube data had different structures, so we had to normalize it for fair comparisons. Streams and views varied greatly, requiring logarithmic scaling to make charts readable. Making interactive filters and sliders work smoothly across multiple charts was tricky, and designing a clean, intuitive dashboard took several iterations. These challenges helped us improve our skills in data handling, interactivity, and user-focused design.
Accomplishments that we're proud of-We’re proud of creating a fully interactive and visually engaging dashboard that makes exploring music trends fun and insightful. Despite working with large and messy datasets, we successfully compared Spotify and YouTube metrics, uncovered patterns across genres and artists, and visualized complex audio feature correlations. We also built a user-friendly interface with filters, sliders, and dropdowns that allow anyone to explore data in multiple ways. Beyond the technical achievements, we’re proud that our project tells a story about music, popularity, and listener behavior in a way that is both informative and engaging.
What we learned-Through building Music Streaming Analytics, we learned a lot about data analysis, visualization, and interactive design. We gained hands-on experience handling large, messy datasets and learned how to normalize and scale data for fair comparisons. We also improved our skills in creating interactive charts, filters, and dashboards that are both functional and visually appealing. Beyond the technical skills, we learned how to tell a story with data, uncover meaningful patterns in music trends, and design a user-friendly experience that makes complex information easy to explore.
What's next for Music Streaming Analytics-For the future, we plan to expand Music Streaming Analytics by including more platforms like Apple Music, SoundCloud, and TikTok to get a broader view of music trends. We also want to add predictive analytics to forecast a song’s popularity based on its features and historical trends. Other ideas include personalized recommendations, sentiment analysis of lyrics, and enhanced mobile-friendly visualizations. Ultimately, our goal is to make the app an even more powerful and engaging tool for music enthusiasts, artists, and industry professionals to explore and understand music data in depth.
Built With
- and-deliver-a-user-friendly
- and-filters.-data-was-collected-from-the-spotify-api-and-youtube-data-api
- and-matplotlib/seaborn-for-data-cleaning-and-visualization.-for-interactive-charts-and-dashboards
- and-tools-to-build-a-robust-and-interactive-dashboard.-we-used-python-for-data-processing-and-analysis
- and-we-stored-and-managed-datasets-using-csv-files.-for-deployment-and-accessibility
- apis
- create-interactive-visualizations
- experience.for-music-streaming-analytics
- for-music-streaming-analytics
- frameworks
- leveraging-libraries-like-pandas
- numpy
- sliders
- we-used-a-combination-of-programming-languages
- we-used-heroku-to-host-the-app-online.-the-combination-of-these-technologies-allowed-us-to-process-large-datasets
- we-used-plotly-and-dash
- web-based
- which-allowed-us-to-add-dropdowns