-
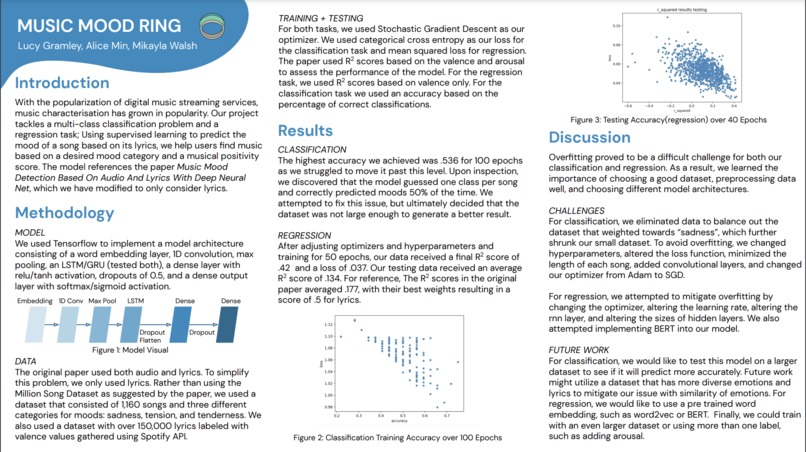
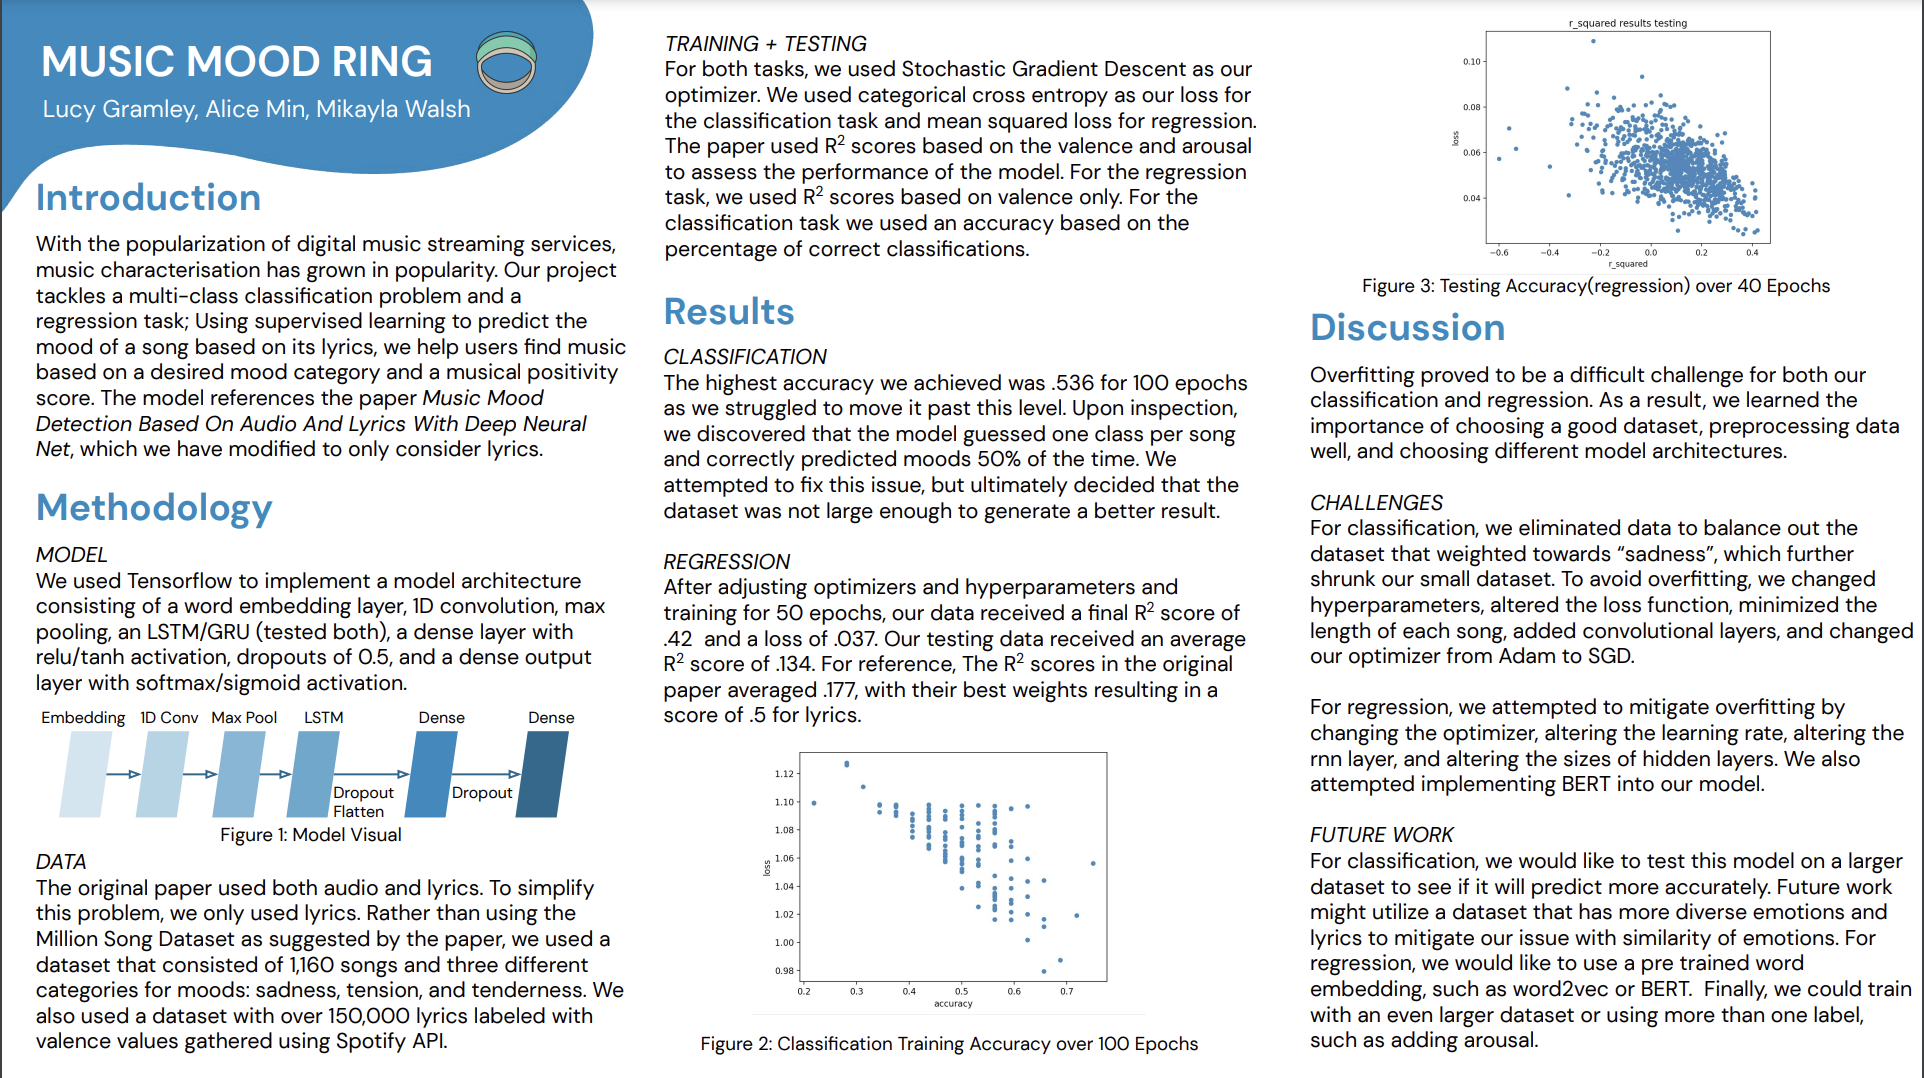
Project Poster
-
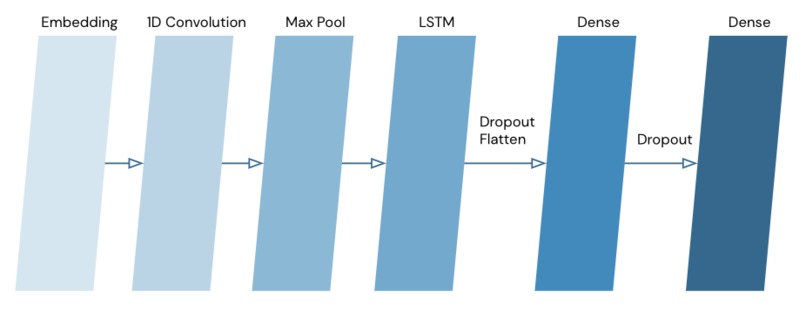
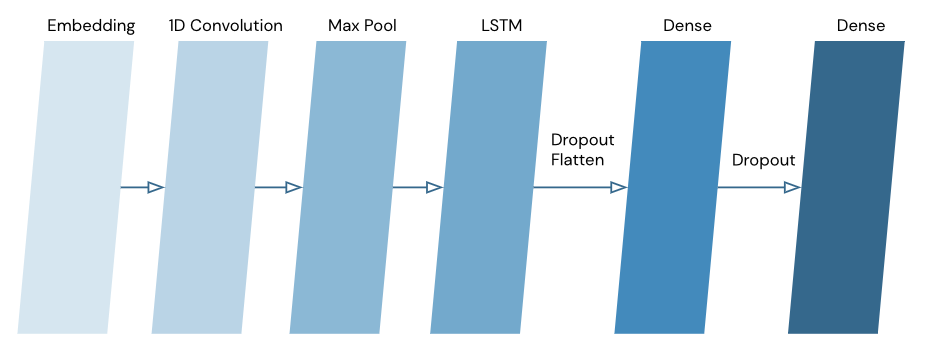
Figure 1: Model Architecture
-
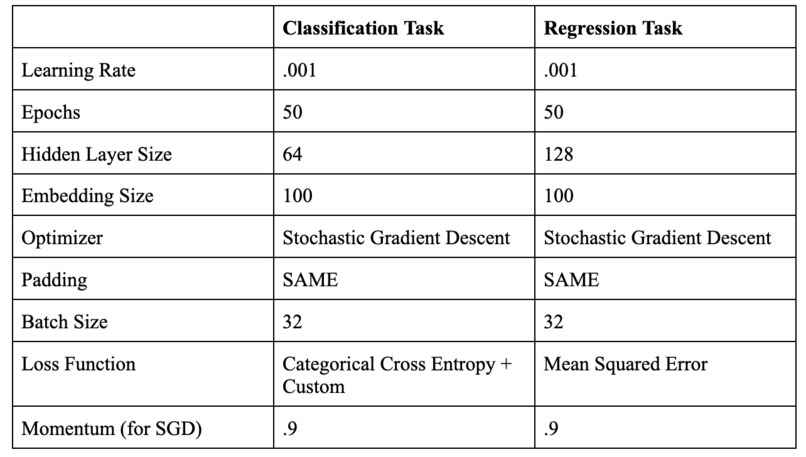
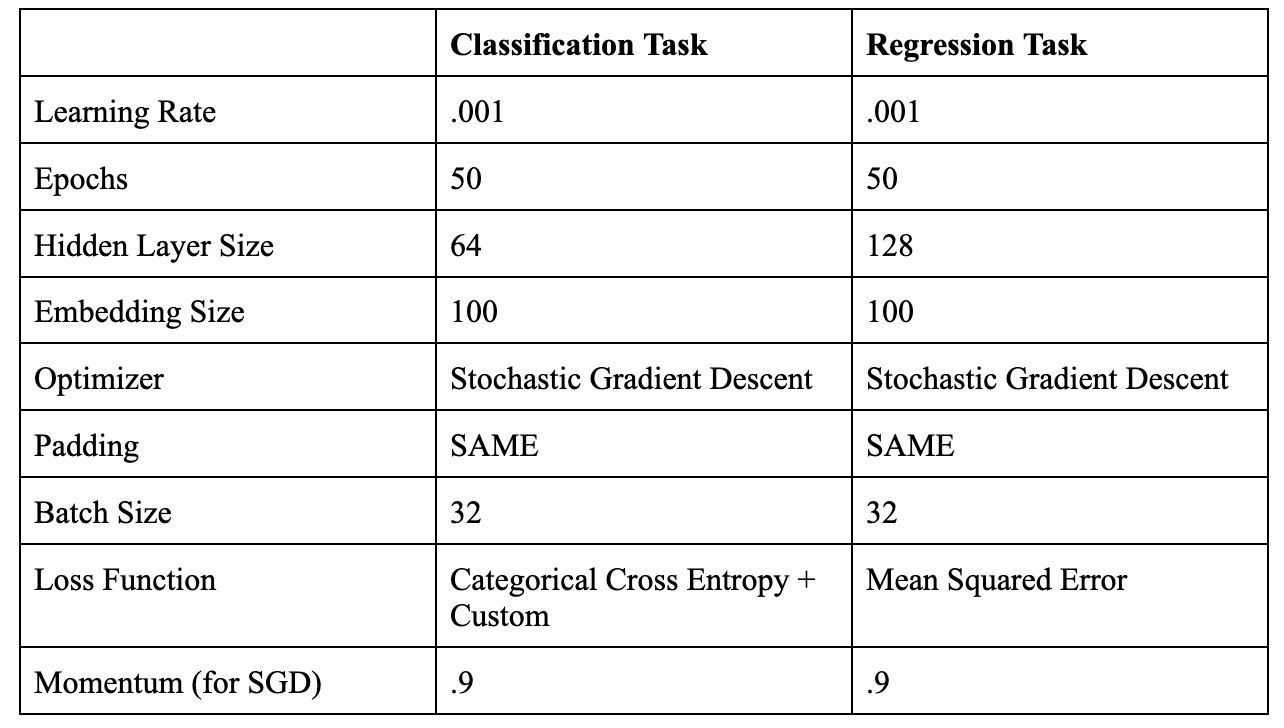
Figure 2: Model Hyperparameters
-
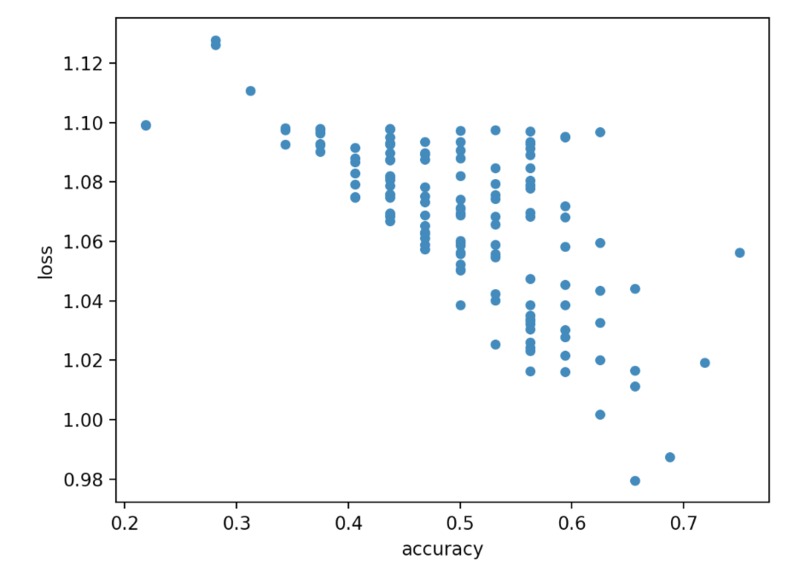
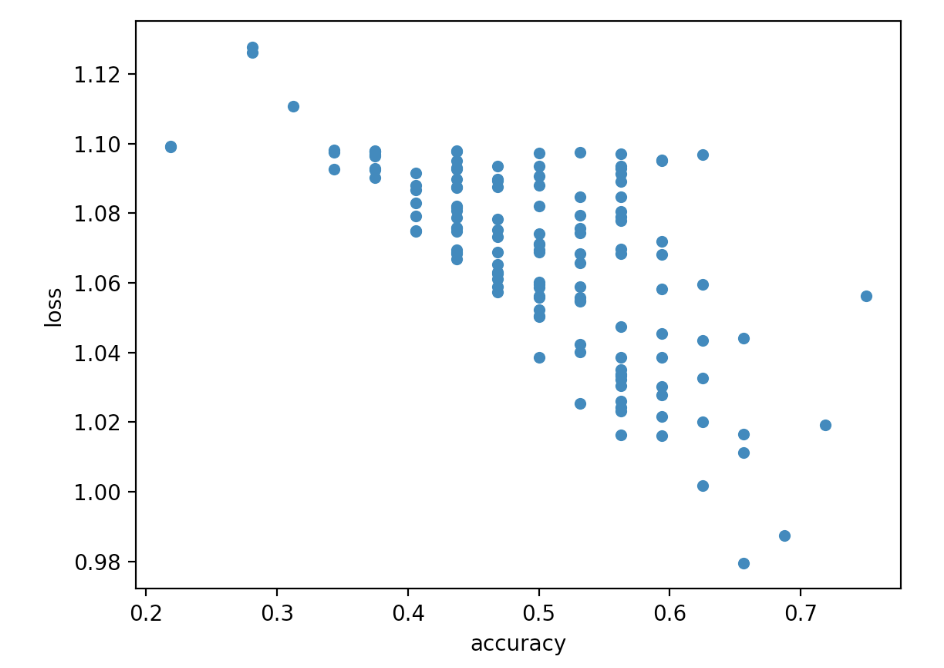
Figure 3: Classification Training Accuracy over 100 Epochs
-
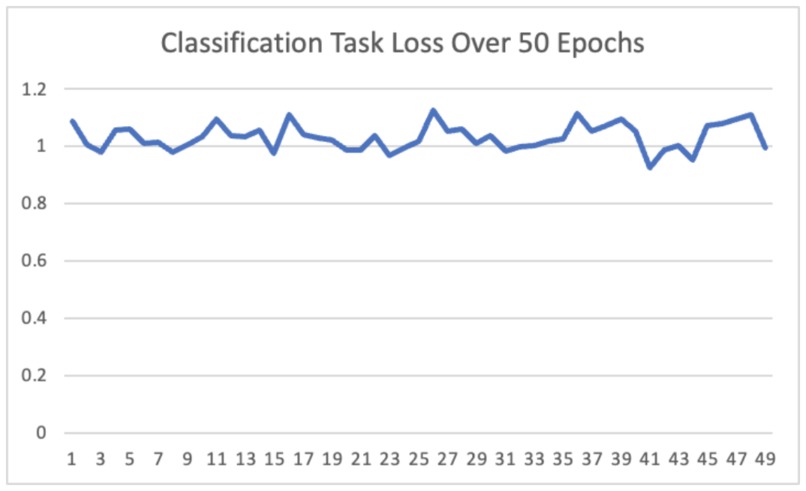
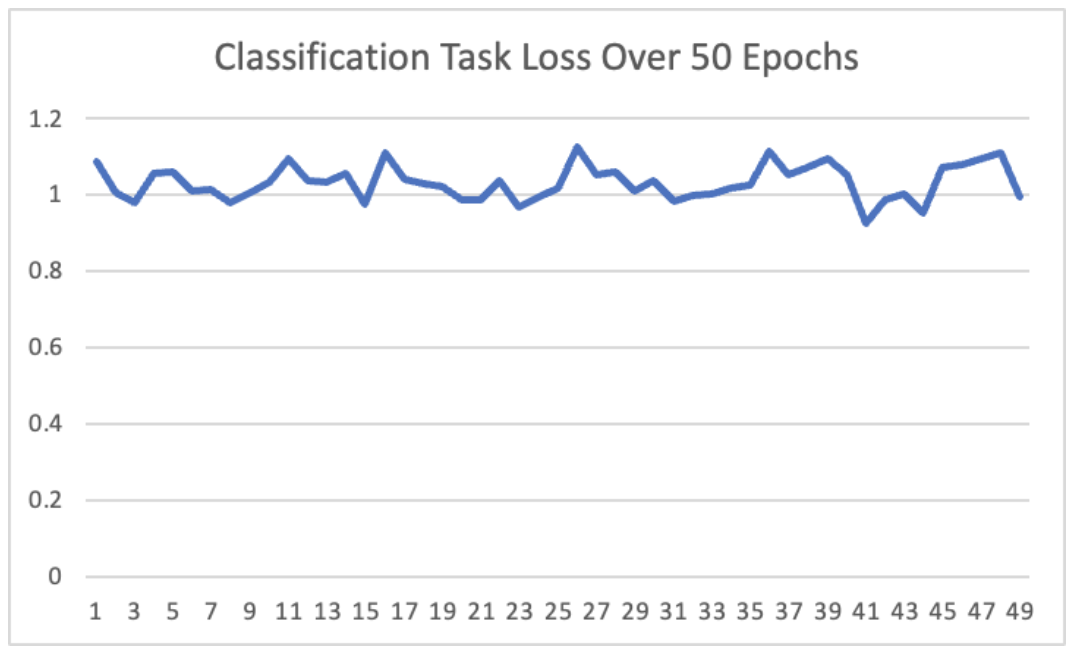
Figure 4: Classification Training Loss over 50 Epochs
-
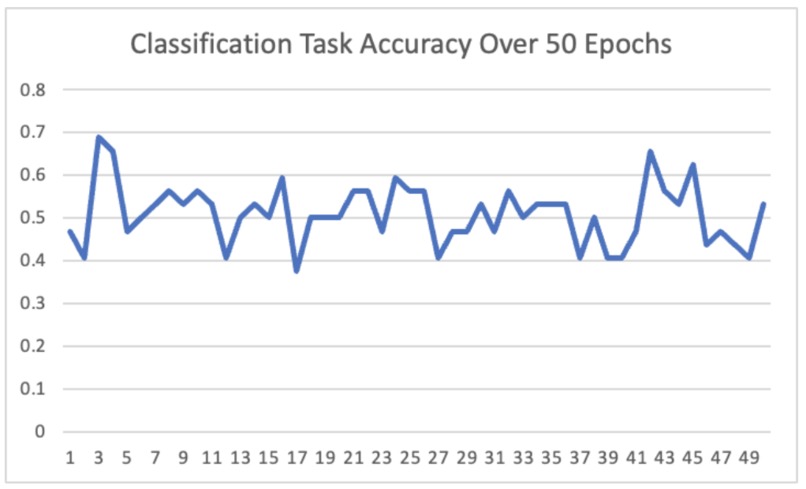
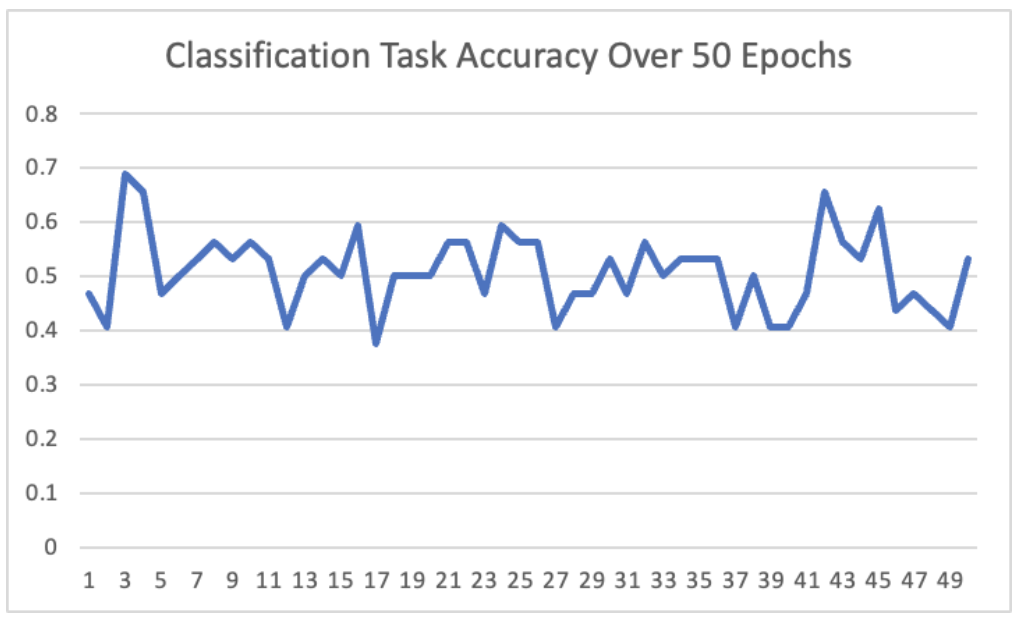
Figure 5: Classification Training Accuracy over 100 Epochs
-
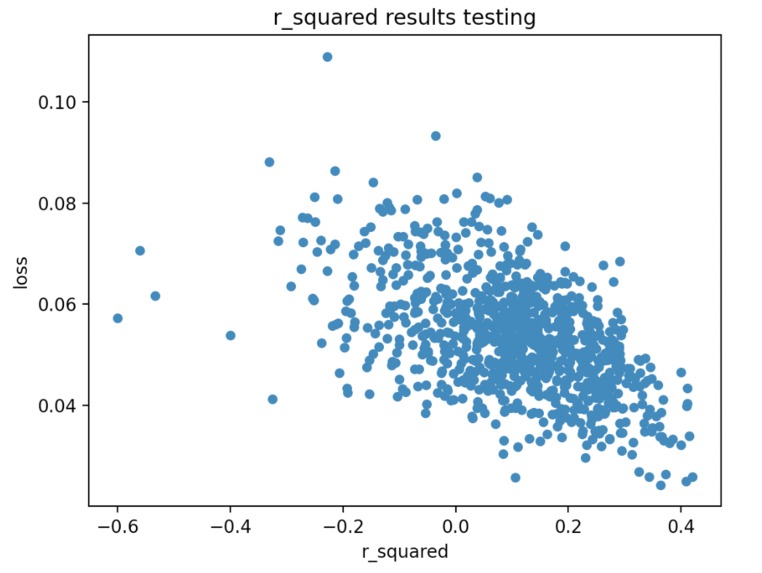
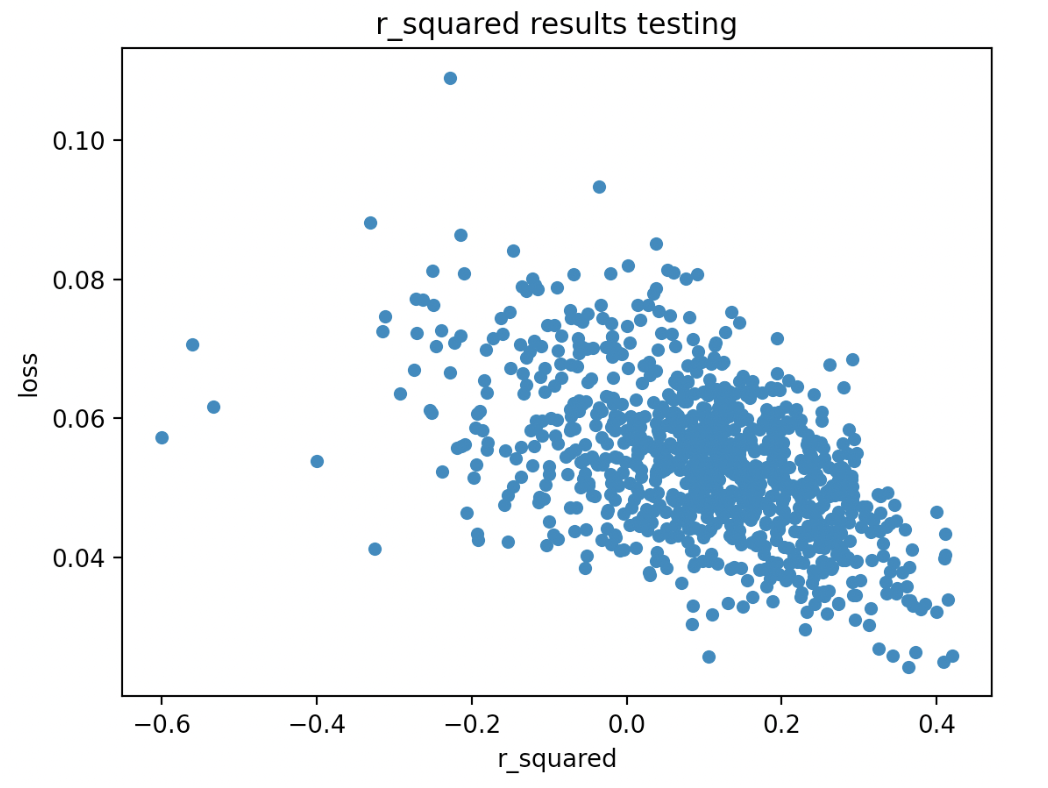
Figure 6: Testing Accuracy (Regression) over 50 Epochs
-
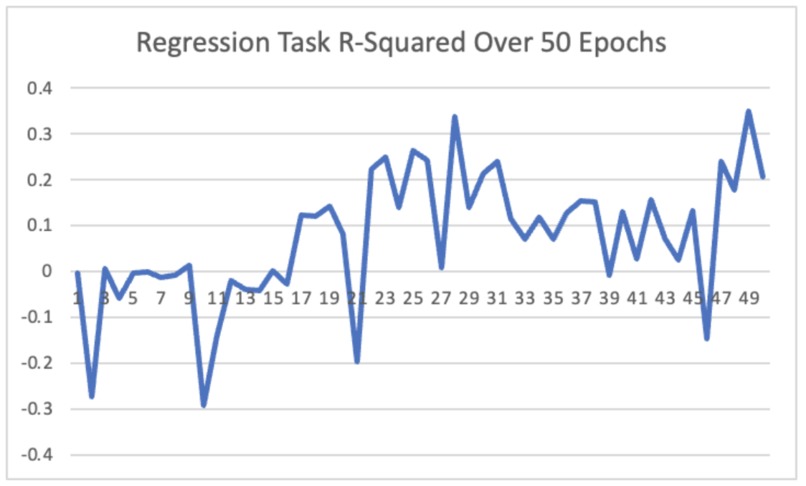
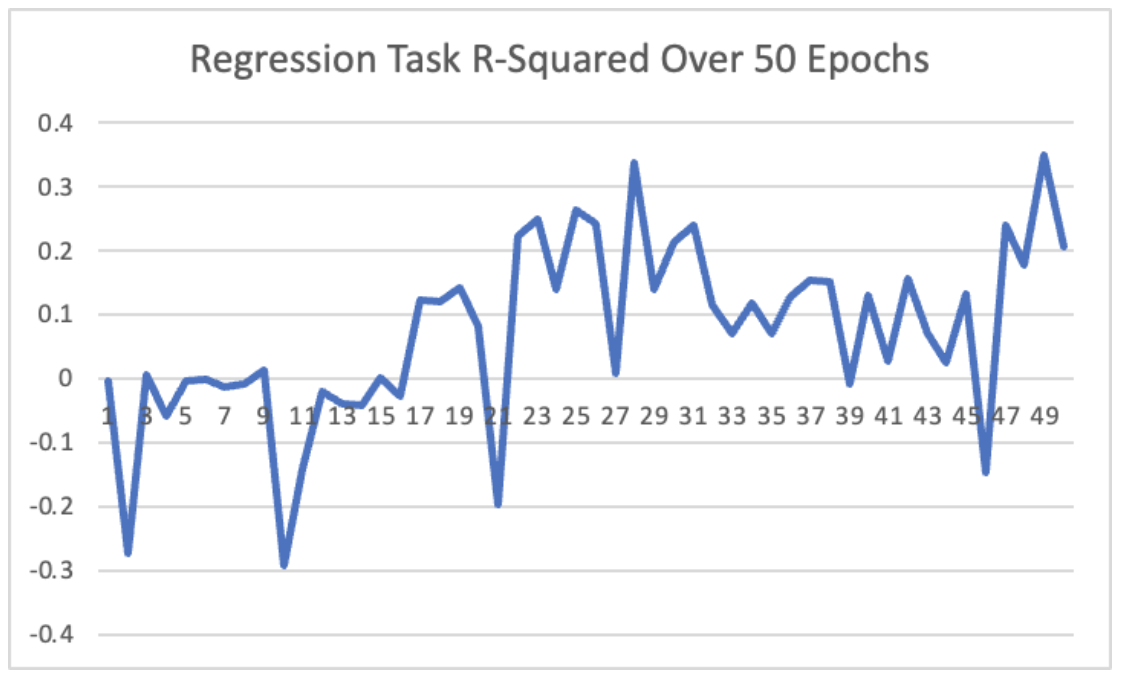
Figure 7: Training Accuracy/R2 (regression) over 50 Epochs
-
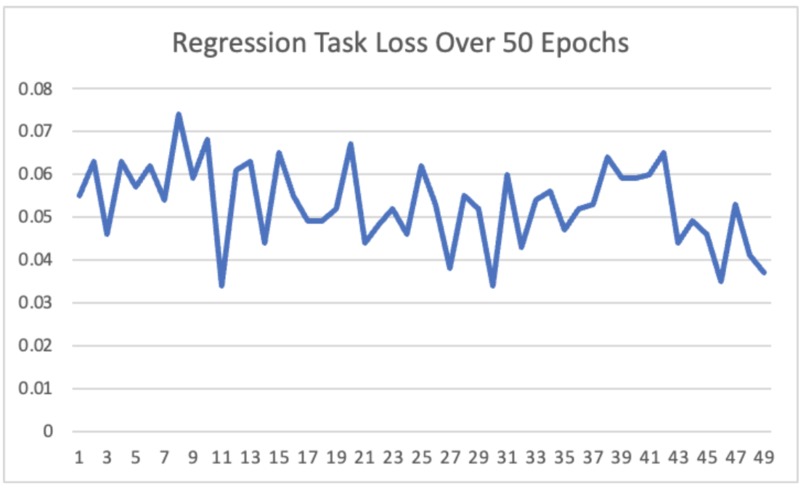
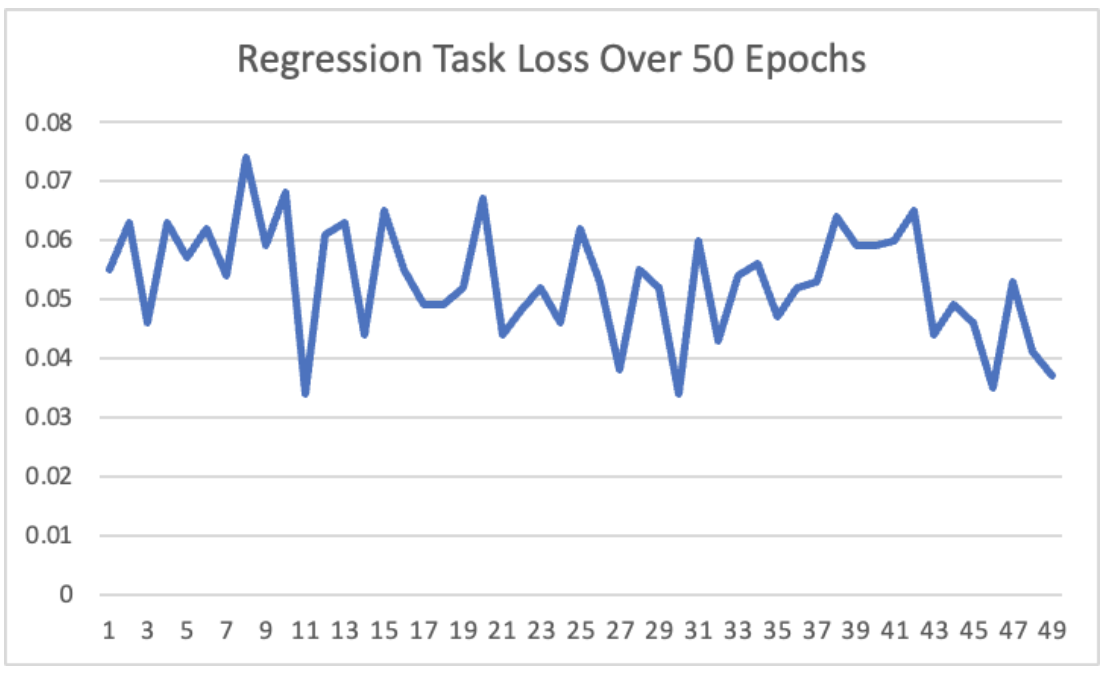
Figure 8: Training Loss (regression) over 50 Epochs
Final Writeup Here!
I. Intro
With the popularization of digital music streaming services, music characterization has grown in popularity so that users can simply request a mood or genre and receive song recommendations. Our project tackles a multi-class classification problem and a regression task; Using supervised learning to predict the mood of a song based on its lyrics, we have created a model to help users find music based on a desired mood category and a musical positivity score (valence). The model references the paper Music Mood Detection Based On Audio And Lyrics With Deep Neural Net, which we have modified to only consider lyrics. This project could be used to make playlists on Spotify (or other music platforms) or radio genres. Ultimately, it would help users find music in a mood category of their choosing.
II. Methodology
Model
We used the Tensorflow framework to implement a model architecture consisting of a word embedding layer, 1D convolution, max pooling, an LSTM/GRU (tested both), a dense layer with relu/tanh activation (depending on the task), dropouts of 0.5, and a dense output layer with softmax/sigmoid activation (depending on the task). Our models were fairly similar across both our regression and classification models however we did change activation functions and layer sizes accordingly. (See Figure 1) This diagram displays a basic representation of our models. Each model however has a few unique features as discussed.
Data
The original paper used both audio and lyrics. To simplify this problem, we only used lyrics. Rather than using the Million Song Dataset as suggested by the paper, we used two different datasets; one for each task. For the classification task, we used a dataset that consisted of 1,160 songs and three different categories for moods: sadness, tension, and tenderness. For our regression taks, we used a dataset with over 150,000 lyrics labeled with valence (positivity score of a song on a scale of 0 to 1) values gathered using Spotify API.
Preprocessing
For our preprocessing, we had two separate datasets to consider. For both datasets, we simplified the dataset to only consider the lyrics and the label (an emotion label for classification and a valence score for our regression task). We used the nltk word corpus to help clean unnecessary data in both sets. For our classification dataset, we trimmed each song down to the first 50 lyrics, balanced out the dataset so that each emotion had an even number of songs, and one hot encoded the labels. Additionally, we removed outliers in song length by finding the mean and standard deviation. We also added padding so that every song was the same length and we could eventually convert our data into tensors. We split the dataset into training and testing sets (using an 80%/20% split). We used a very similar methodology for our regression dataset, but did not one hot encode our labels and simply left them as valence scores.
III. Hyperparameters/Optimization
(See Figure 2)
Training + Testing
For both tasks, we used Stochastic Gradient Descent (SGD) as our optimizer. We started with Adam as our optimizer, however, when we encountered some overfitting, we switched to SGD. At first, we used categorical cross entropy as our loss for the classification task. We also played around with making our own loss function that would penalize certain incorrect classes more harshly when we found our model guessing the same class every time. For the regression taks, we used mean squared loss. The paper used R2 scores based on valence and arousal to assess the performance of the regression model. For the regression task, we used R2 scores based on valence only. For the classification task we used an accuracy based on the percentage of correct classifications. Both models were trained on varying numbers of epochs with various hyperparameters to find the best overall results (final values are summarized above).
Results
Classification
The highest accuracy we achieved was .536 for 100 epochs as we struggled to move it past this level. Upon inspection, we discovered that the model guessed the same class for every song and correctly predicted moods 50% of the time. We attempted to fix this issue, but ultimately came to the conclusion that the dataset was not large enough to generate a better result (discussed further below). (See Figure 3) This chart models the relationship between the training data loss and accuracy for the classification model. As expected, lower loss typically correlates with higher accuracy. Additionally, we can see the highest accuracy reached was around .70. (See Figure 4) This chart illustrates the changes in loss over 50 epochs. As you can see, the loss did not change much. This inspired the custom loss function discussed below and the changes to our other accuracy metrics. (See Figure 5) This chart illustrates the changes in accuracy over 50 epochs. As you can see, the accuracy fluctuates but always hovers around an average of 50%. We discuss the causes of this in section V.
Regression
After adjusting optimizers and hyperparameters and training for 50 epochs, our data received a final R2 score of .2067 and a loss of .037. Our testing data received an average R2 score of .137. For reference, the R2 scores in the original paper averaged .177, with their best results reaching a score of .5 for lyrics. We replicated the paper as closely as possible but were not able to quite reach the desired results. (See Figure 6) This chart models the relationship between the testing data loss and R2 values. The general trend indicates that lower loss corresponds to higher R2 values. We can see that R2 values reached above .40. (See Figure 7) This chart models the changes in R2 over each training epoch. As you can see, it fluctuated a lot early on and even dipped into the negatives but ultimately it had a final upward trajectory. (See Figure 8) This chart models the changes in loss over each training epoch. As you can see, it fluctuated a lot in the beginning but ultimately it had a final slight downward trend.
Future Work
For classification, we would like to test this model on a larger dataset to see if it will predict more accurately, however, we were unable to find an adequate dataset to attempt this while working on the project. Future work might utilize a dataset that has more diverse emotions and lyrics to mitigate our issue with similarity of emotions. For regression, we would like to use a pre-trained word embedding, such as word2vec or BERT. We tried to implement this towards the end of our project, but were unsuccessful given the amount of time we had. Finally, we could train with an even larger dataset or using more than one label, such as adding arousal. Additionally, in the future we would want to add audio data to our set in the hopes of increasing prediction accuracy. This would be a form of data we have not worked with yet and would prove to be a fun challenge.
Challenges
For the classification task, our model was overtraining at first to the point where it would reach 100% accuracy on train data but receive very low values on test data. To fix this, we changed hyperparameters, minimized the length of each song, and changed our optimizer from Adam to SGD. After these changes, the overfitting was resolved, however, the model was now choosing to predict the same emotion for every song and receiving a 50% accuracy. We found our accuracy for each class and discovered that for class 0, the accuracy was 1 and for the other two classes, the accuracy was 0. To try and fix this, we altered and created the loss function in order to try to punish incorrect guesses for class 0 more harshly, since the model had learned to always guess sadness (class 0). We also made a custom loss function to praise correct answers for tension and tenderness, which then accounted for penalty or praise in the categorical cross entropy calculation. Unfortunately, this did not change the result of our model. Additionally, we tried to edit the architecture of the model, thinking maybe the implementation was naive. We made two convolutional layers and tried changing the number of dense layers, but still the same result. At this point we figured that it was the dataset giving us issues since class 0 had slightly more occurrences than the other two. To resolve this, we balanced the dataset so all of the classes had an equal number of occurrences. Since the dataset was small to begin with, removing more data made the dataset too small to allow the model to learn anything. For the regression task, we had a much larger dataset than for the classification task so did not run into the same errors. However, like the classification task, we were overfitting at first. To correct this, we changed our optimizer from Adam to SGD, altered the learning rate, and changed the sizes of hidden layers. Much of this has been discussed above, but we did run into a number of challenges while working on this project. For classification, we had a dataset that weighted heavily (more than 50% of data) towards one label. We combatted this by evening out the dataset but this shrunk an already small amount of data. To avoid overfitting, we changed hyperparameters, altered the loss function, minimized the length of each song, added convolutional layers, and changed our optimizer from Adam to SGD. Overfitting proved to be a difficult challenge for both our classification and regression. For regression, we attempted to mitigate overfitting by changing the optimizer, altering the learning rate, altering the RNN layer, and altering the sizes of hidden layers. We also attempted implementing BERT into our model. As a result, we learned the importance of choosing a good dataset, preprocessing data well, and choosing different model architectures. Overall, we did have to stray from the paper since the paper used a bimodal architecture combining both audio data and lyric data. Our implementation only uses lyric data which could have lowered our accuracy scores so we attempted to combat this by making our model slightly more complex.
Reflection
Ultimately, we think our project turned out fairly well. We were able to obtain results that resembled the paper which was a positive. Our concern was that the paper’s results are not super optimal overall. Our base goal was to have a working model with a minimum of 50% accuracy. We were successful in this initiative for our initial model. Our target goal was to get our accuracy above 70% by changing small pieces of our architecture and our stretch goal was to have our accuracy above 90%. These goals were not met, however, after looking more closely at the paper we replicated and seeing that these goals were not really reached on their end either, these goals may have been ambitious. We were able to go far beyond our initial plan though by adding an entirely new model and dataset with different metrics. This became a new target and stretch goal to simply get the second model working and then reach similar results to the paper which we were able to do. Our initial model (our classification model) did work out the way we wanted it to to an extent. Our issue eventually stemmed from the dataset we were using which ended up being too small. However, the model itself was clearly learning and training based on the classification architecture we implemented. Our regression model worked as we expected it too for the most part as well. We definitely thought we could achieve a higher R2 result. However, we feel that we explored a variety of methods to improve this and since none of them worked, we are happy to have at least gotten the model to the level we did. As we worked through our initial model, we realized that our dataset was holding us back. This led us to look for additional datasets and also to examine our current dataset. However, we failed to find any datasets with the correct labels to match the dataset we were working with. We then had to change our approach from a classification model to a regression model to match our new dataset. This pivot also caused us to steer a bit further away from the paper’s architecture. If we did this project again, I think we would have tried to just improve on the regression model. We pivoted fairly late in the process after working hard on the classification task. I think with more time we could have explored transformers and BERT to hopefully improve our R2 scores. Additionally, with more time, I think it would have been fun to attempt to add audio to our model and from there create a bimodal model for our predictions just as the paper does. Overall, we got a lot out of this project. We certainly learned the importance of choosing a good dataset and adequately preparing it. We were able to apply different models based on the dataset at hand and apply much of what we learned in class such as layering, optimizations, activations, and the best strategies for improving accuracy and minimizing loss. We also encountered the most serious overfitting we have so far and were able to diagnose the cause of the overfitting and how we might attempt to fix it. This project was also a great opportunity to implement a project from scratch. Typically with homework assignments, we have a stencil code and a handout that serves as a road map. While we had a paper to replicate, we still had to implement the project from scratch and the paper did not always provide answers to the issues we ran into so we had to troubleshoot ourselves. As a result, we feel we gained both skills that are specific to implementing our model but also skills that are applicable to future deep learning and computer science projects in general.
Sources
Paper: Here
Authors: Remi Delbouys, Romain Hennequin, Francesco Piccoli, Jimena Royo-Letelier, Manuel Moussallam
Github repository: Here
Framework used: pyTorch
Dataset: Classification: Here Regression: Here
Additional Links/Related Works
https://towardsdatascience.com/predicting-the-music-mood-of-a-song-with-deep-learning-c3ac2b45229e https://ieeexplore.ieee.org/document/9412361 https://github.com/topics/music-emotion-recognition https://github.com/imdiptanu/lyrics-emotion-detection https://nitratine.net/blog/post/finding-emotion-in-music-with-python/ https://amorqiu.medium.com/how-to-build-an-emotion-based-song-retrieval-model-in-python-ec24ccdba18b https://www.geeksforgeeks.org/emotion-based-music-player-python-project/ https://www.hindawi.com/journals/cin/2022/3920663/ https://www.arxiv-vanity.com/papers/1809.07276/
Outline: Here!
Reflection 3: Here!
Built With
- python
- tensorflow


Log in or sign up for Devpost to join the conversation.