-
-
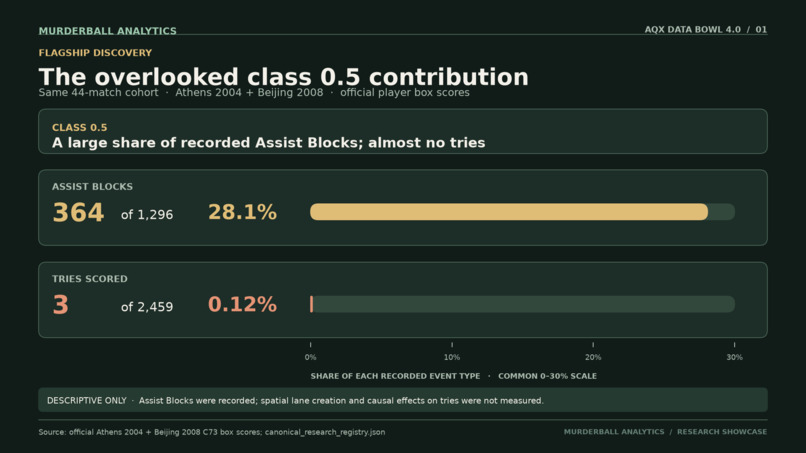
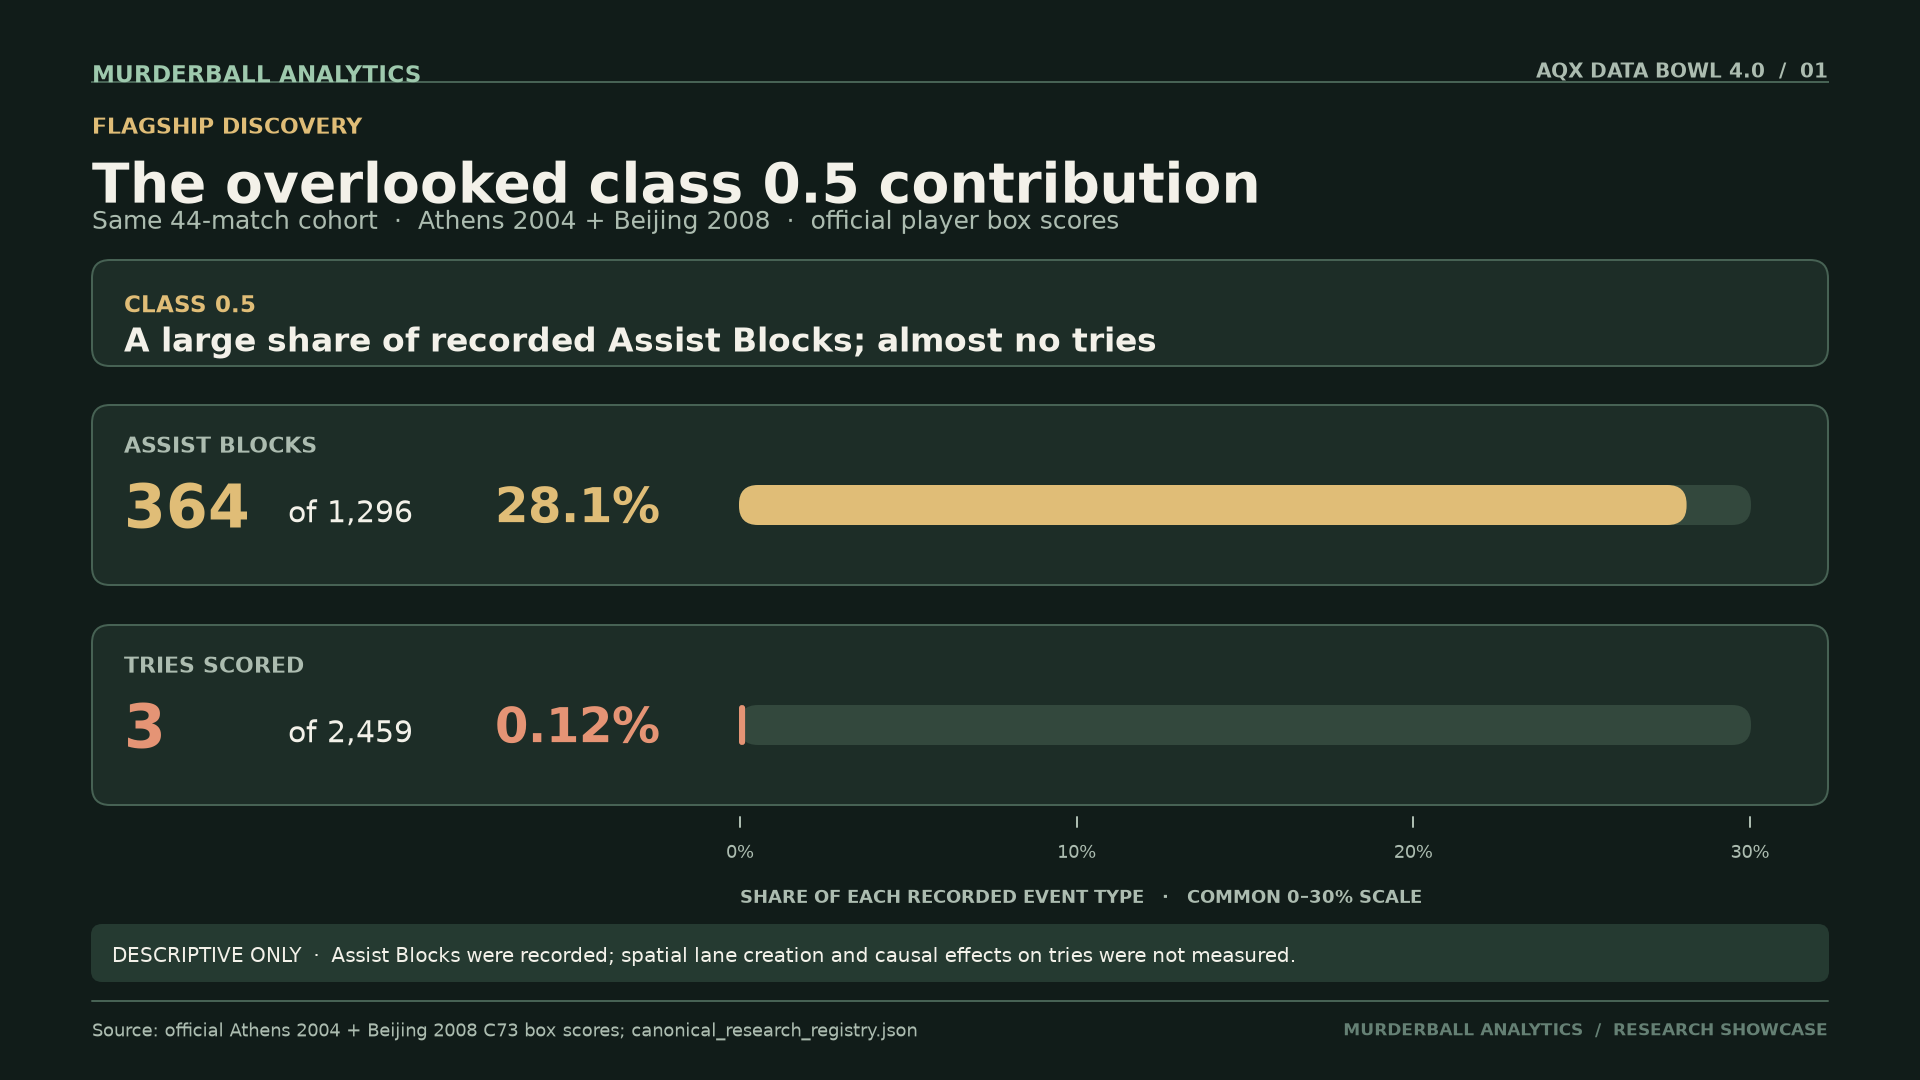
Class 0.5 athletes recorded 28.1% of Assist Blocks but scored just 0.12% of tries in the analyzed cohort.
-

Research Hub brings statistical findings, source evidence, and research limitations together in one place.
-
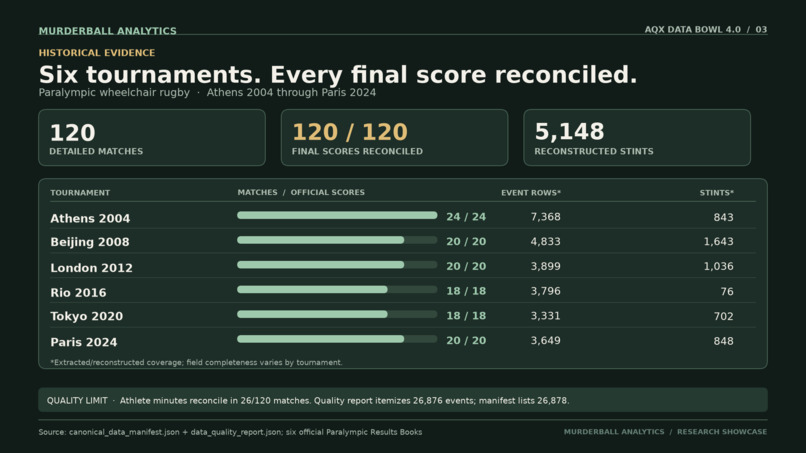
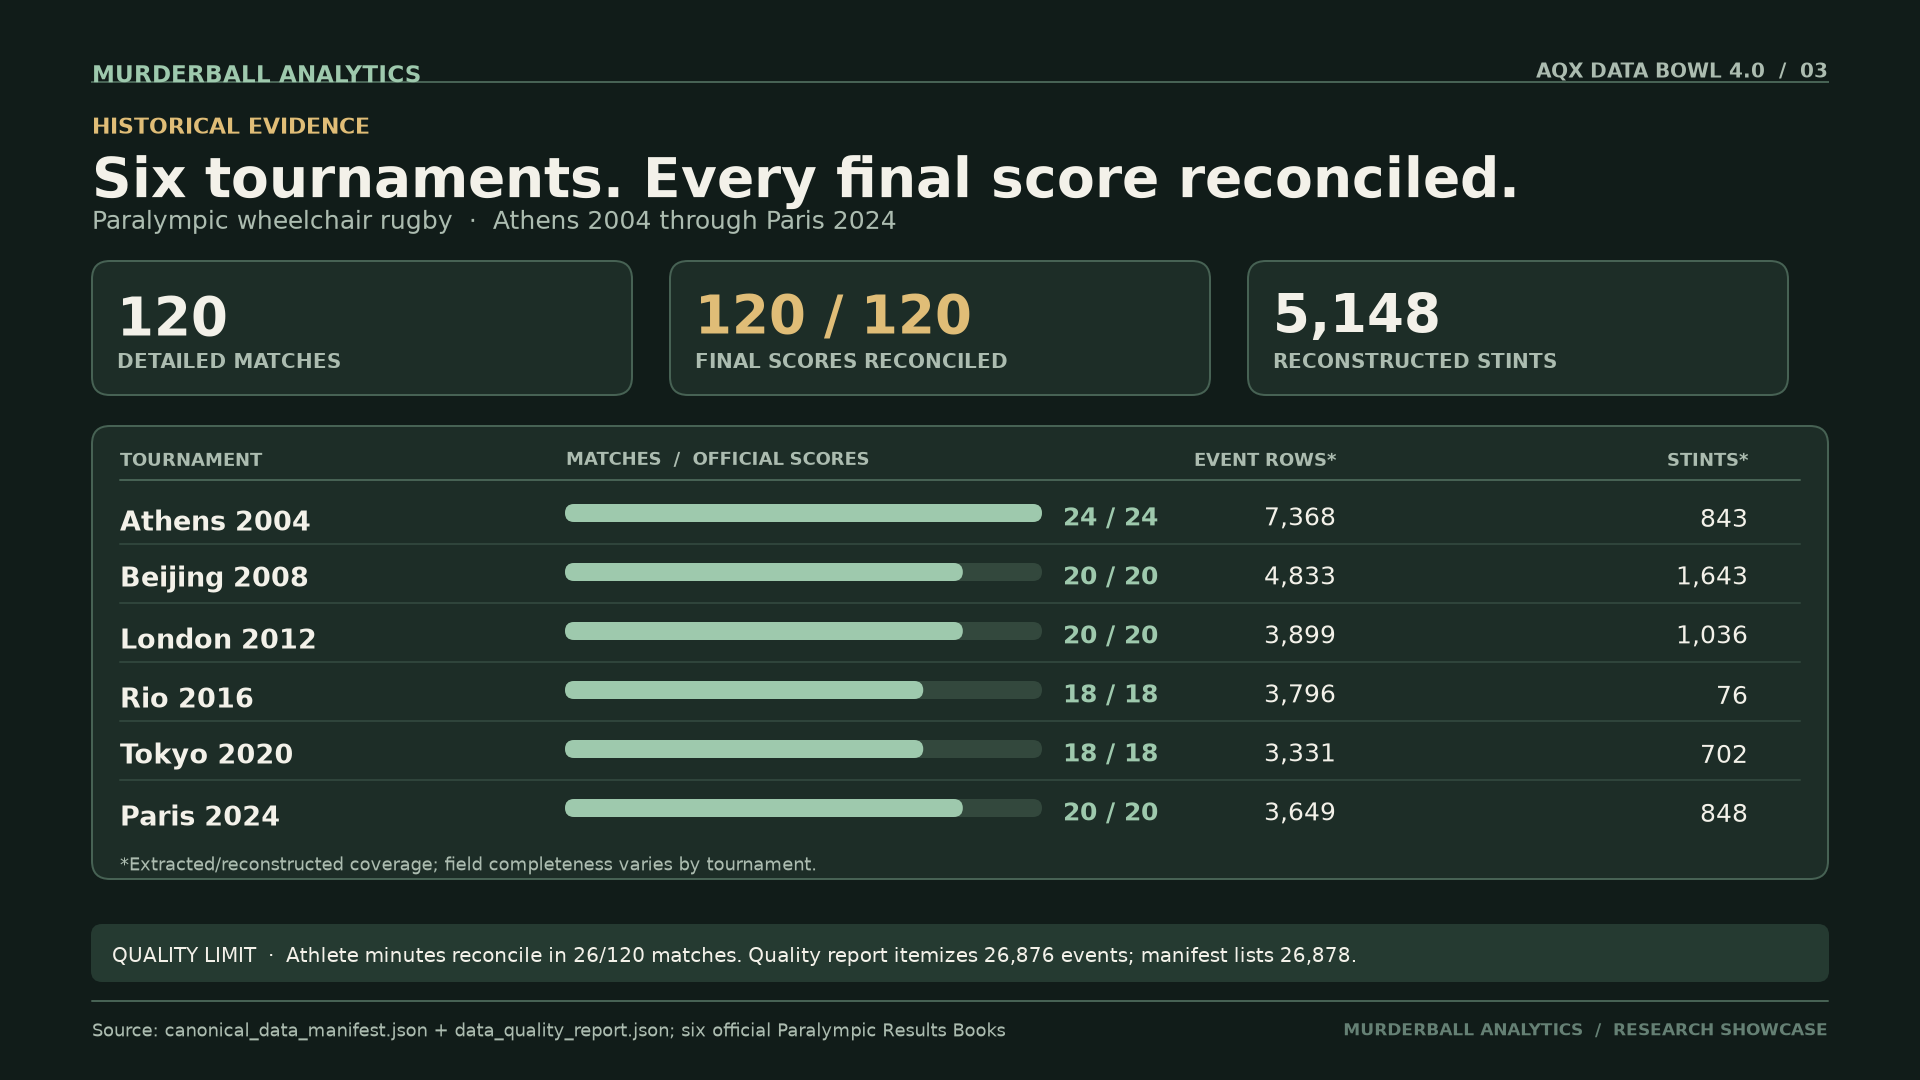
120 Paralympic matches across six Games (2004–2024), with all 120 final scores reconciled to official records.
-
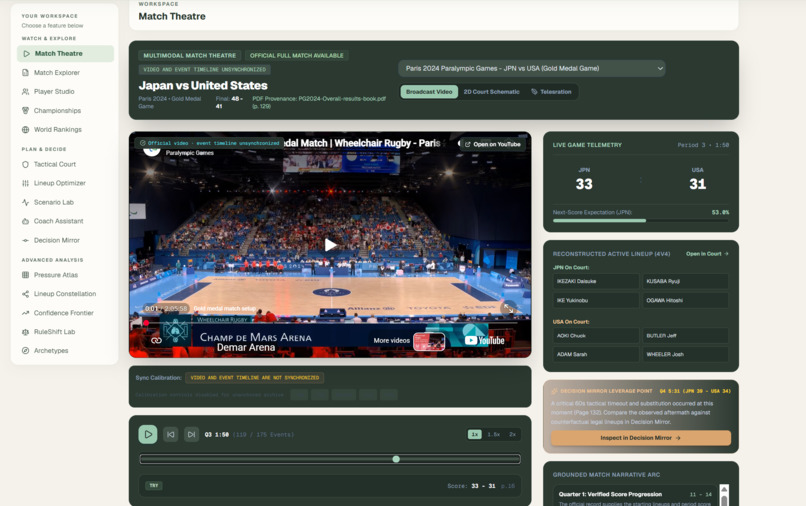
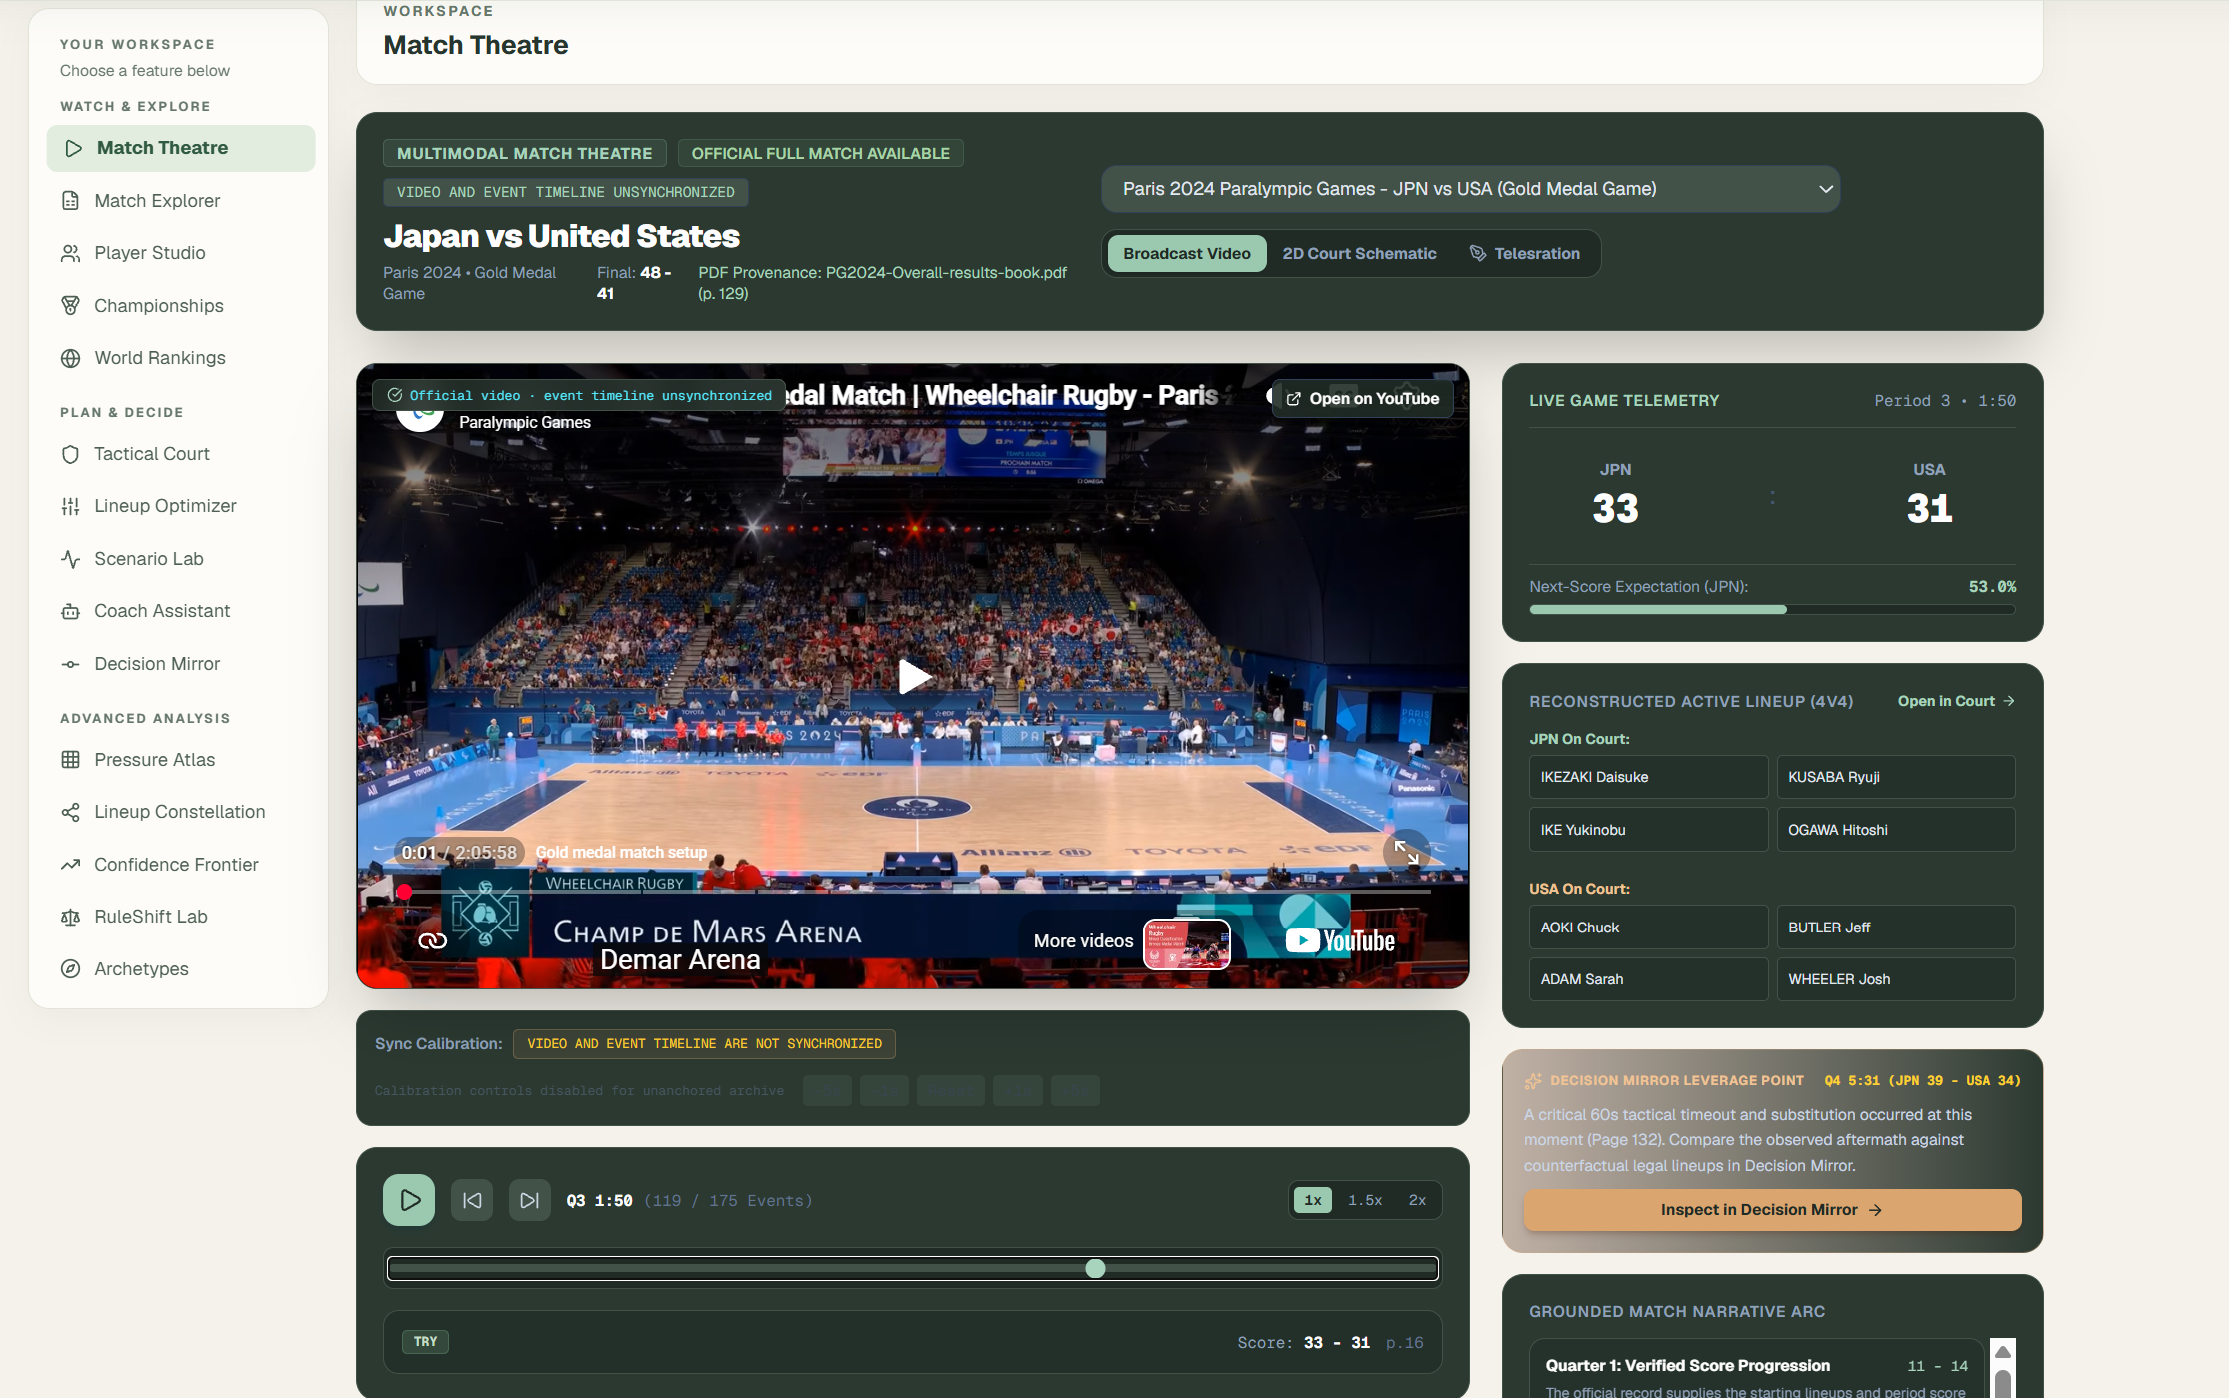
Match Theatre explores official scores, substitutions, and lineups, with historical source references.
-
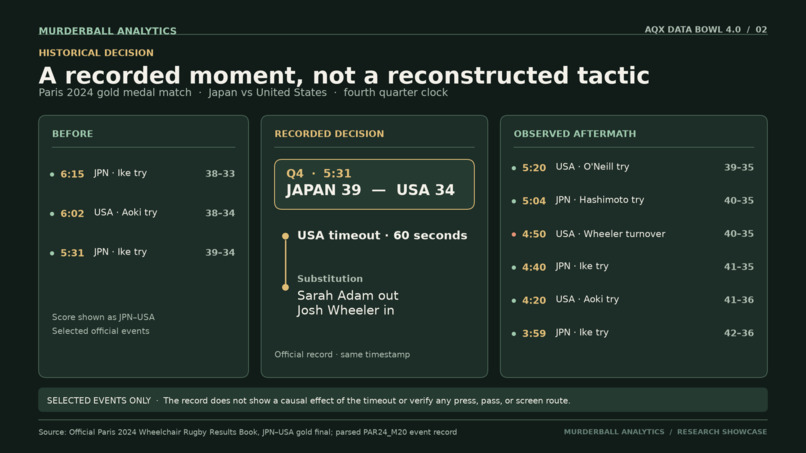
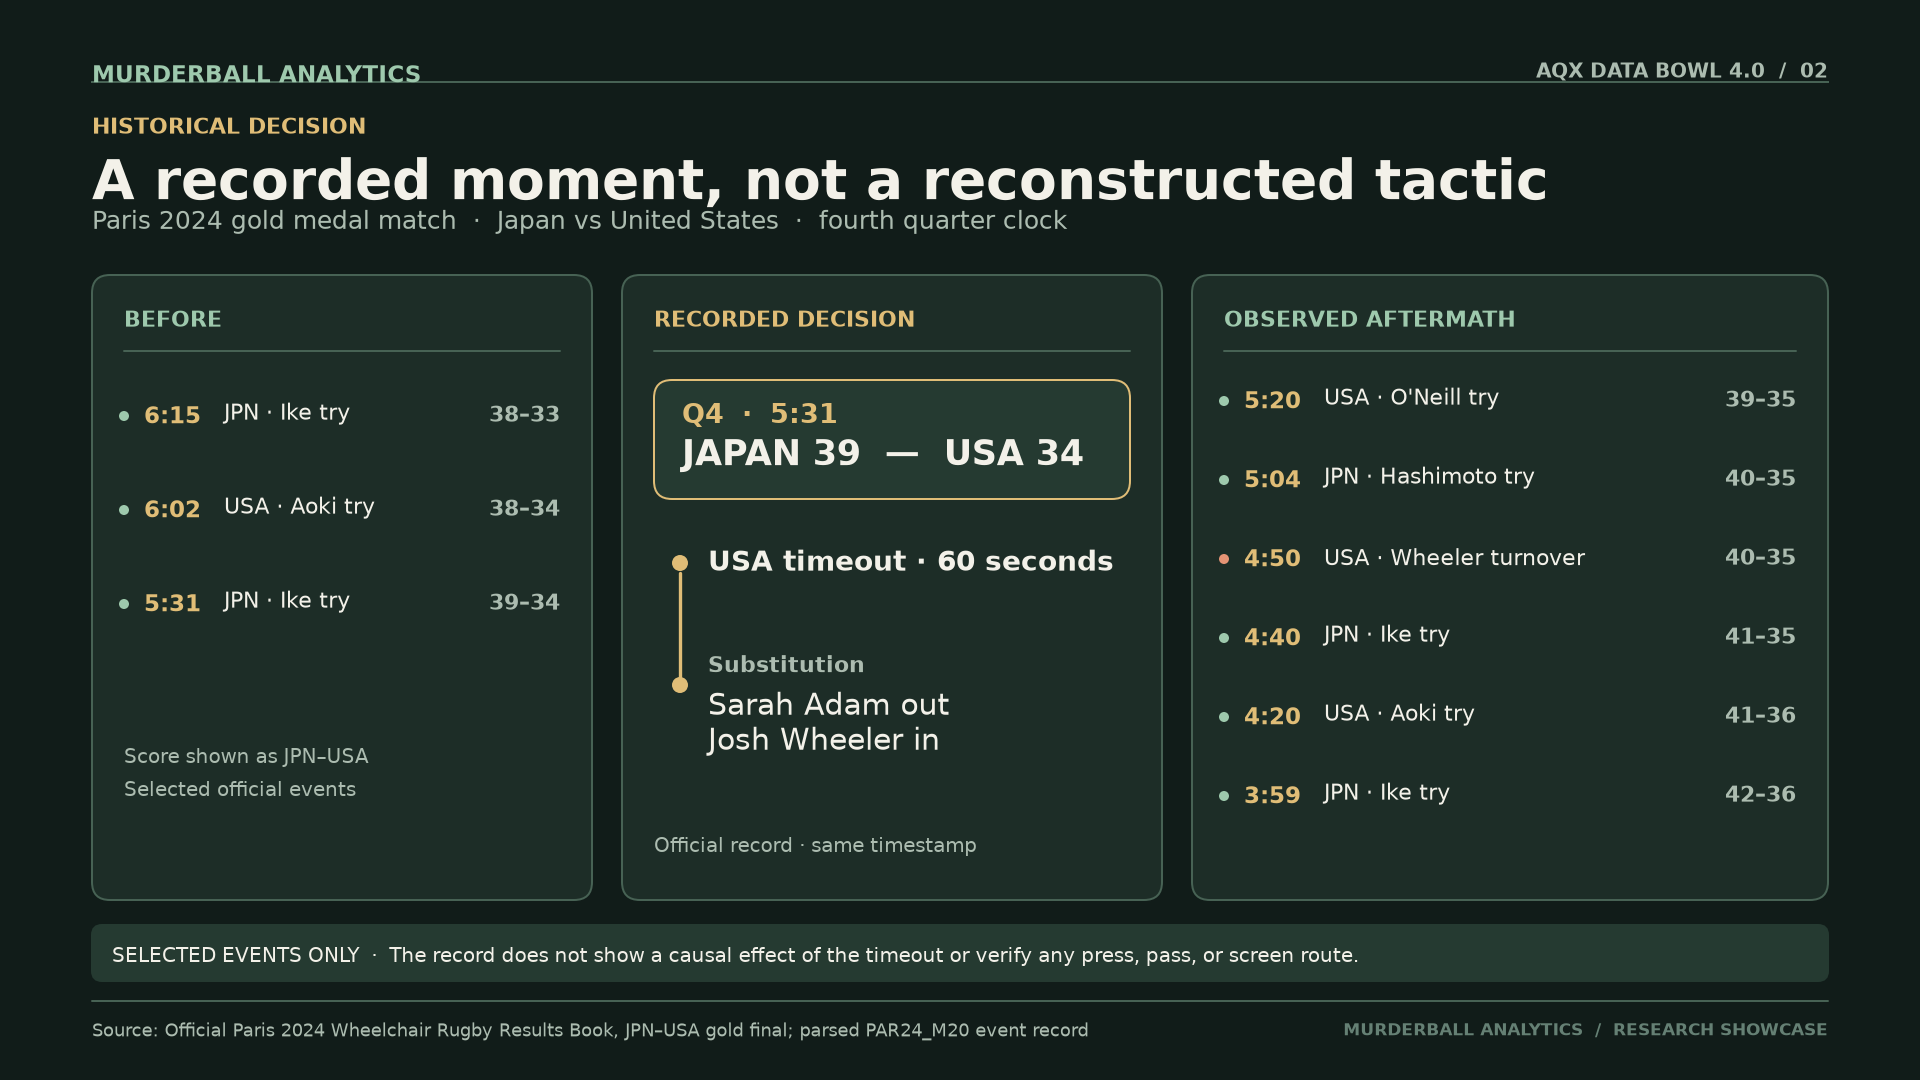
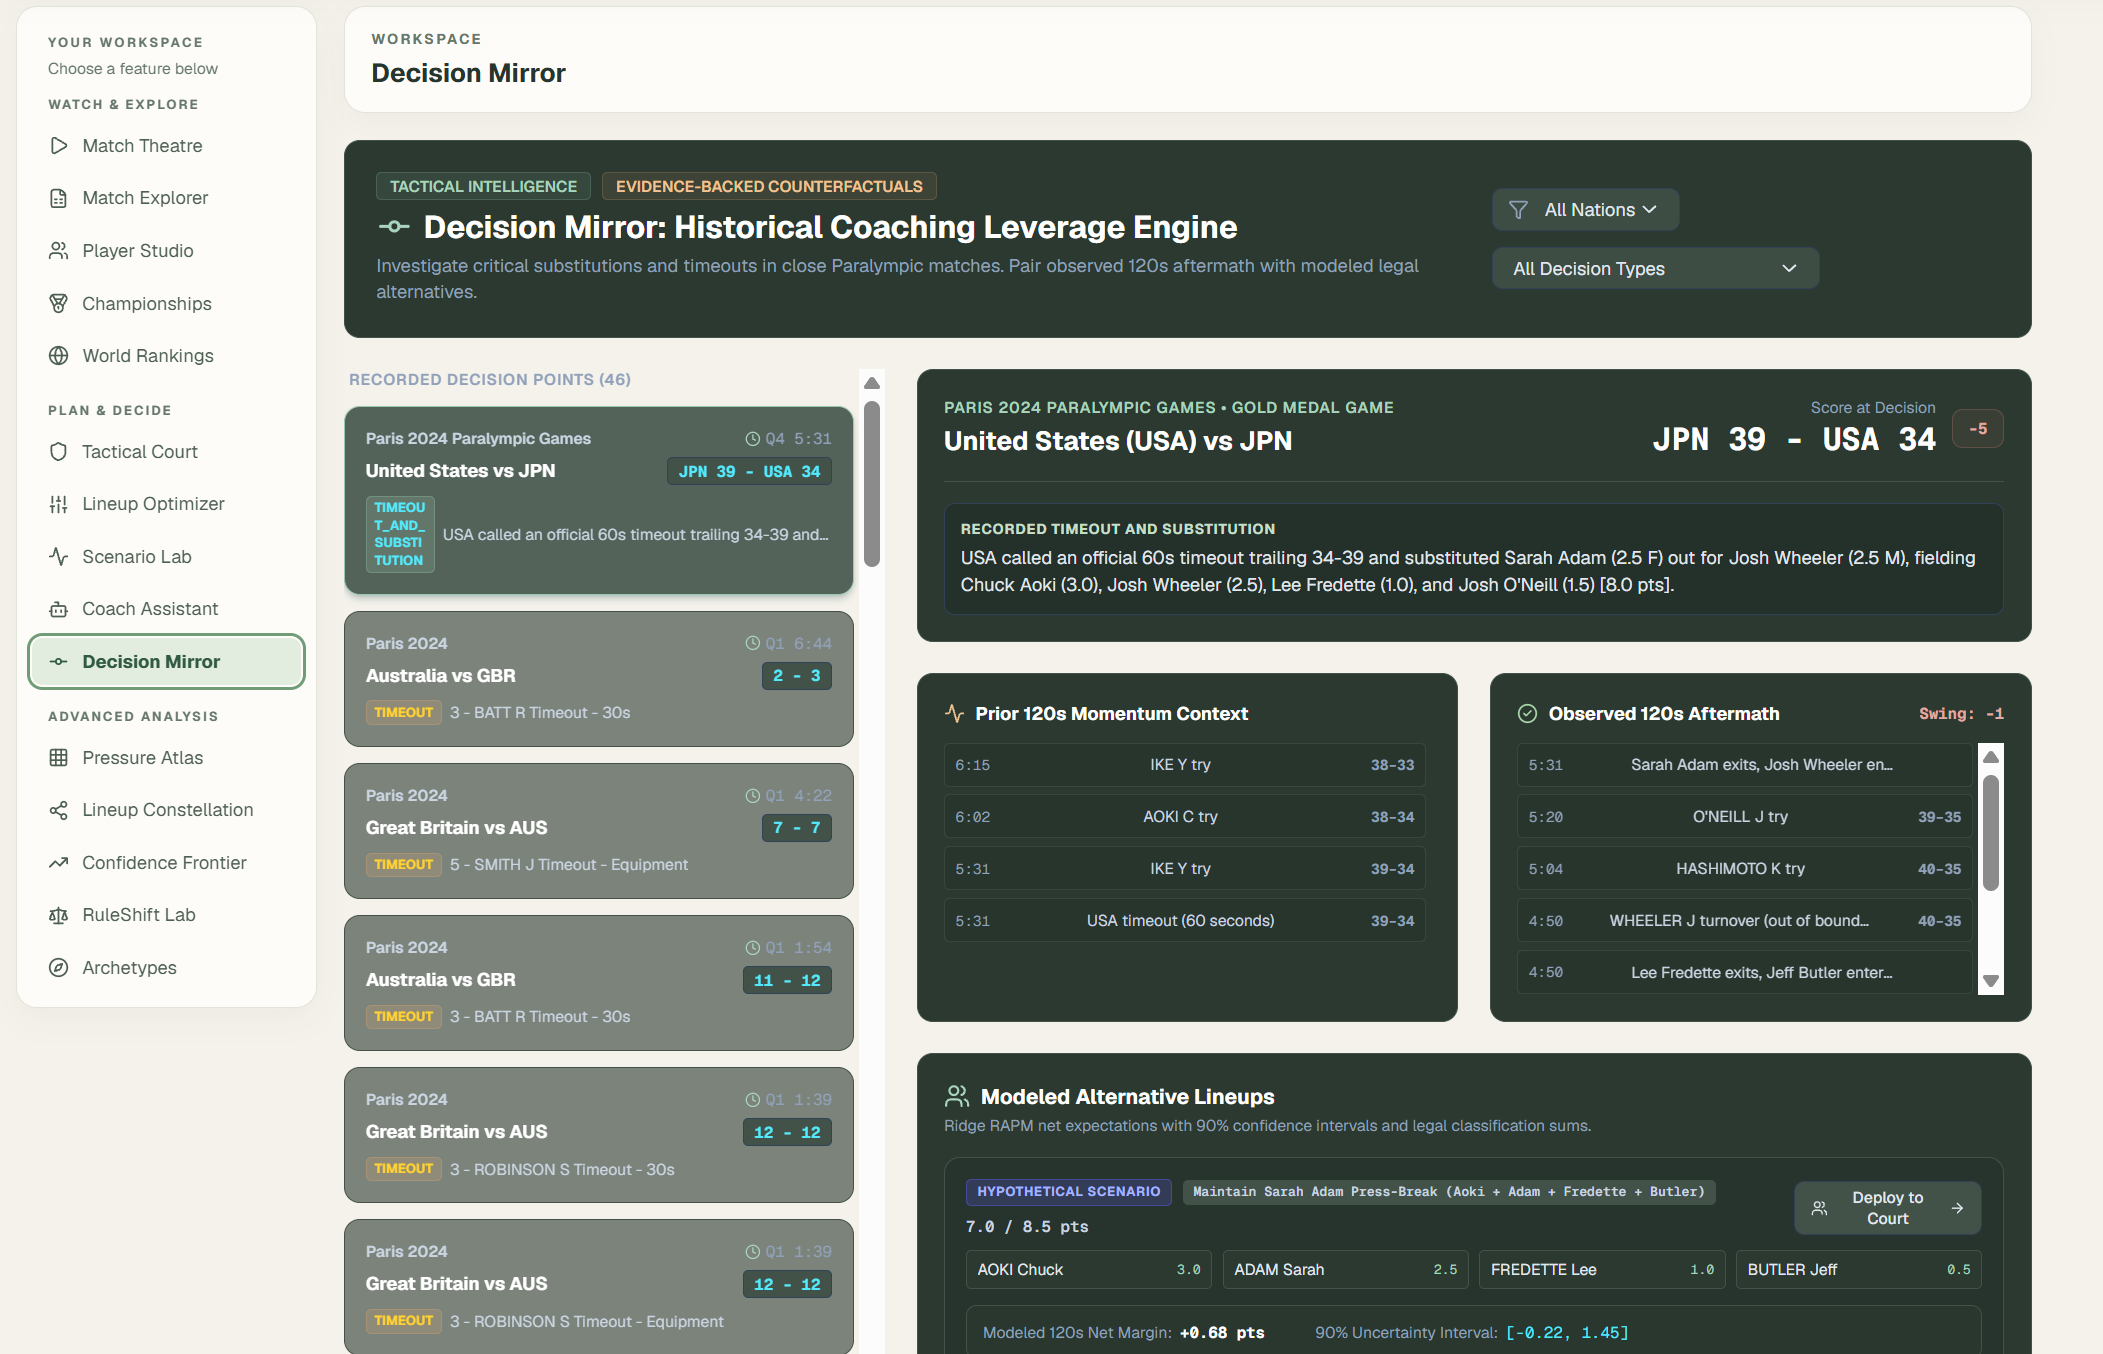
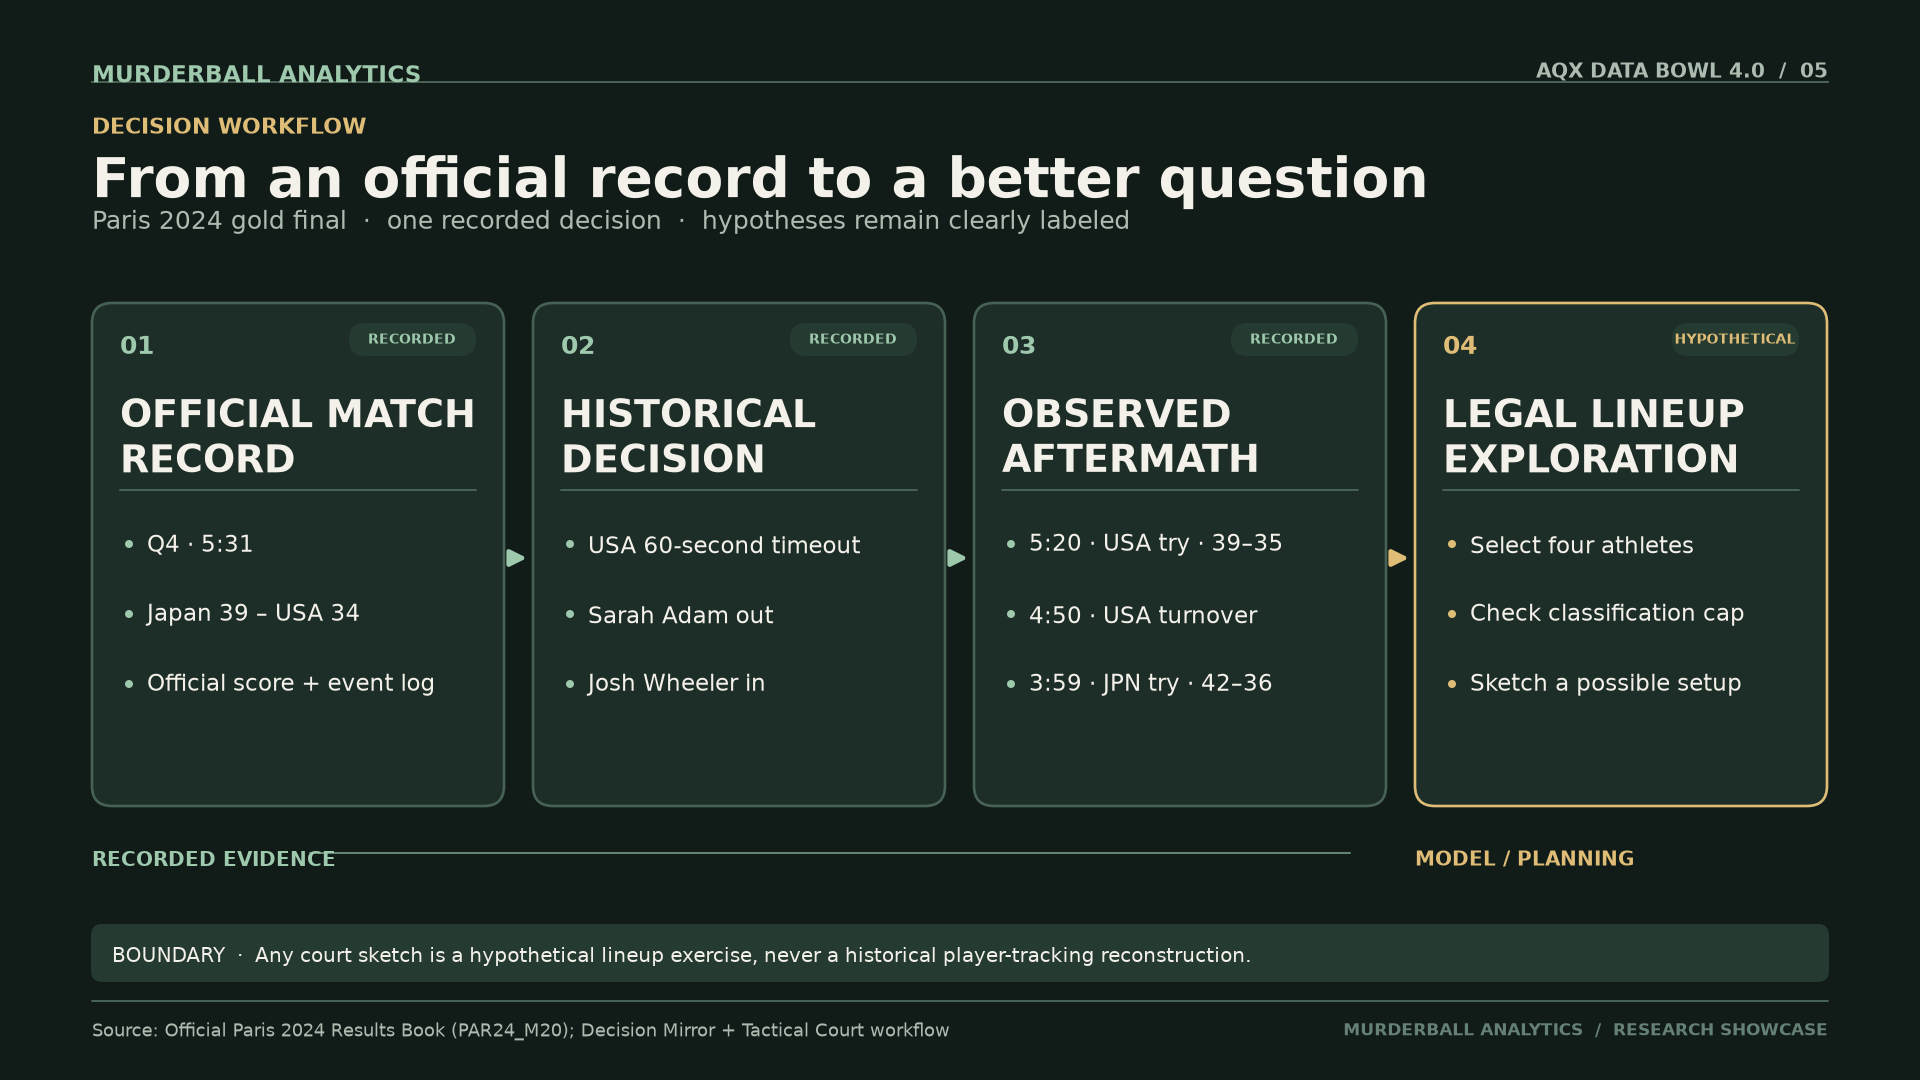
Paris 2024 final: Japan led USA 39–34 with 5:31 left in Q4, ahead of a recorded USA timeout.
-
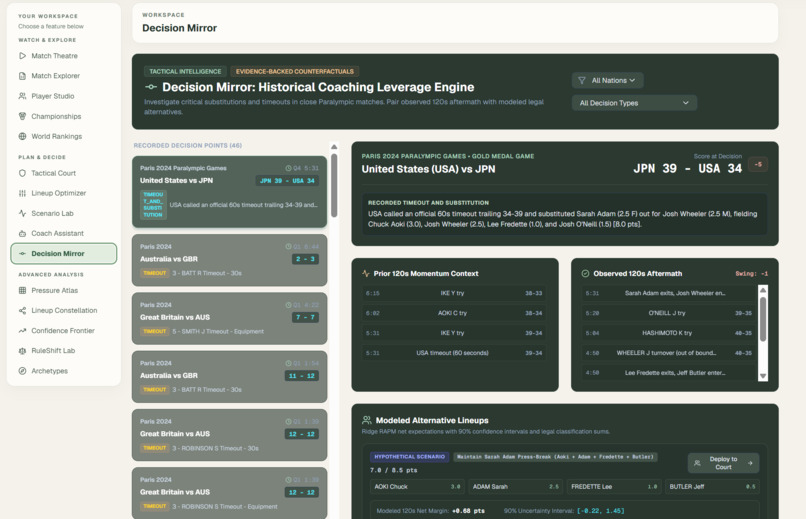
Decision Mirror separates recorded match events from hypothetical lineup choices. Simulations are not historical outcomes.
-
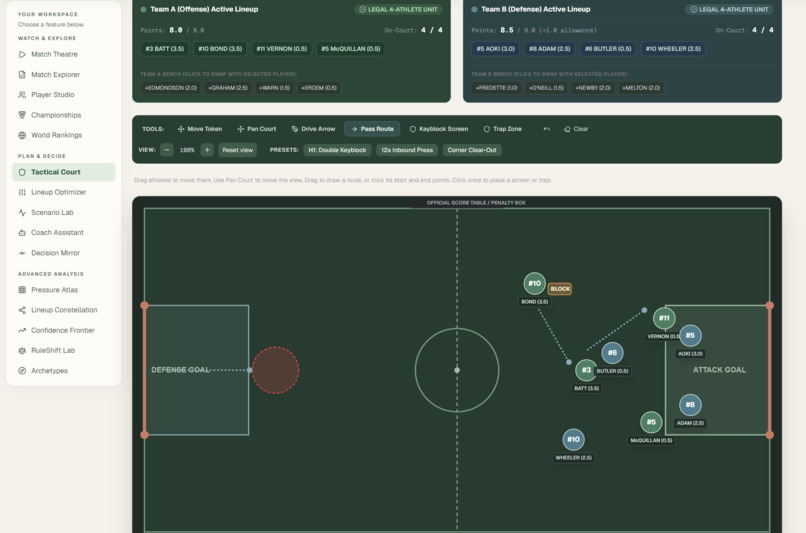
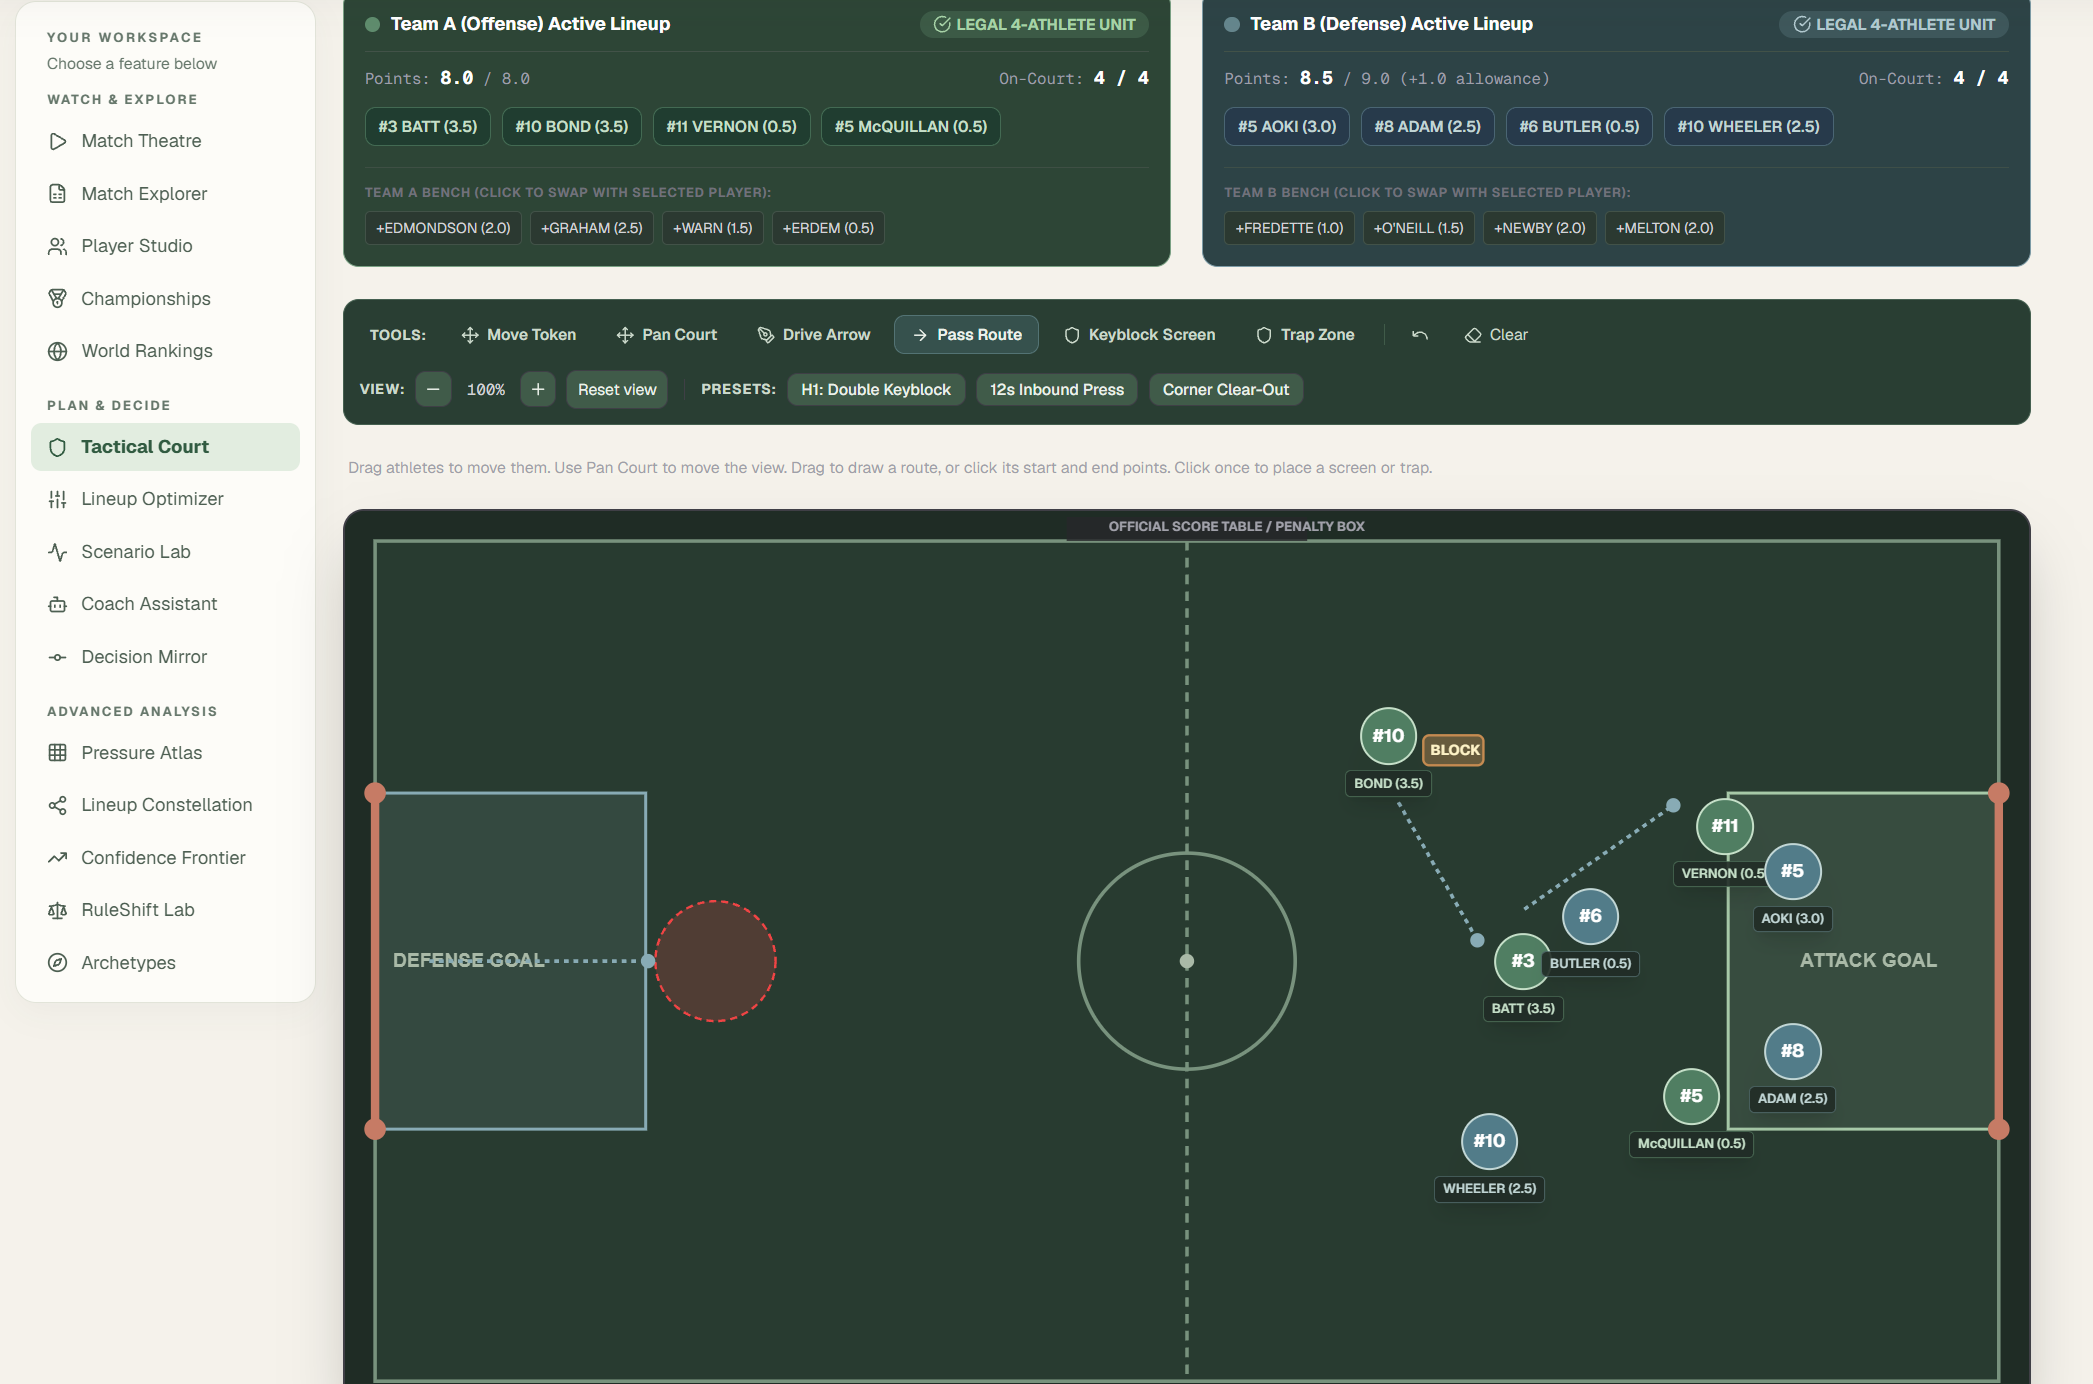
Tactical Court helps explore four-player lineups and classification point limits through an interactive court.
-
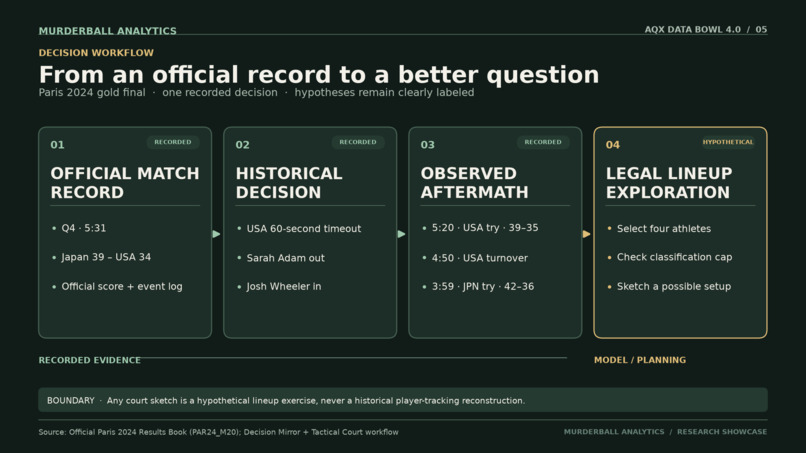
From official records to statistical insights and coaching exploration: MurderBall's evidence-first workflow.
-
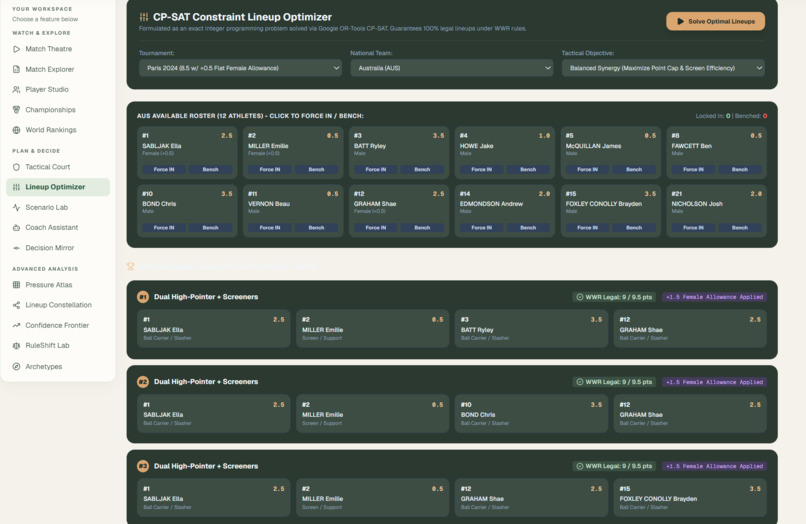
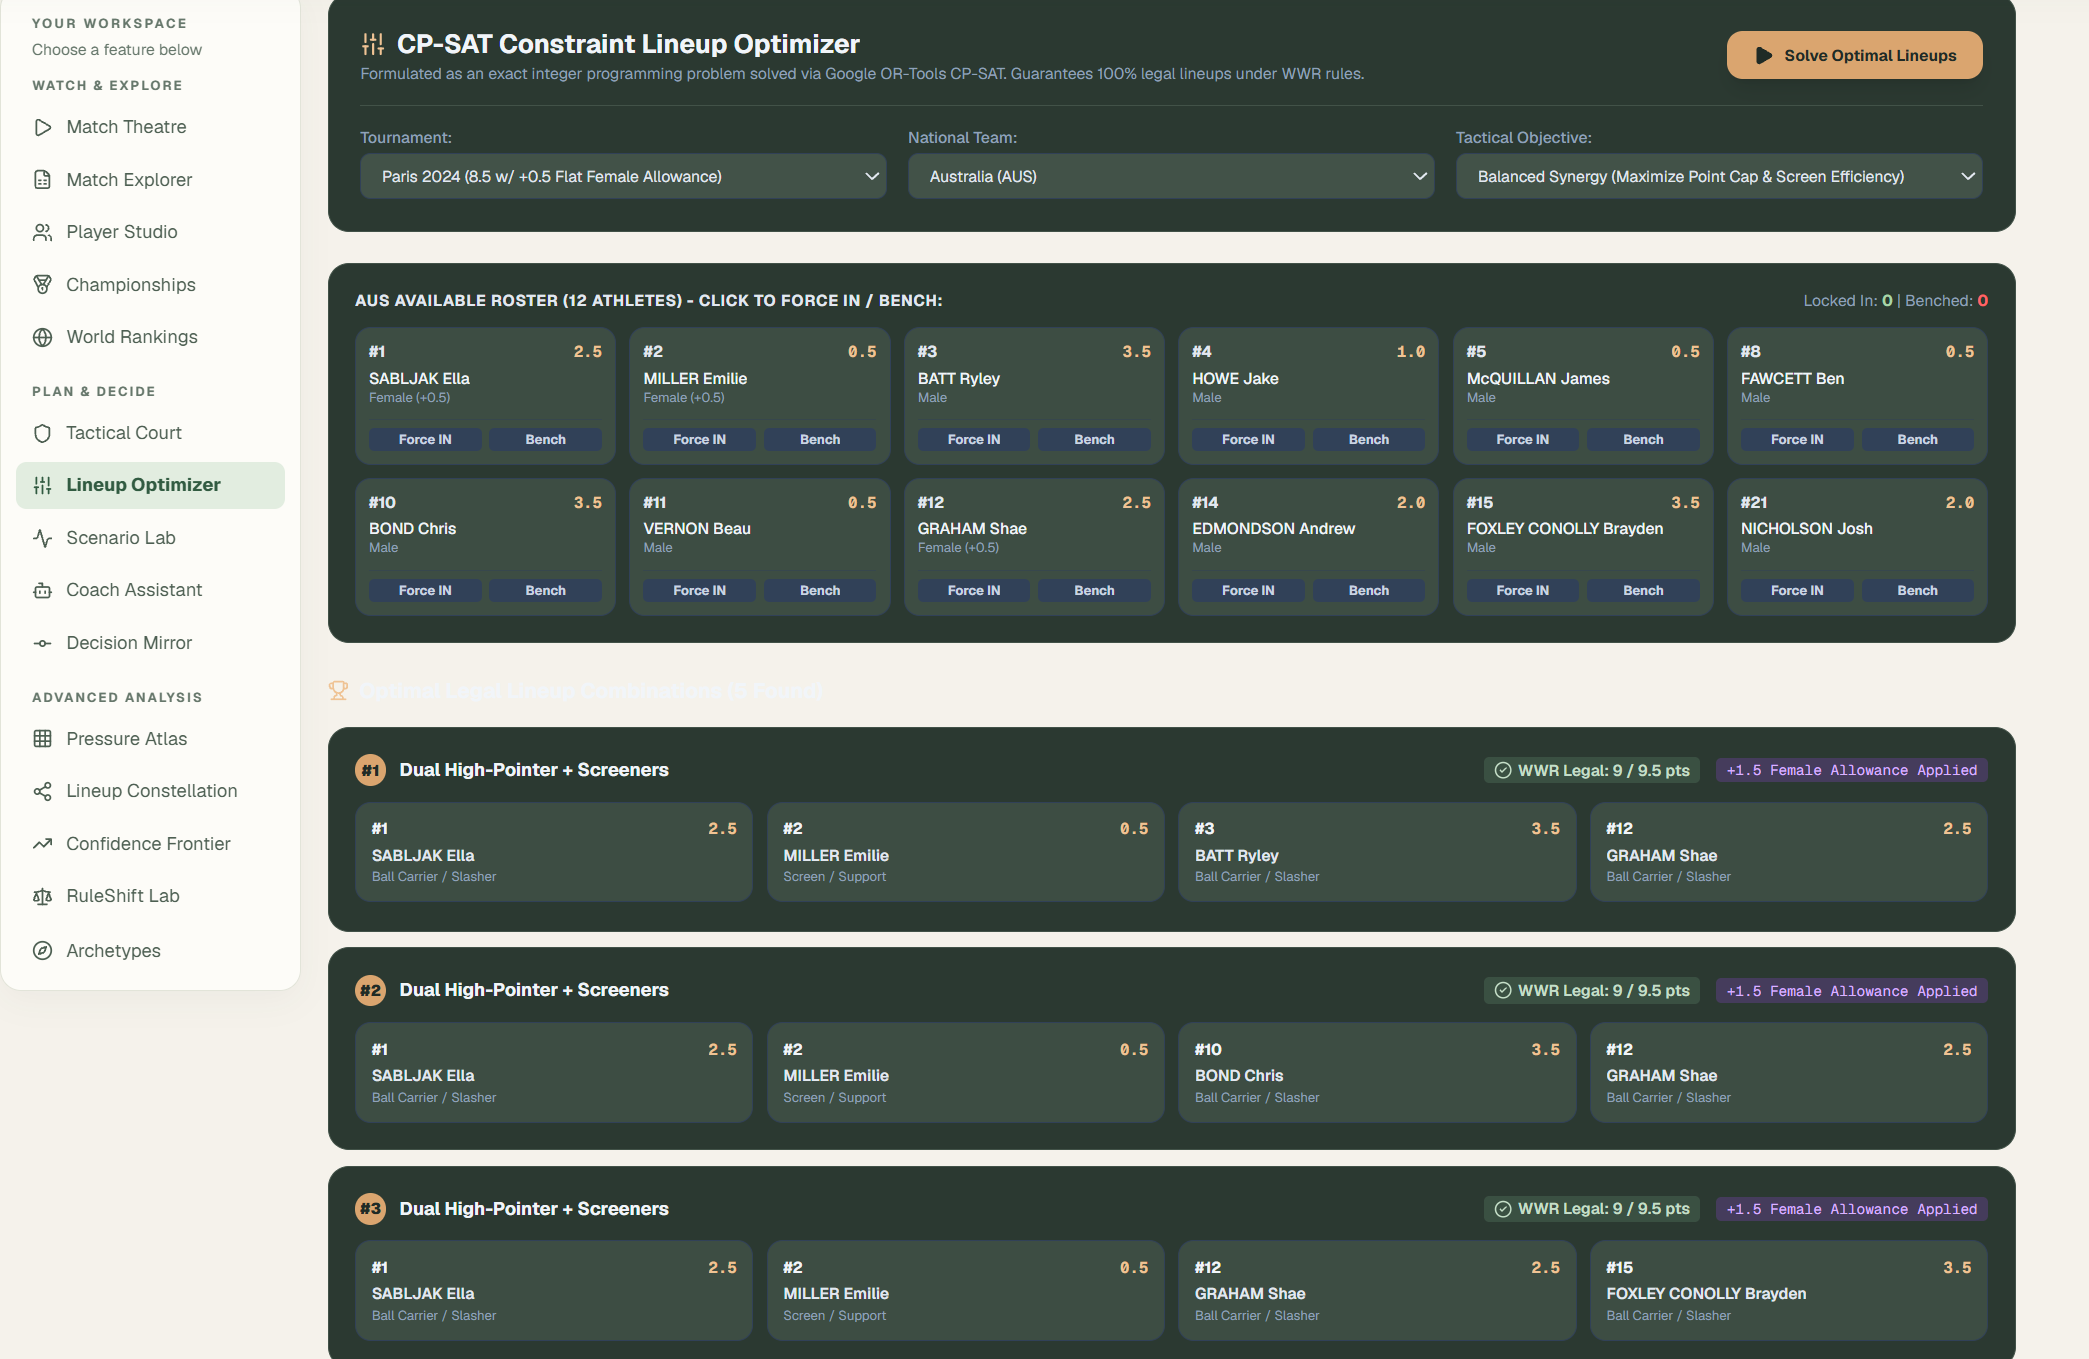
Lineup Optimizer explores feasible four-player combinations under wheelchair rugby classification limits.
-
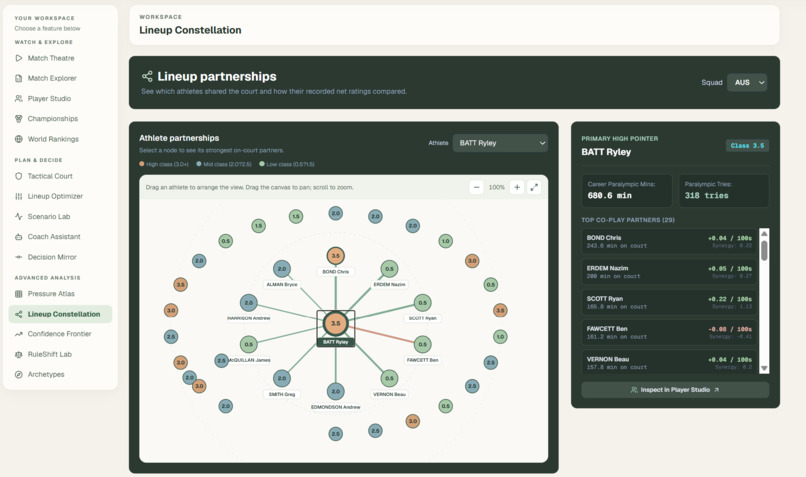
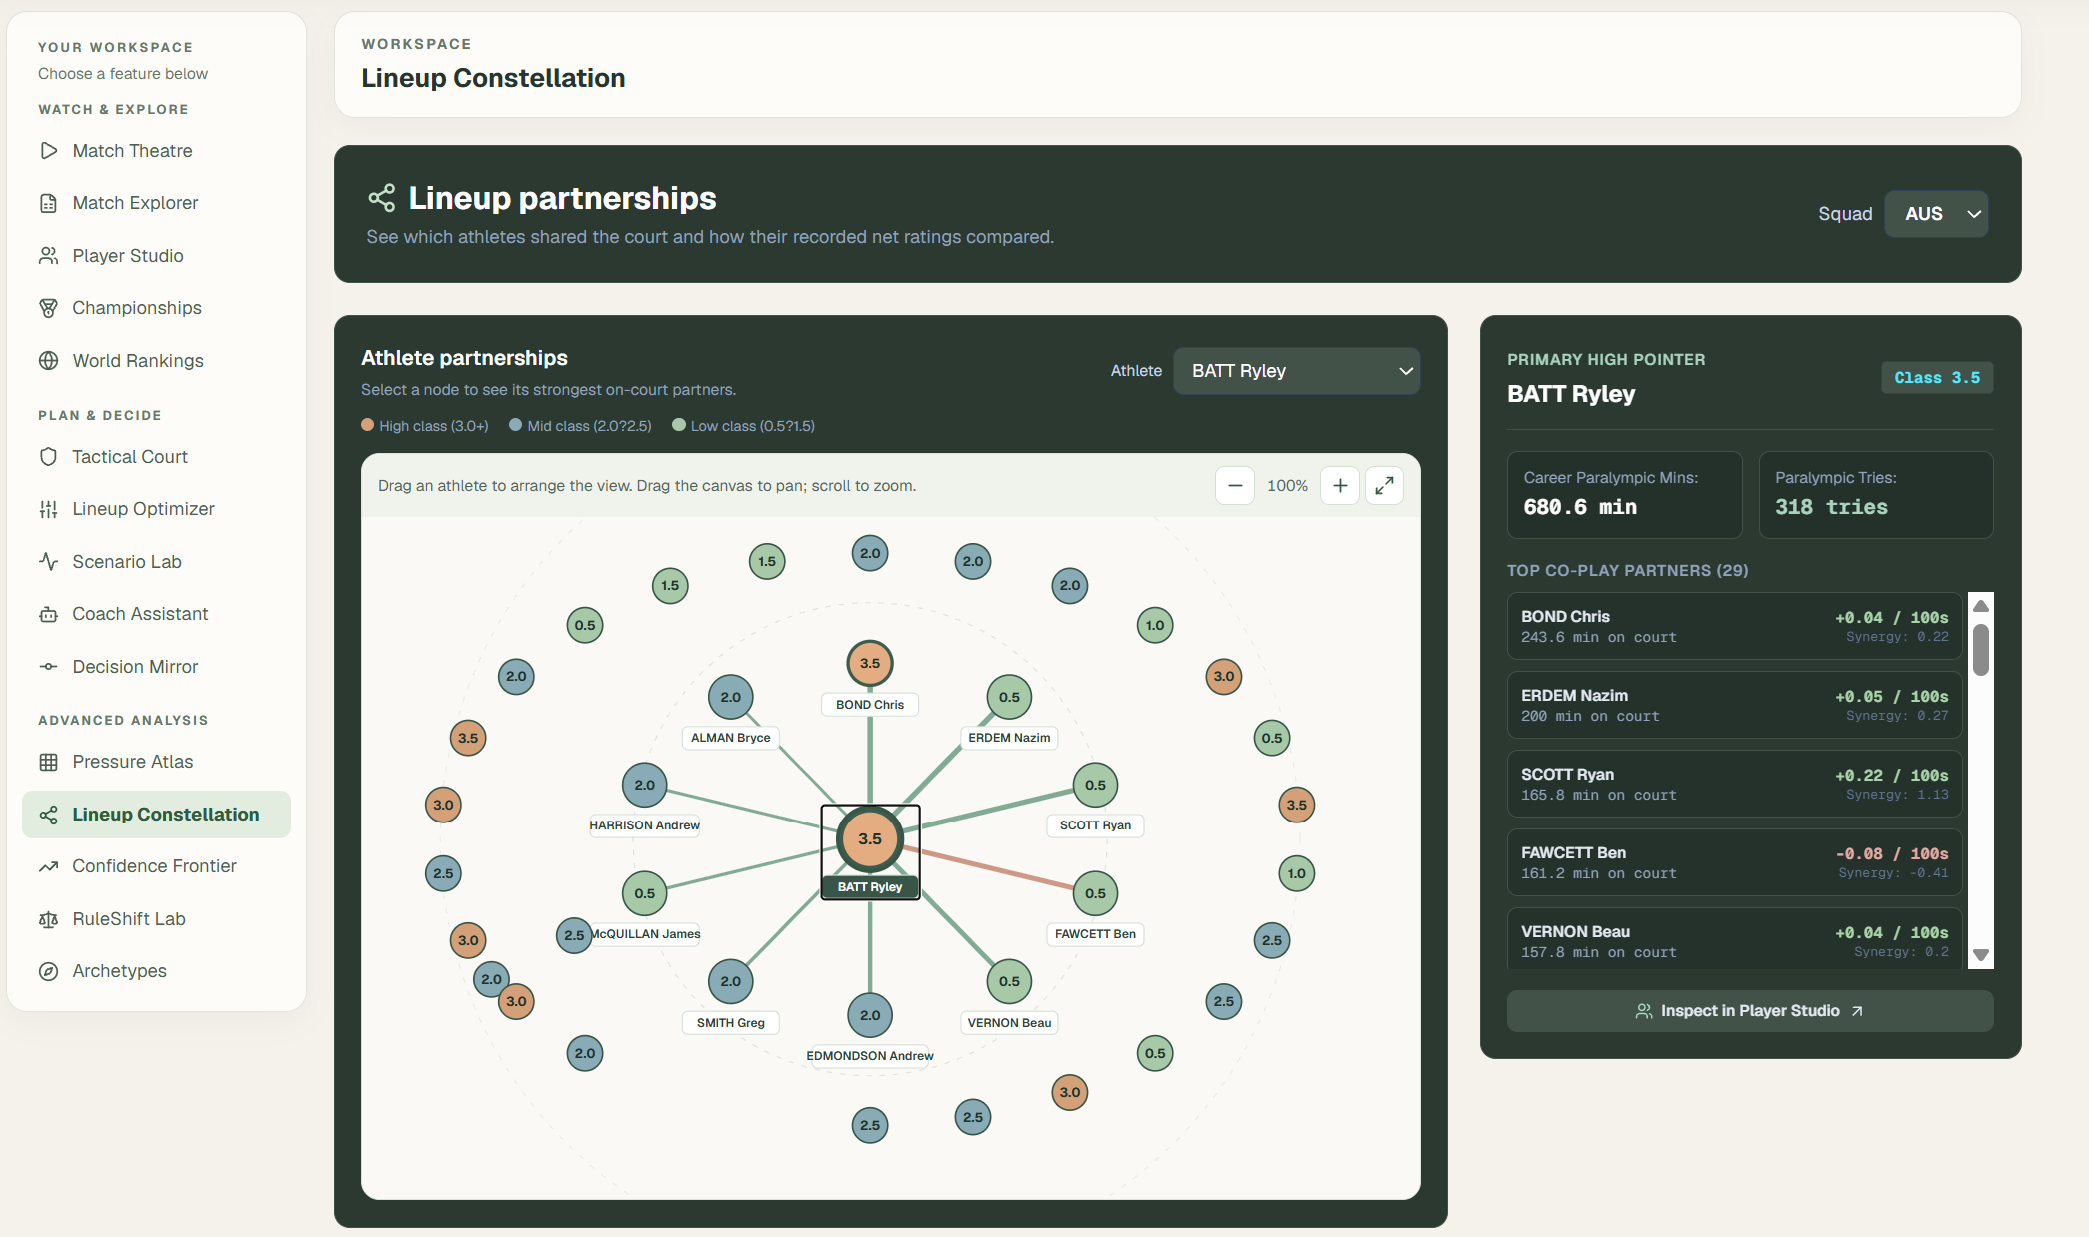
Lineup Constellation visualizes shared court time and exploratory player partnerships from reconstructed records.
-
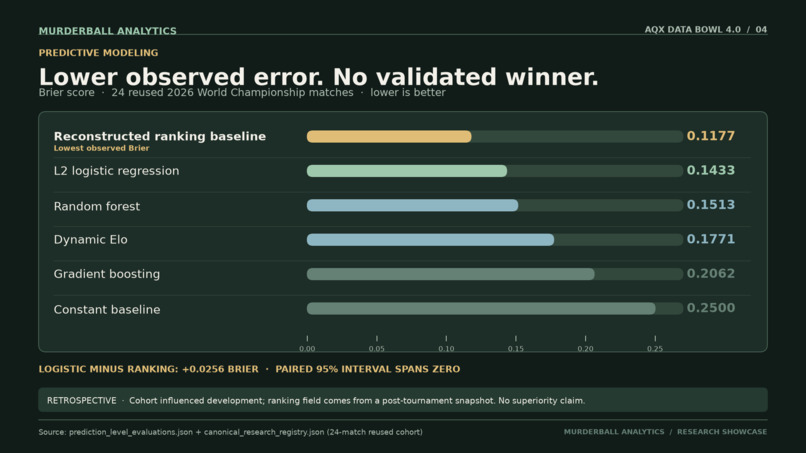
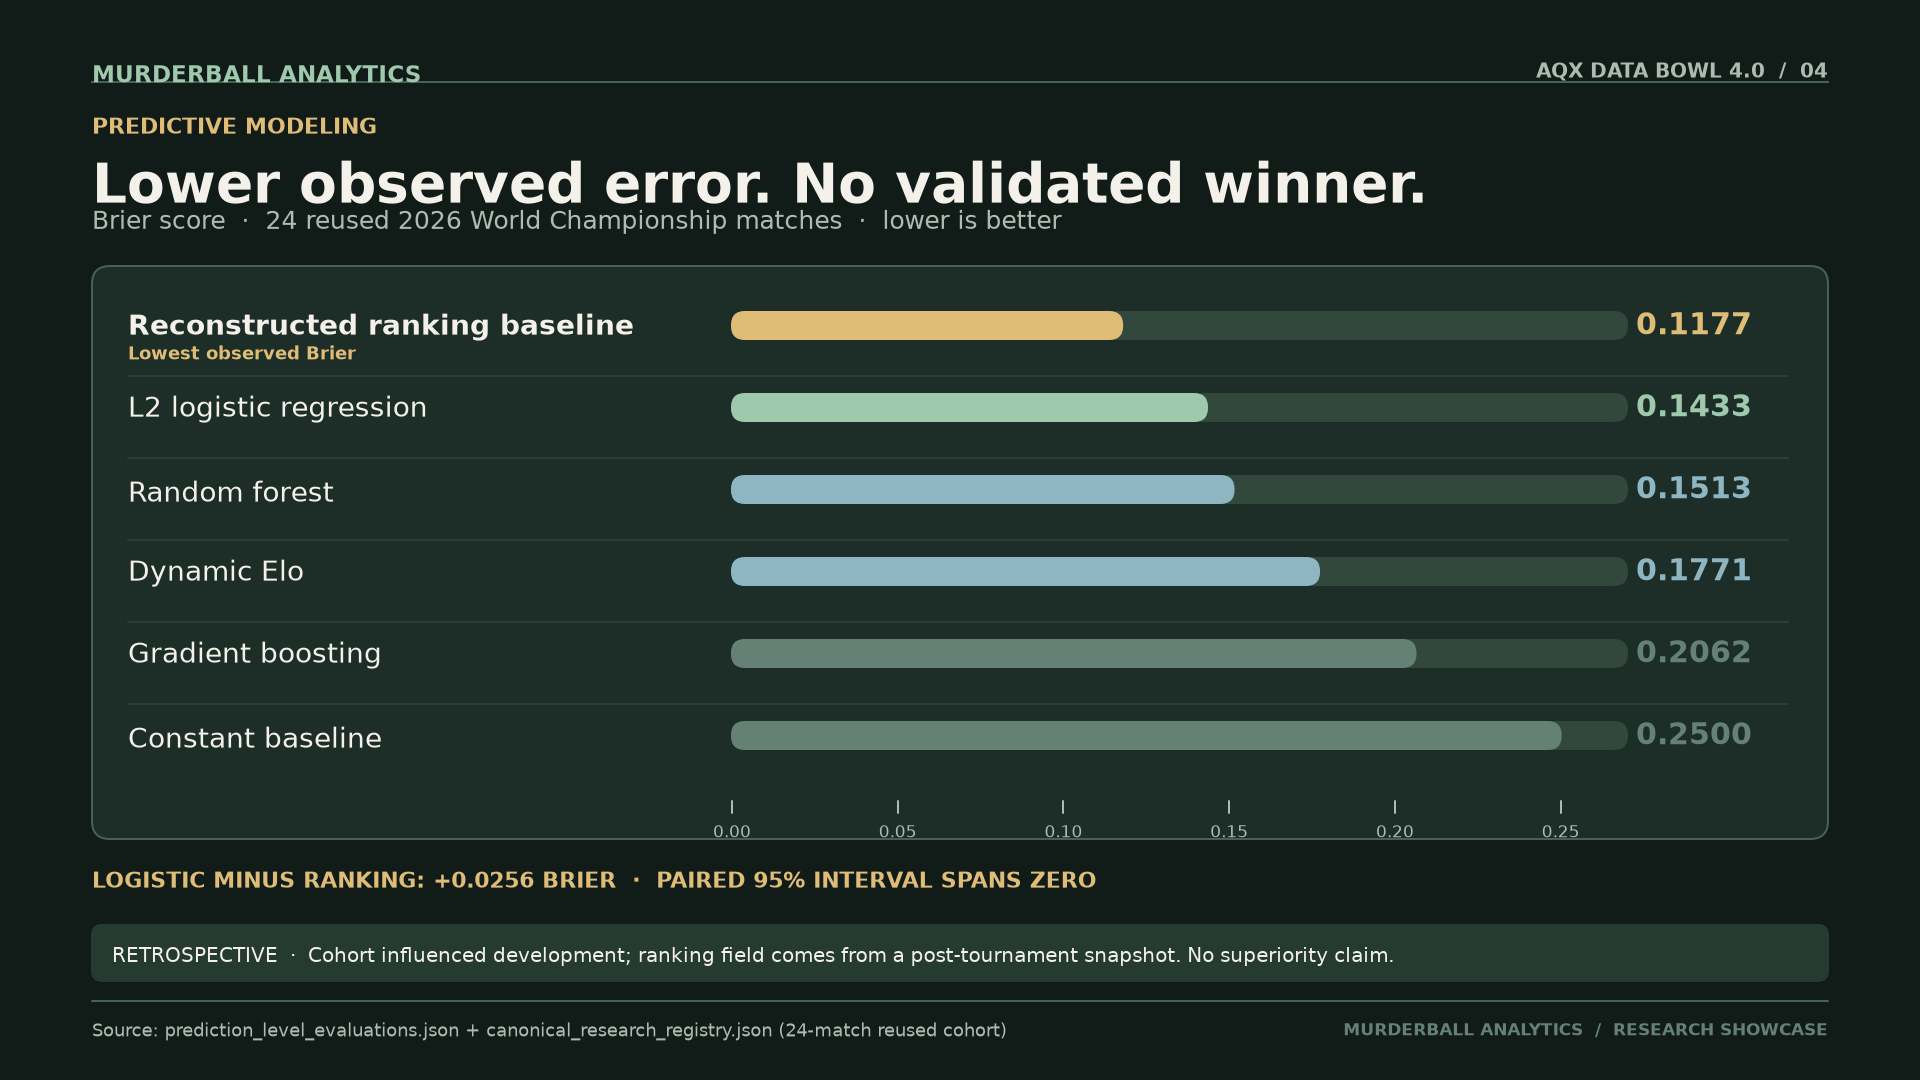
Six prediction approaches compared by Brier score. The lowest observed error does not establish a proven winner.
-
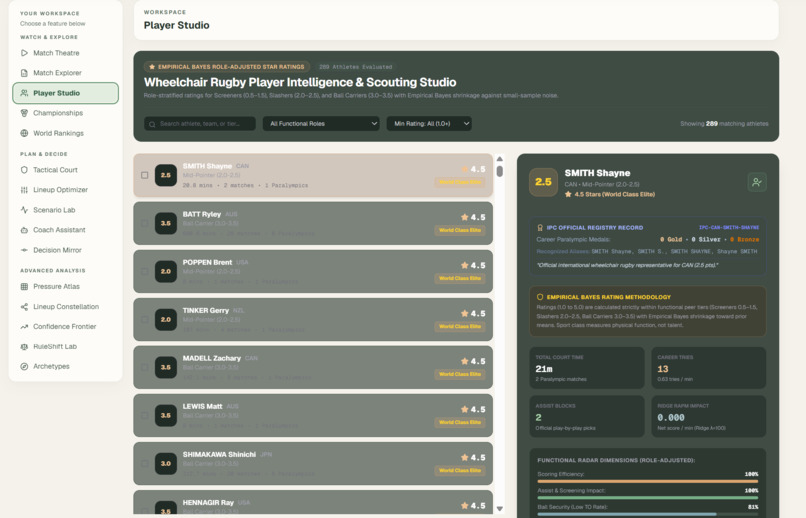
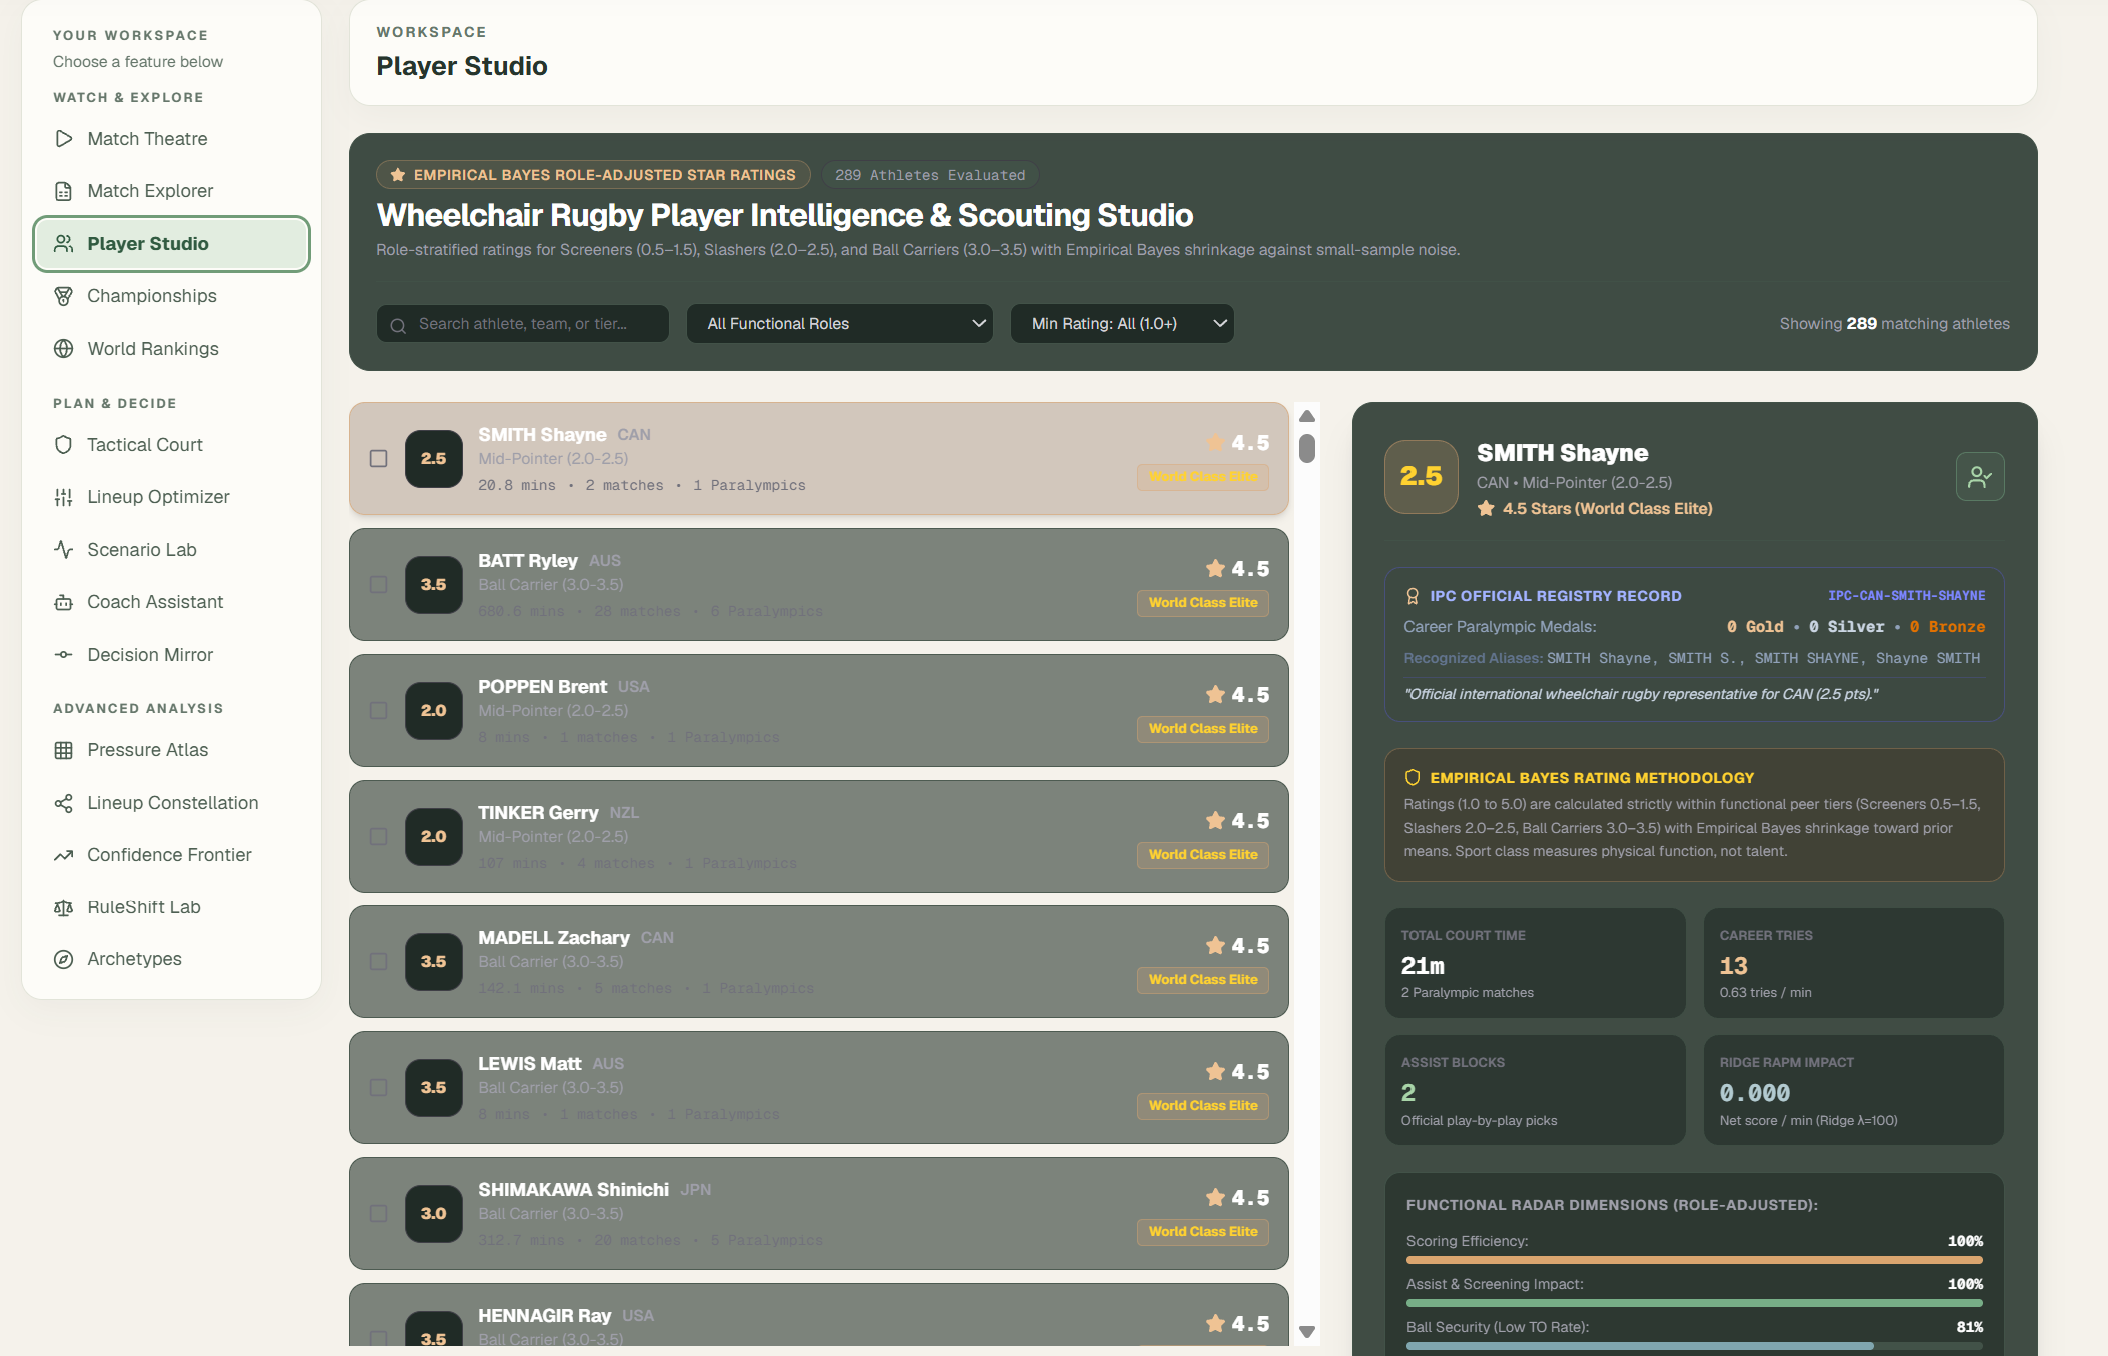
Player Studio highlights classifications, recorded contributions, and exploratory player impact estimates.
-
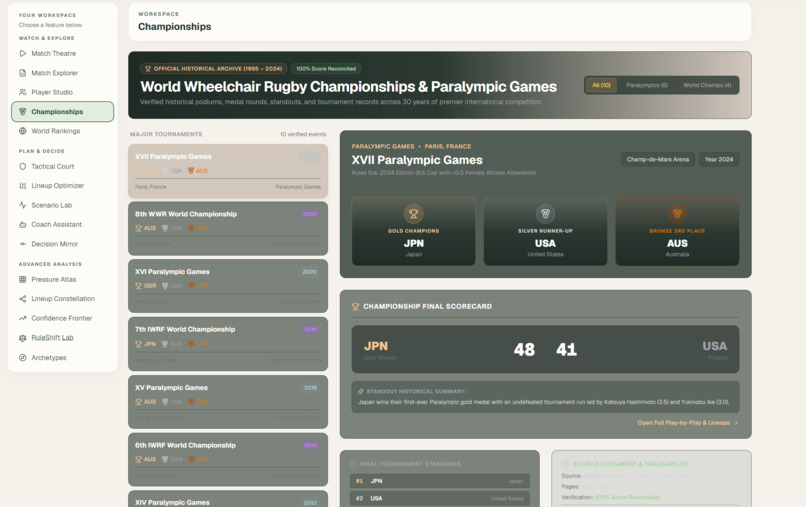
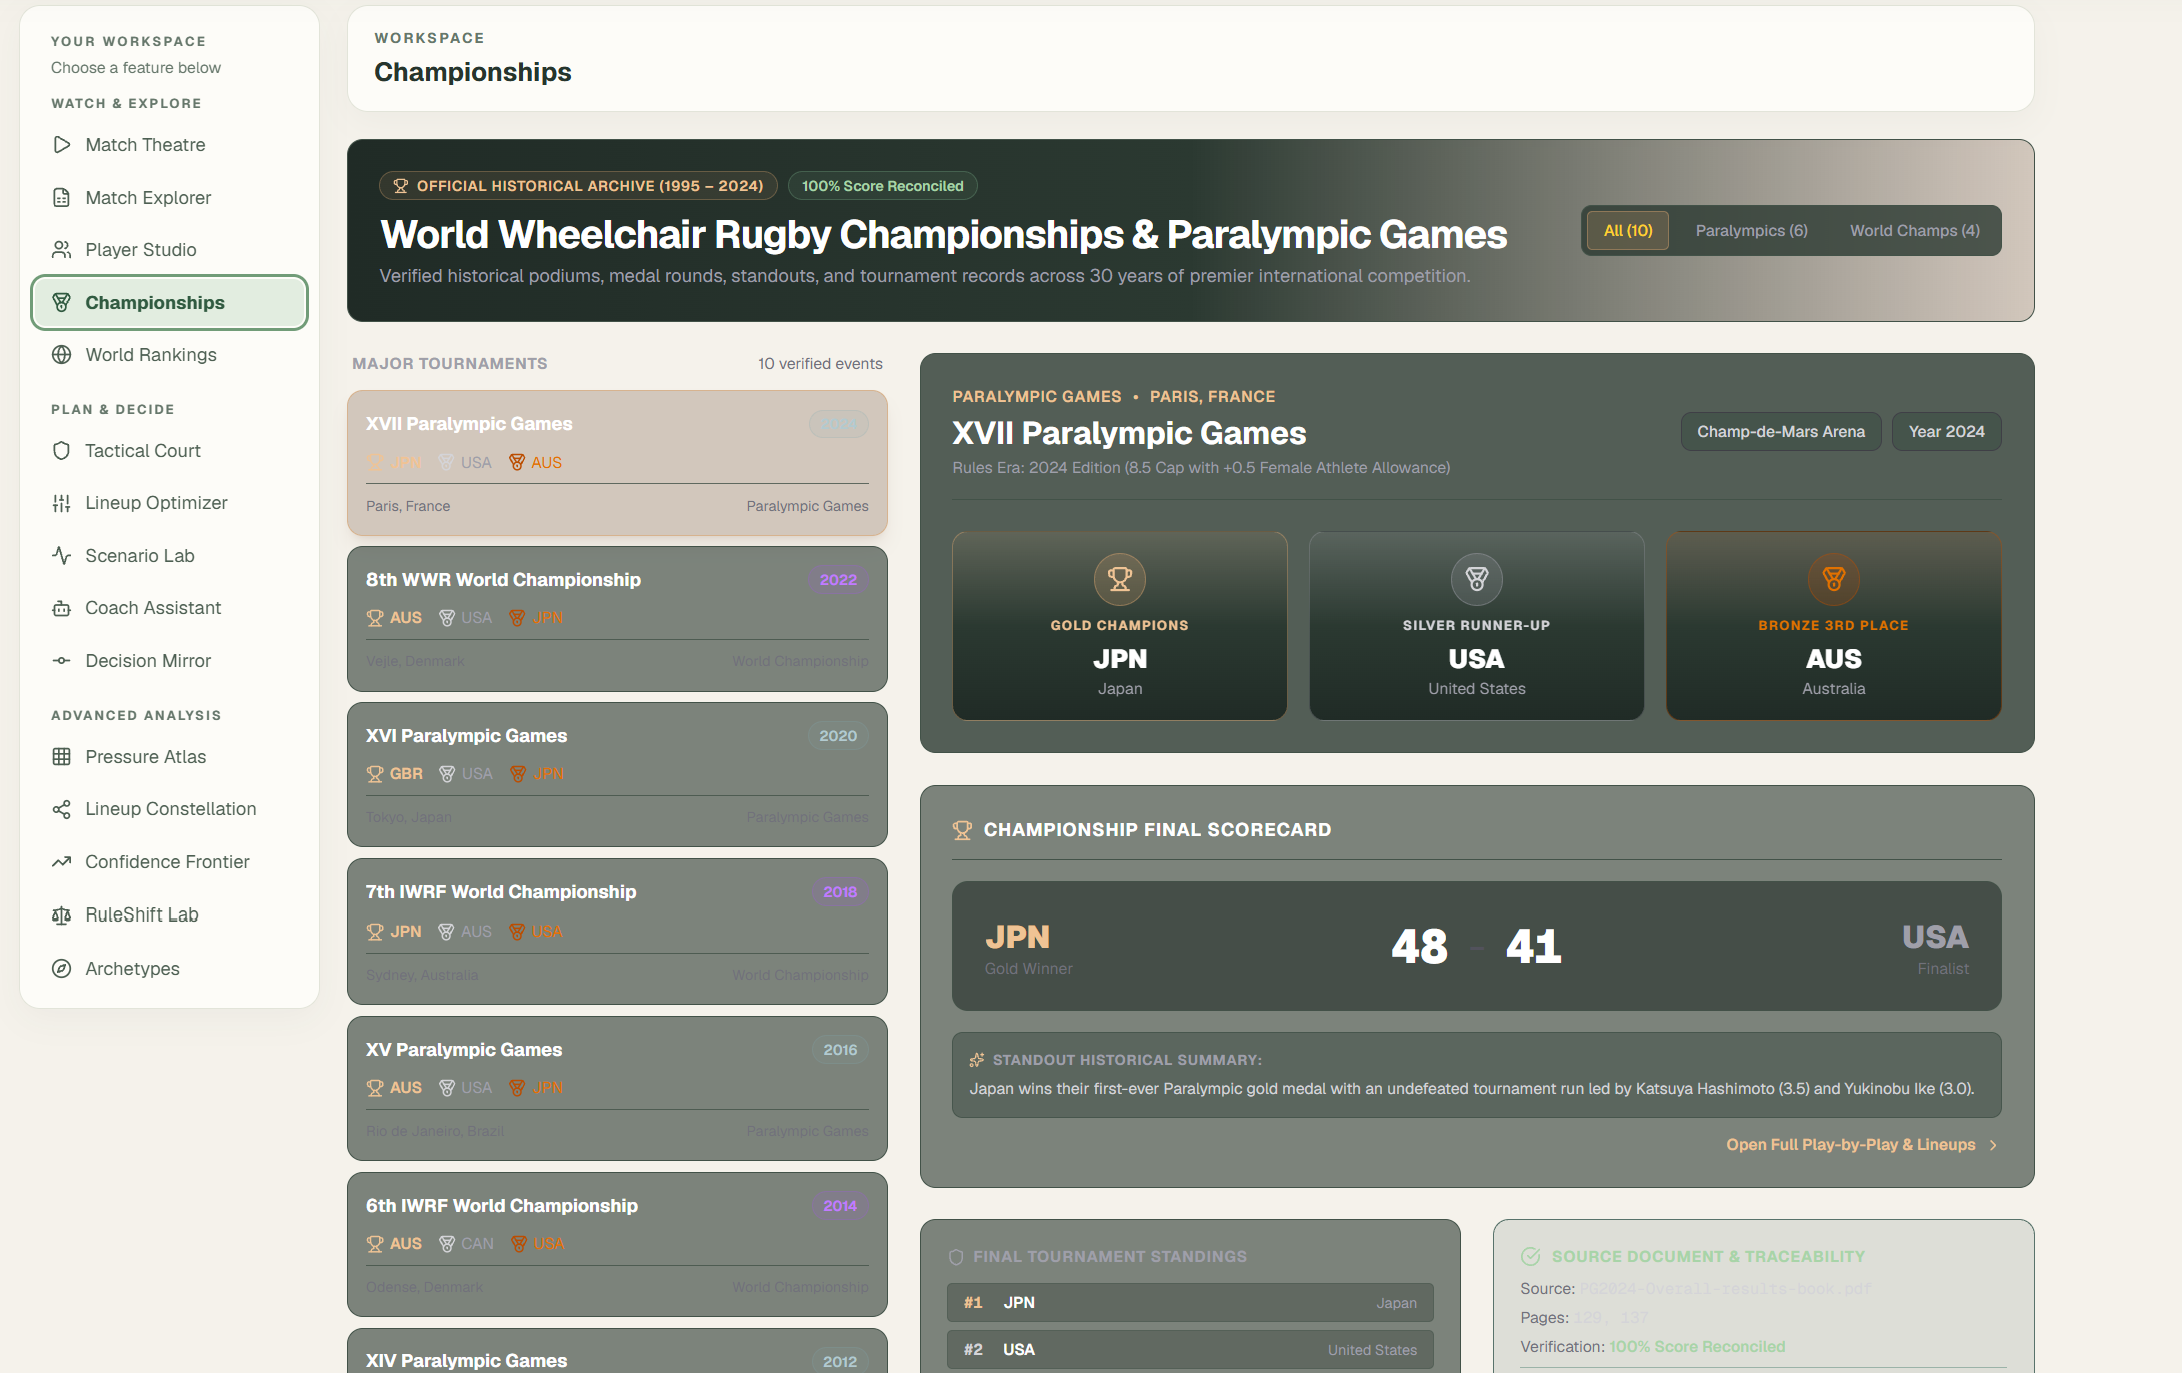
Explore sourced tournament results, standings, and medal histories in one interactive Championships view.

MurderBall: Wheelchair Rugby Intelligence
Beyond the scoreboard. Understanding the contributions, patterns, and decisions that shape wheelchair rugby.
Take a look at the attached images too! They showcase the research findings, visualizations, and the platform in action. :)
What Is MurderBall?
Wheelchair rugby, often nicknamed Murderball, is one of the most intense sports in the Paralympic Games.
Four athletes compete for each team on court, and their functional classifications determine which combinations are permitted under the sport's point limits.
But there's something interesting about wheelchair rugby: the scoreboard tells us who scored, not everything that helped make it happen.
Behind every match are supporting contributions, lineup decisions, defensive actions, and tactical questions that are difficult to understand from final scores alone.
That's why I built MurderBall Analytics, an interactive sports intelligence platform that connects historical wheelchair rugby records with statistical research, match exploration, and coaching decision-support tools.
The goal is simple: make the game easier to investigate, beyond the final score.
Who Is MurderBall For?
Primary End Users
| End User | How MurderBall Helps |
|---|---|
| Coaches | Investigate historical decisions, explore legal lineups, and support tactical preparation with evidence. |
| Team Analysts | Analyze player contributions, lineup combinations, opponent histories, and statistical findings in one place. |
Can Also Be Used By
| Users | Potential Benefits |
|---|---|
| Athletes | Understand recorded contributions beyond scoring totals. |
| Federations | Support scouting discussions, player evaluation, and historical performance reviews. |
| Researchers and Broadcasters | Explore structured match records, statistical findings, and historical narratives. |
Practical and Business Impact
For coaches and analysts, MurderBall brings scattered historical records into one searchable, interactive workspace. It can reduce manual research, support more consistent player evaluations, and make match preparation more evidence-informed.
The value is simple: less time searching through records, more time understanding the game.
These are intended benefits, not yet independently measured improvements in efficiency or match outcomes.
The Problem
Traditional performance analysis naturally emphasizes tries, final scores, and victories.
But wheelchair rugby depends on much more.
A player who scores frequently and a player who contributes through blocking may perform very different roles.
Historical records also contain valuable information about substitutions, turnovers, playing combinations, and match situations. Yet these records are often difficult to reconstruct and investigate.
This creates three challenges:
- Incomplete performance visibility: Scoring totals alone cannot describe every recorded contribution.
- Fragmented historical evidence: Match data is scattered across different documents and competitions.
- Limited decision exploration: Coaches need accessible ways to examine historical events and legal lineup alternatives.
The central research question became:
Can historical wheelchair rugby data reveal overlooked contributions and support better coaching questions, without overstating what the evidence proves?
What I Built
MurderBall brings historical analysis, statistical research, and coaching exploration into one platform.
1. Historical Match Intelligence
Match Theatre reconstructs available historical match information through interactive timelines, scores, recorded events, substitutions, and lineups.
Users can revisit significant matches, explore tournament histories, and investigate the events surrounding important moments.
Match Explorer, Player Studio, Championships, and World Rankings provide additional ways to navigate the historical archive.
2. Statistical Research and Discovery
The Research Hub presents statistical investigations, player contributions, lineup patterns, and predictive model comparisons.
Instead of displaying isolated numbers, it connects findings to their datasets, assumptions, and limitations.
Supporting tools include Data Quality, Lineup Constellation, Confidence Frontier, and other research views.
3. Coaching and Tactical Exploration
Several tools translate research into practical questions.
- Decision Mirror: Examines recorded match decisions alongside clearly labeled hypothetical alternatives.
- Tactical Court: Lets users explore four-player arrangements and classification constraints.
- Lineup Optimizer: Searches feasible player combinations using mathematical optimization.
- Scenario Lab: Simulates possible match continuations under modeled assumptions.
- Pressure Atlas: Explores observed scoring and turnover patterns in different match situations.
These tools are designed for exploration, not guaranteed tactical prescriptions.
4. AI Coach and Jev-Style Decision Pipeline
MurderBall also includes an evidence-guided Coach Assistant.
The assistant routes questions toward match, lineup, scouting, and research tools, then presents relevant information alongside citations, evidence gaps, and an execution trace.
Its TypeSafe Jev-style pipeline uses typed Choice, Noul, and Score operations for routing, ambiguity handling, and evidence assessment.
The current adapter runs deterministically offline. Live remote Jev API calls are not implemented in this release.
This allows the prototype to demonstrate structured coaching workflows without presenting its internal evidence scores as win probabilities or proven tactical recommendations.
The Discovery That Changed My Perspective
One of the most interesting findings emerged from official Assist Block statistics.
Across 44 Paralympic matches from Athens 2004 and Beijing 2008, athletes classified as 0.5 recorded:
| Metric | Class 0.5 Athletes | Total | Share |
|---|---|---|---|
| Assist Blocks | 364 | 1,296 | 28.1% |
| Tries | 3 | 2,459 | 0.12% |
Class 0.5 represents one of the lowest functional classifications in wheelchair rugby. It is not a measure of skill or player quality.
These athletes accounted for a substantial proportion of recorded Assist Blocks despite scoring very few tries themselves.
This reveals a striking difference between recorded supporting contributions and direct scoring.
It suggests that judging athletes solely by tries can overlook important aspects of their recorded roles.
However, official box scores do not provide the spatial tracking required to establish that particular blocks created scoring opportunities.
The finding describes an association, not a causal mechanism.
Why This Matters
A coach evaluating a low-point athlete may need to consider more than scoring output.
MurderBall makes it easier to investigate those additional recorded contributions.
From Historical Evidence to Coaching Questions
Consider the Paris 2024 Paralympic gold medal match between Japan and the United States.
With 5:31 remaining in the fourth quarter, Japan led 39–34.
The official match record shows a USA timeout and substitution.
MurderBall lets users investigate that moment through a connected workflow:
- Match Theatre displays the recorded match situation and subsequent events.
- Decision Mirror separates what actually happened from hypothetical lineup alternatives.
- Tactical Court allows users to explore possible four-player arrangements.
- Lineup Optimizer identifies combinations satisfying the selected classification constraints.
The system does not claim that a different substitution would have changed the result.
Instead, it helps coaches examine historical evidence and explore alternative possibilities.
The Data Behind MurderBall
The core historical archive covers 120 matches across six Paralympic Games, from Athens 2004 to Paris 2024.
All 120 final scores were reconciled against official results.
| Data Component | Coverage |
|---|---|
| Detailed Paralympic matches | 120 |
| Paralympic tournaments | 6 |
| Reconciled final scores | 120/120 |
| Reconstructed lineup stints | 5,148 |
| Additional 2026 World Championship matches | 46 |
| Additional invitational matches | 37 |
Additional competitions have different levels of statistical detail and are not treated as equivalent to the detailed Paralympic archive.
The data pipeline extracts match information, reconstructs available event sequences and lineup stints, validates recorded scores, and preserves source references.
Historical data completeness varies by tournament. In particular, athlete-minute reconciliation and spatial validation have narrower coverage.
The research primarily uses published records from World Wheelchair Rugby and other official competition sources.
Technical Research and Methodology
The following section documents the mathematical and statistical methods behind MurderBall.
1. Assist Block Analysis
The proportion of recorded Assist Blocks attributed to class 0.5 athletes was calculated as:
$$ AB = \frac{364}{1296} \times 100 = 28.1\% $$
The corresponding try share was:
$$ T = \frac{3}{2459} \times 100 = 0.12\% $$
A Pearson chi-square comparison of the classification distributions across these recorded event types produced:
| Statistical Measure | Result |
|---|---|
| Chi-square | 1177.72 |
| Degrees of freedom | 6 |
| p-value | 3.18 × 10⁻²⁵¹ |
| Cramér's V | 0.56 |
The results indicate a strong descriptive association between functional classification and recorded event type.
They do not establish causation or identify the spatial mechanism behind scoring.
2. Custom Role-Adjusted Player Ratings
A central design challenge was creating an exploratory rating system that did not automatically favor athletes whose roles involve scoring.
MurderBall implements role-adjusted player ratings using recorded events, reconstructed playing time, and regularized on-court impact estimates.
Athletes are grouped into three functional-class bands.
| Role | Classification | Primary Emphasis |
|---|---|---|
| Low-pointer | 0.5–1.5 | Blocking events, ball security, on-court impact |
| Mid-pointer | 2.0–2.5 | Scoring, defense, on-court impact |
| High-pointer | 3.0–3.5 | Scoring, defense, on-court impact |
Sample-Size Adjustment
A player with limited recorded minutes can have an unusually high or low raw performance rate.
To reduce this instability, the implementation blends observed rates with averages from the corresponding role group.
$$ X = \frac{m}{m+24}r + \frac{24}{m+24}u $$
Where:
- X = adjusted metric
- m = reconstructed playing minutes
- r = athlete's observed performance rate
- u = average performance rate for the athlete's role group
- 24 = chosen prior weight in minutes
Players with less recorded playing time receive greater adjustment toward their role average.
The 24-minute parameter is a design choice rather than a value independently optimized through prospective validation.
Weighted Composite Ratings
Adjusted metrics are transformed into bounded component scores before being combined.
For example, the low-pointer composite is:
$$ S = 0.35B + 0.25R + 0.20Q + 0.15D + 0.05T $$
Where:
- B: Normalized recorded block-event component
- R: Regularized adjusted plus-minus component
- Q: Ball-security component
- D: Defensive event component
- T: Scoring component
The composite is then mapped to a five-star scale:
$$ StarScore = 1 + \frac{4S}{100} $$
The implementation rounds this value to the nearest half-star and bounds it between 1 and 5.
Different role groups use different component weights.
These weights, scaling thresholds, and resulting stars are custom analytical heuristics, not official classifications or independently validated measures of player quality.
The block-event input used in this rating pipeline is also distinct from the official Assist Block box-score cohort discussed earlier.
The complete calculation is available in the player-rating implementation.
3. Classification-Constrained Lineup Optimization
MurderBall uses Google OR-Tools CP-SAT to explore legal four-player combinations.
Each selected lineup must contain exactly four athletes:
$$ \sum_i x_i = 4 $$
The selected athletes must also satisfy the applicable classification limit:
$$ \sum_i c_i x_i \leq C + \sum_i a_i x_i $$
Where:
- x: Athlete selection indicator
- c: Athlete classification
- C: Applicable base classification cap
- a: Applicable rule-based allowance
The optimizer uses a custom weighted objective combining classification-related terms and available player impact estimates.
Offensive, defensive, and balanced modes apply different weights.
The resulting objective score is not a predicted win probability. It ranks combinations according to the selected mathematical objective, not independently demonstrated real-world tactical effectiveness.
4. Machine Learning Evaluation
Six predictive approaches were compared using the Brier score, a measure of probability prediction error.
$$ BS = \frac{1}{N}\sum_{i=1}^{N}(p_i-y_i)^2 $$
Where:
- N: Number of evaluated predictions
- p: Predicted probability
- y: Actual outcome, represented as 0 or 1
A lower score indicates lower observed probability error.
Model Comparison
| Model | Brier Score | Accuracy |
|---|---|---|
| Reconstructed-rank baseline | 0.1177 | 87.5% |
| L2 Logistic Regression | 0.1433 | 79.2% |
| Random Forest | 0.1513 | 66.7% |
| Dynamic Elo | 0.1771 | 70.8% |
| Gradient Boosting | 0.2062 | 75.0% |
| Constant 50/50 baseline | 0.2500 | 37.5% |
The reconstructed-ranking baseline achieved the lowest observed Brier score.
However, the evaluation used 24 retrospective matches that had already influenced development.
The ranking feature was also reconstructed from a post-tournament ranking snapshot rather than a separately archived pre-event publication.
The paired logistic-minus-baseline comparison produced:
| Measure | Result |
|---|---|
| Mean Brier difference | +0.0256 |
| p-value | 0.5539 |
| 95% confidence interval | [−0.0626, +0.1139] |
Because the interval crosses zero, the results do not establish predictive superiority.
This was an important lesson from the project: a more complex model is not necessarily a better predictive model.
5. Additional Statistical Findings
| Research Question | Result | Interpretation |
|---|---|---|
| Do timeouts demonstrate a measurable benefit? | Adjusted p = 0.66 | Observational evidence is inconclusive |
| Does classification dispersion correlate with lineup performance? | r = −0.0034, p = 0.9117 | No detectable linear association |
| Are female-inclusive lineup outcomes equivalent? | Difference = −0.0078 tries/min; p = 0.8923 | Equivalence is not established |
| Can regularization stabilize adjusted plus-minus? | Ridge implementation, λ = 100 | Stabilizes the evaluated design; other estimators remain possible |
These findings are presented as research evidence rather than universal coaching rules.
Limitations and Research Integrity
Historical sports analytics requires careful interpretation.
- Match and athlete statistics vary in completeness across tournaments.
- Reconstructed lineups do not constitute verified spatial tracking.
- Available broadcast footage is not necessarily synchronized with event timelines.
- Observational findings cannot establish causal relationships.
- Custom rating weights and lineup objectives require additional external validation.
- The predictive evaluation is small, retrospective, and development-influenced.
The platform makes these distinctions visible throughout its research and coaching interfaces.
Automated tests, production-build checks, and browser verification were also performed to assess application consistency and functionality.
The aim was not just to generate compelling statistics, but to make the supporting evidence and its limitations inspectable.
What's Next?
MurderBall provides a foundation for further wheelchair rugby research and decision support.
Future work could include:
- Expanding historical event and lineup coverage.
- Improving verified video-to-event synchronization.
- Evaluating models on genuinely unseen future matches.
- Externally validating custom player-impact scores.
- Testing coaching tools against richer match data.
The long-term vision is an accessible sports intelligence environment where historical evidence supports better questions, more informed evaluations, and practical coaching exploration.
Explore MurderBall
Technical Evidence and Reproducibility
The project gallery includes the research graphs, historical match analysis, model comparisons, and screenshots of the interactive platform.
Built With
- ai
- jev
- matplotlib
- nextjs
- numpy
- pandas
- python
- react
- scikit-learn
- sports-data

Log in or sign up for Devpost to join the conversation.