-
-
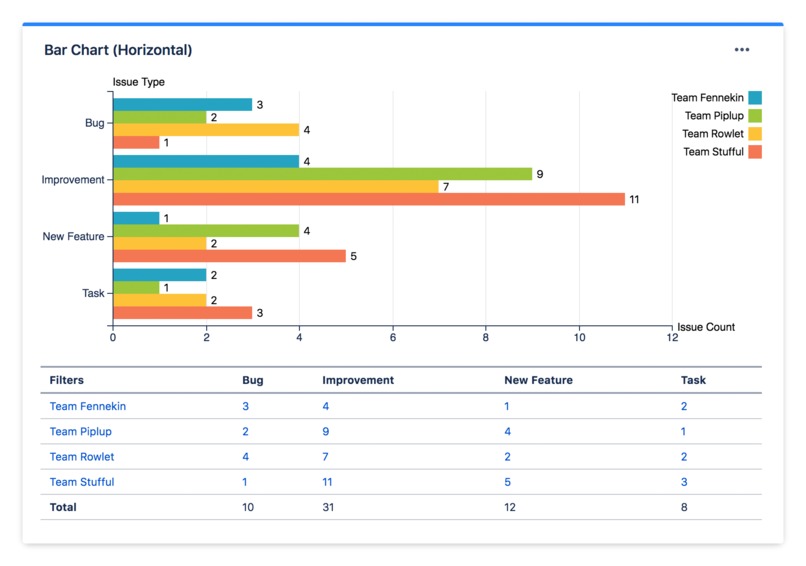
Multiple Filters Statistic Bar Chart Gadget (Horizontal)
-
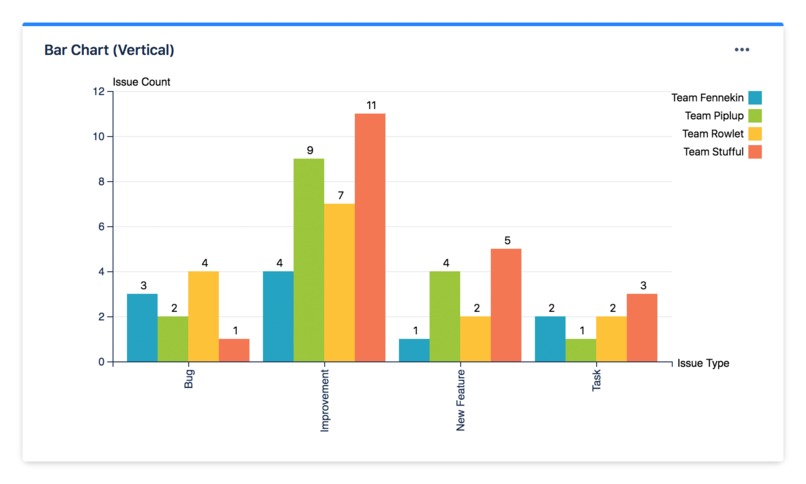
Multiple Filters Statistic Bar Chart Gadget (Vertical)
-
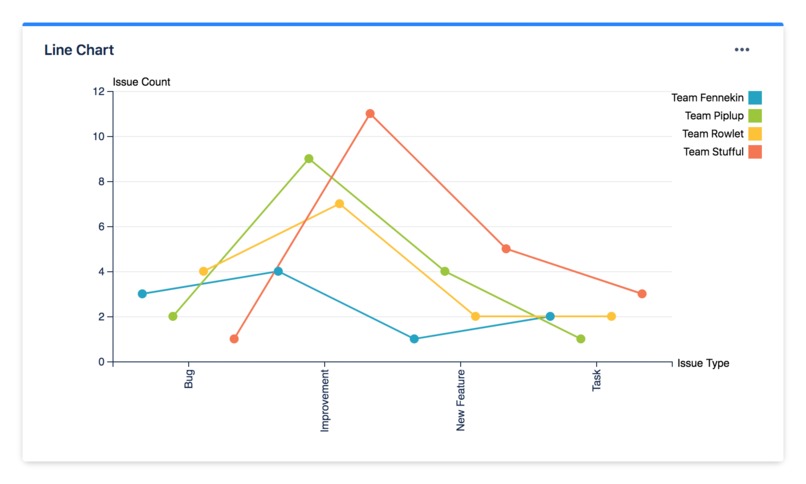
Multiple Filters Statistic Line Chart Gadget
-
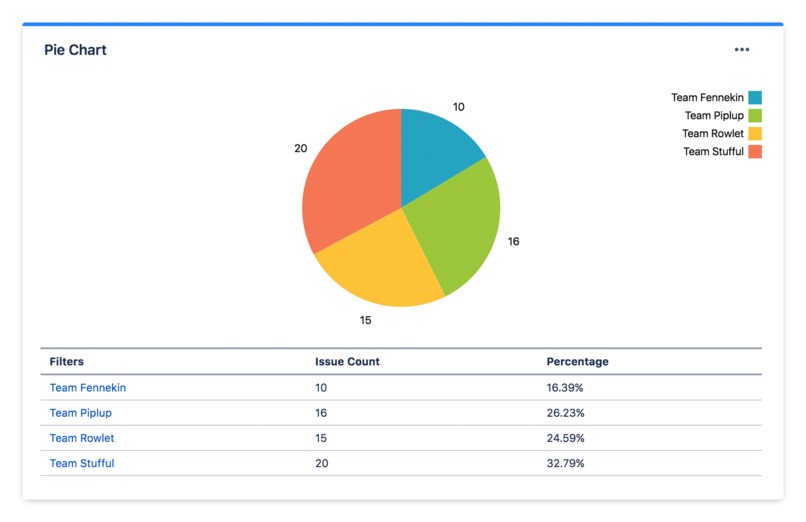
Multiple Filters Pie Chart Gadget


Inspiration
We have a Multiple Filters Chart Gadget server edition and we have requests to port it for Jira Cloud.
What it does
Combine multiple filters into a single chart or data table, grouped by the selected statistic type, and calculated based on issue count, number fields or time fields.
How I built it
Using atlassian-connect-spring-boot
What's next for Multiple Filters Chart Gadget Cloud
Adding charts plotted against selected date fields, which are available in the server edition.
Built With
- atlassian-connect-spring-boot
- java
- javascript
- jira


Log in or sign up for Devpost to join the conversation.