The problem the app solves
Providing reliable answers to questions like:
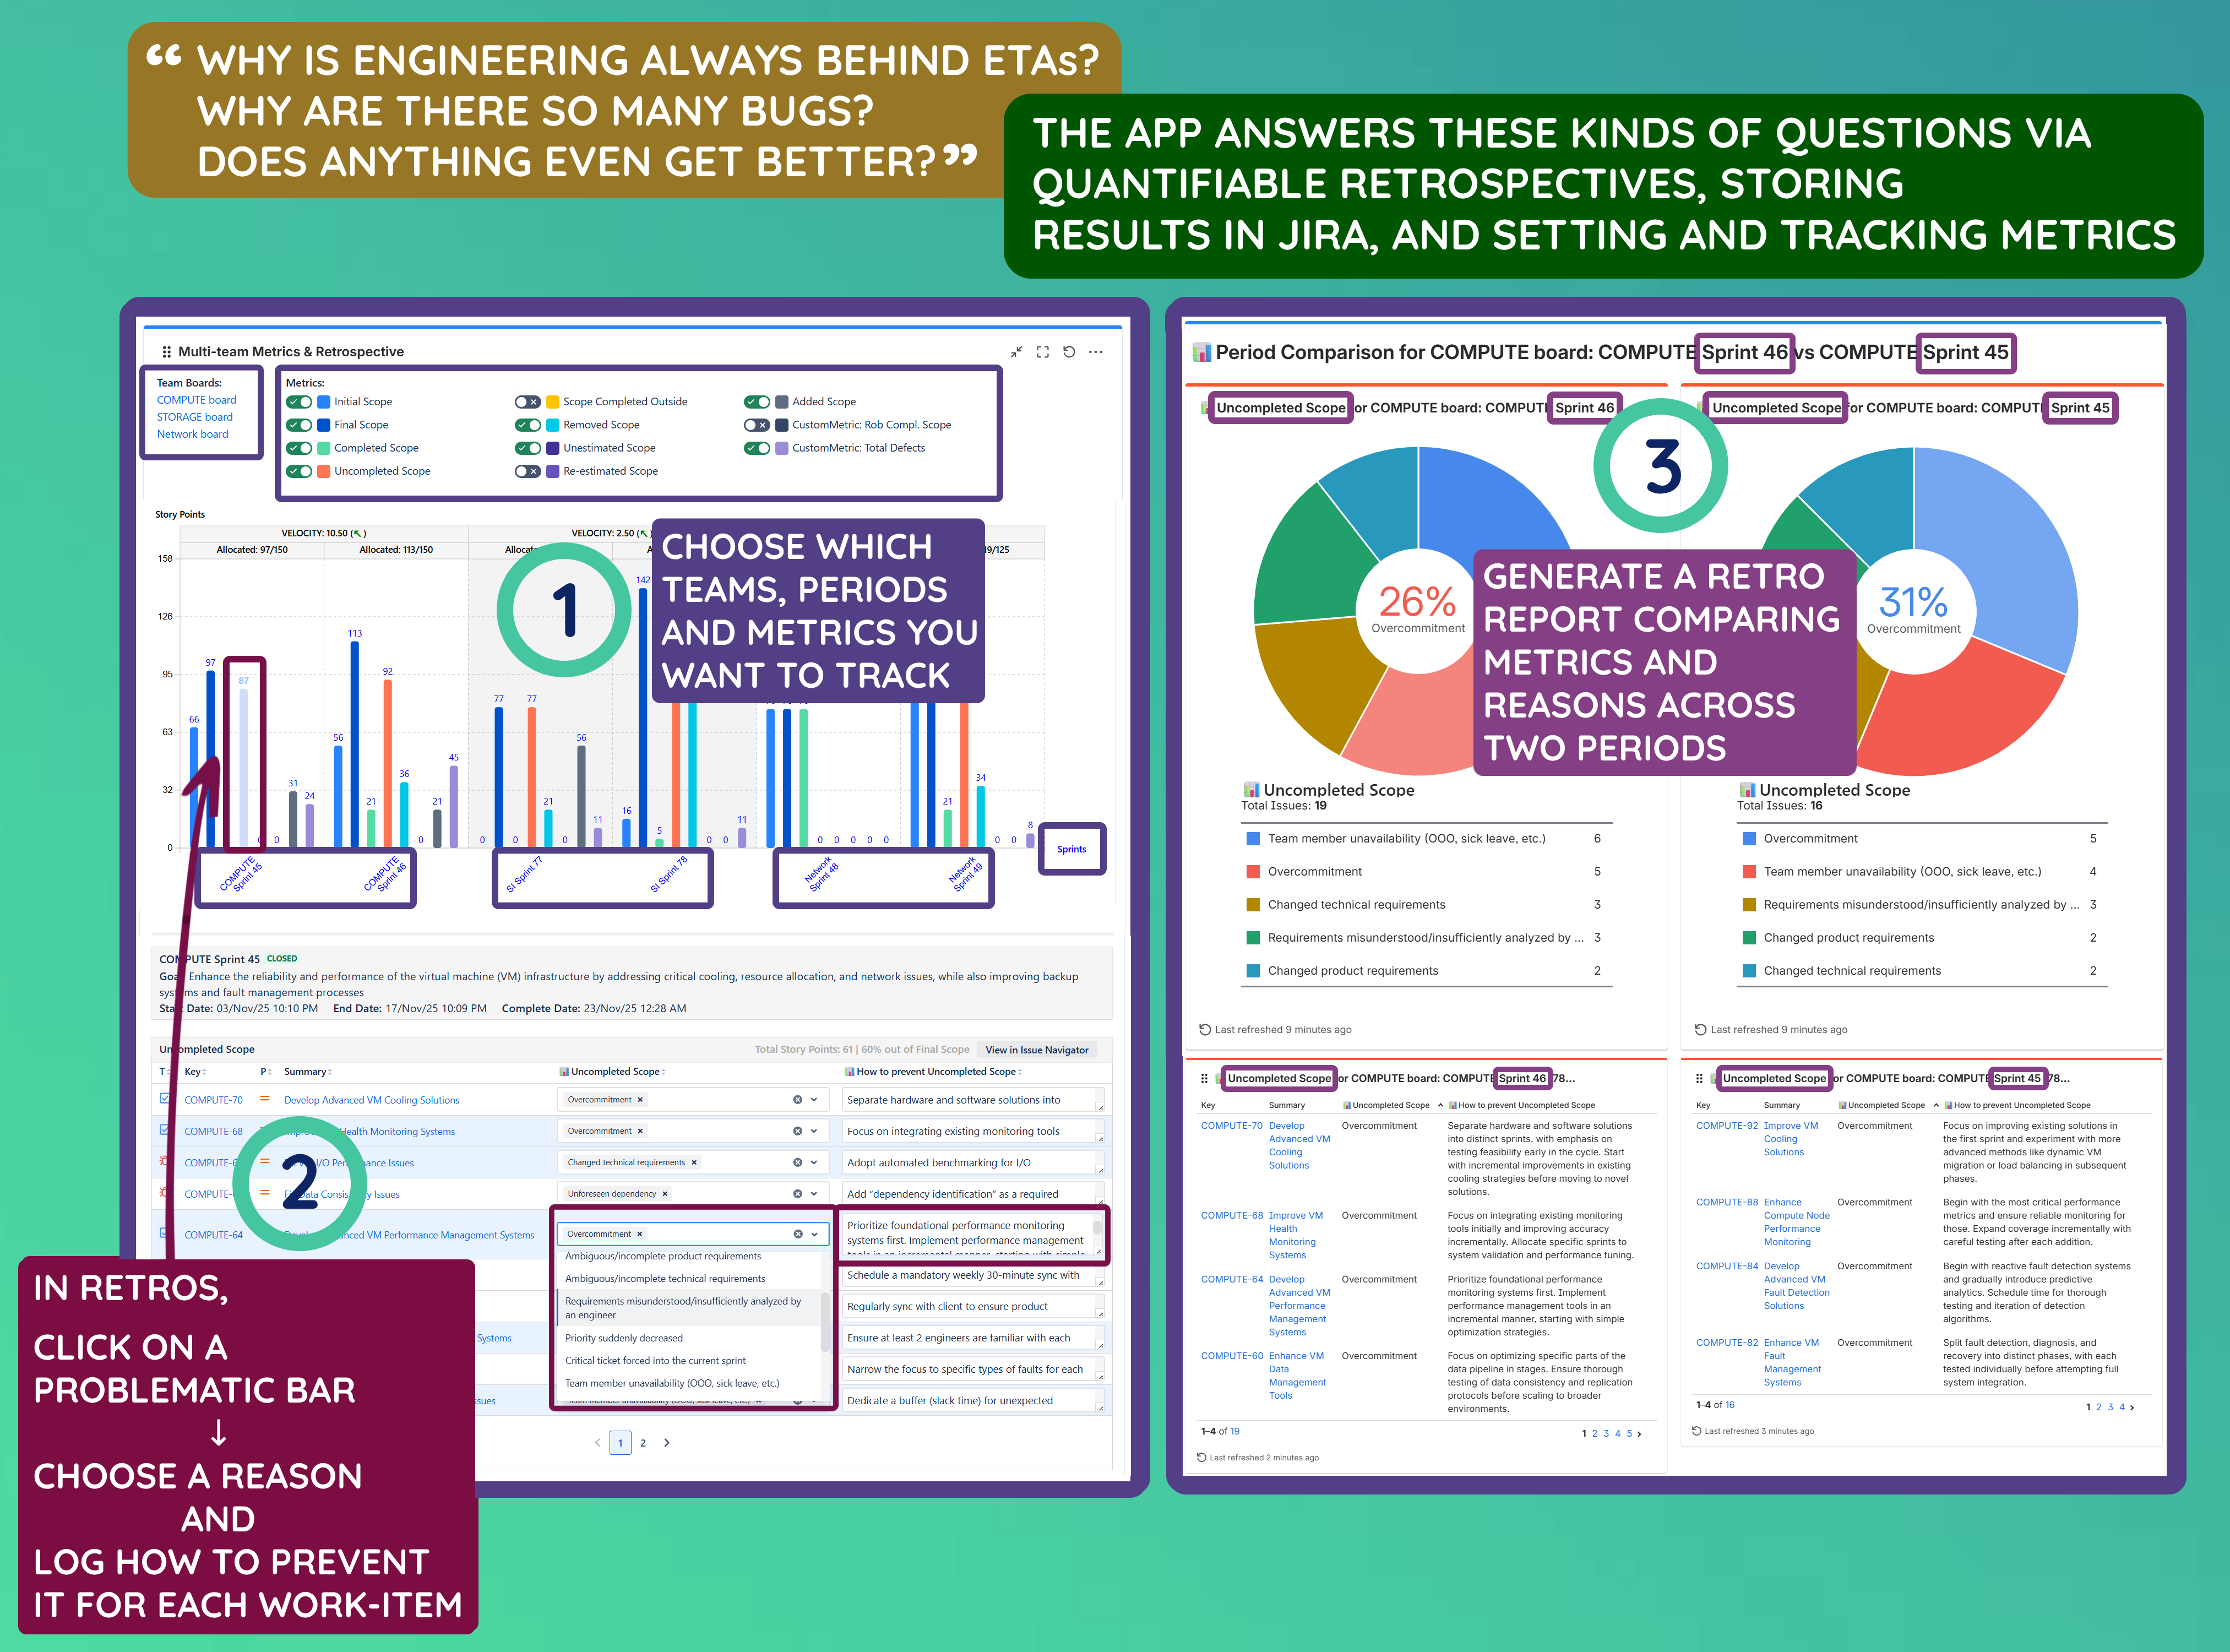
- “Why are we behind our ETA again?”
- “Why do bugs keep slipping through?”
- “Are we actually improving or just repeating the same mistakes?”
via Quantifiable retrospectives - the most liked App Central article for over six months.
Inspiration
Across every company I’ve worked at - Nasdaq, Acronis, RingCentral - I kept running into the same problem: teams genuinely wanted to improve, but the data needed for real improvement simply wasn’t available or connected to everyday work.
Teams could not reliably answer: “Why are we behind our ETA again?”, “Why do bugs keep slipping through?”, “Are we actually improving or just repeating the same mistakes?”
JIRA had powerful building blocks, but native reports and gadgets could never visualize metrics across multiple teams, multiple time periods (sprints, months, quarters, half-years, or years) in a single view, nor quantify why performance dipped. Retrospectives often became subjective discussions disconnected from JIRA data, with no way to measure.
So I built the tool I always wished existed.
Multi-team Sprint/SAFe/Scrum Metrics & Retrospectives is the result of years of real-world frustrations, dozens of organizational transformations, and the desire to finally give teams quantifiable, multi-team, multi-period and retrospective-driven improvement.
What it does
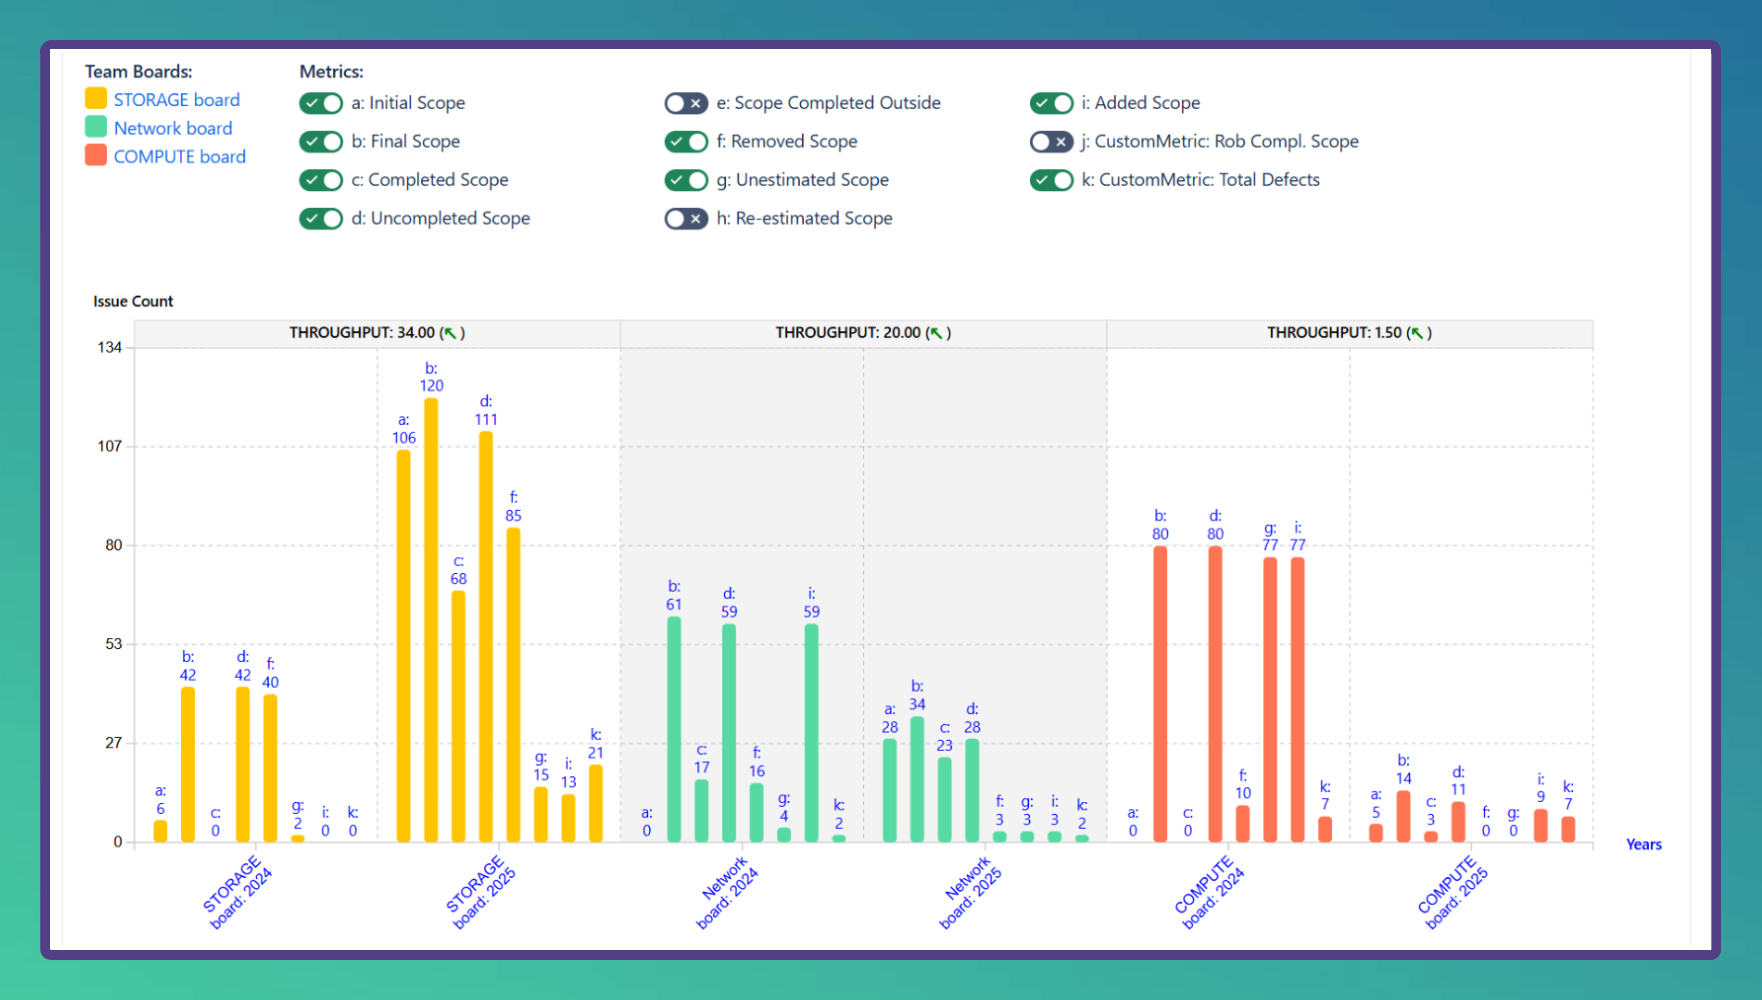
Tracking Any Metric Across Any Period
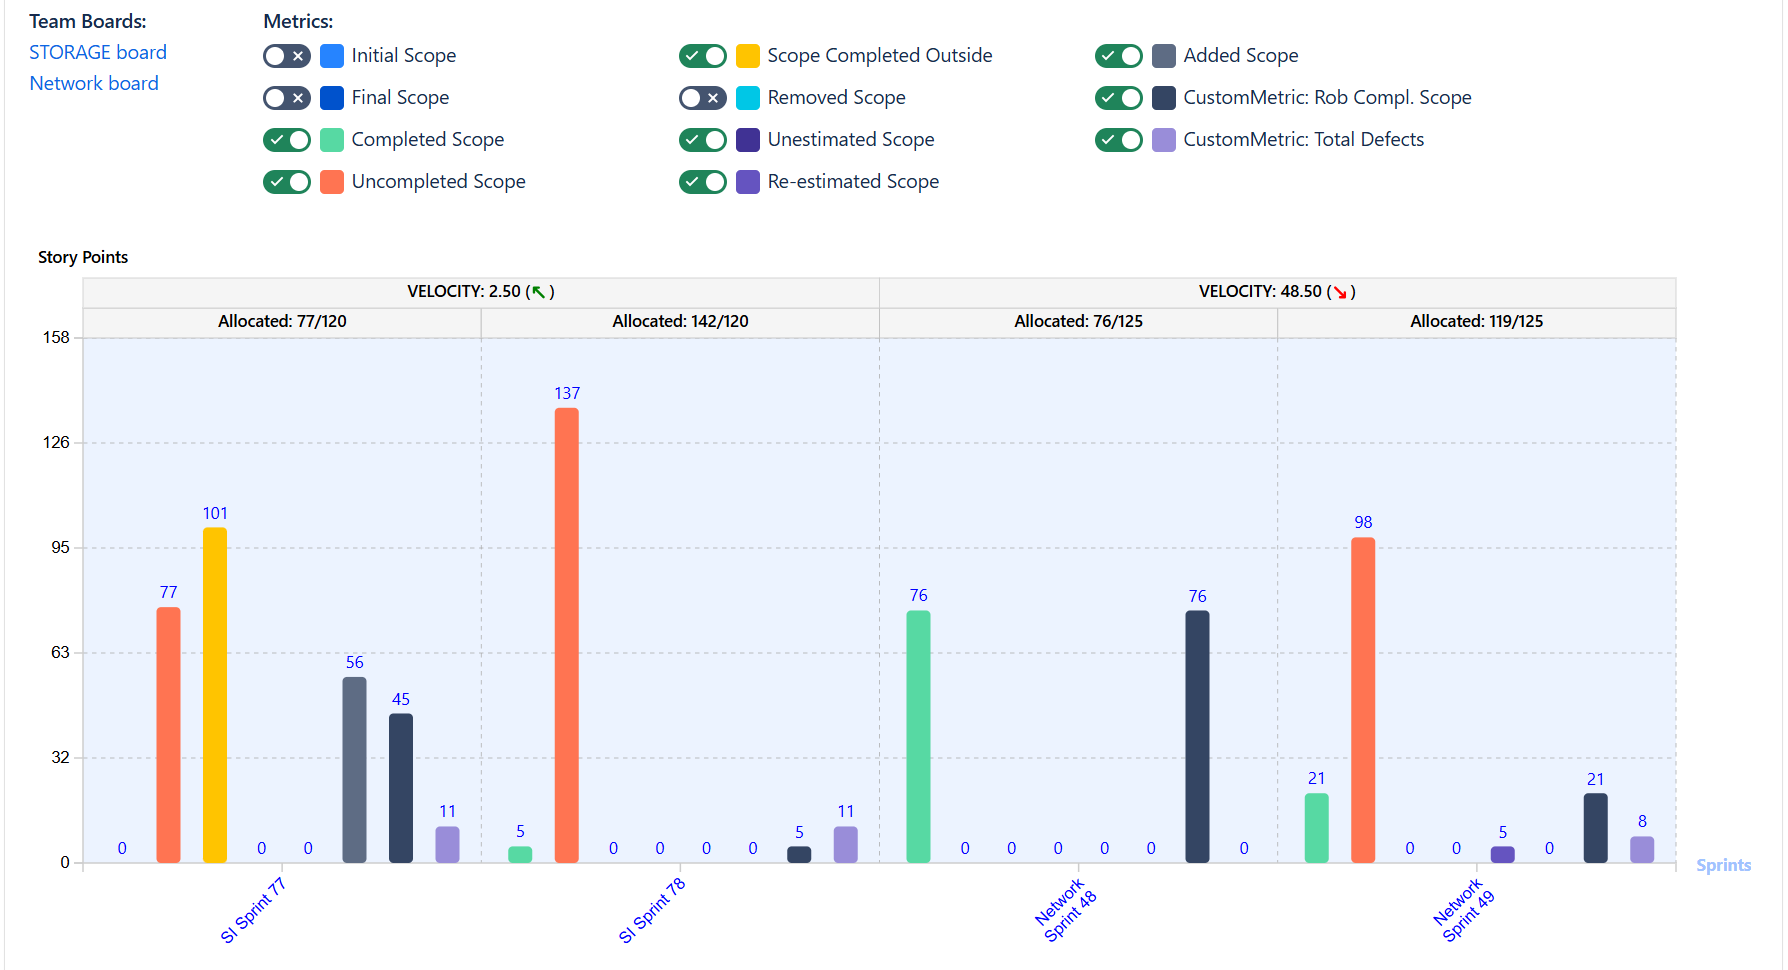
Nine pre-built metrics (Initial Scope, Final Scope, Completed Scope, Uncompleted Scope, Scope Completed Outside, Removed Scope, Unestimated Scope, Re-estimated Scope, Added Scope) + unlimited custom metrics created with JQL.
Metrics can be visualized for:
- Sprints
- Months
- Quarters
- Half-years
- Years
All in one single place.
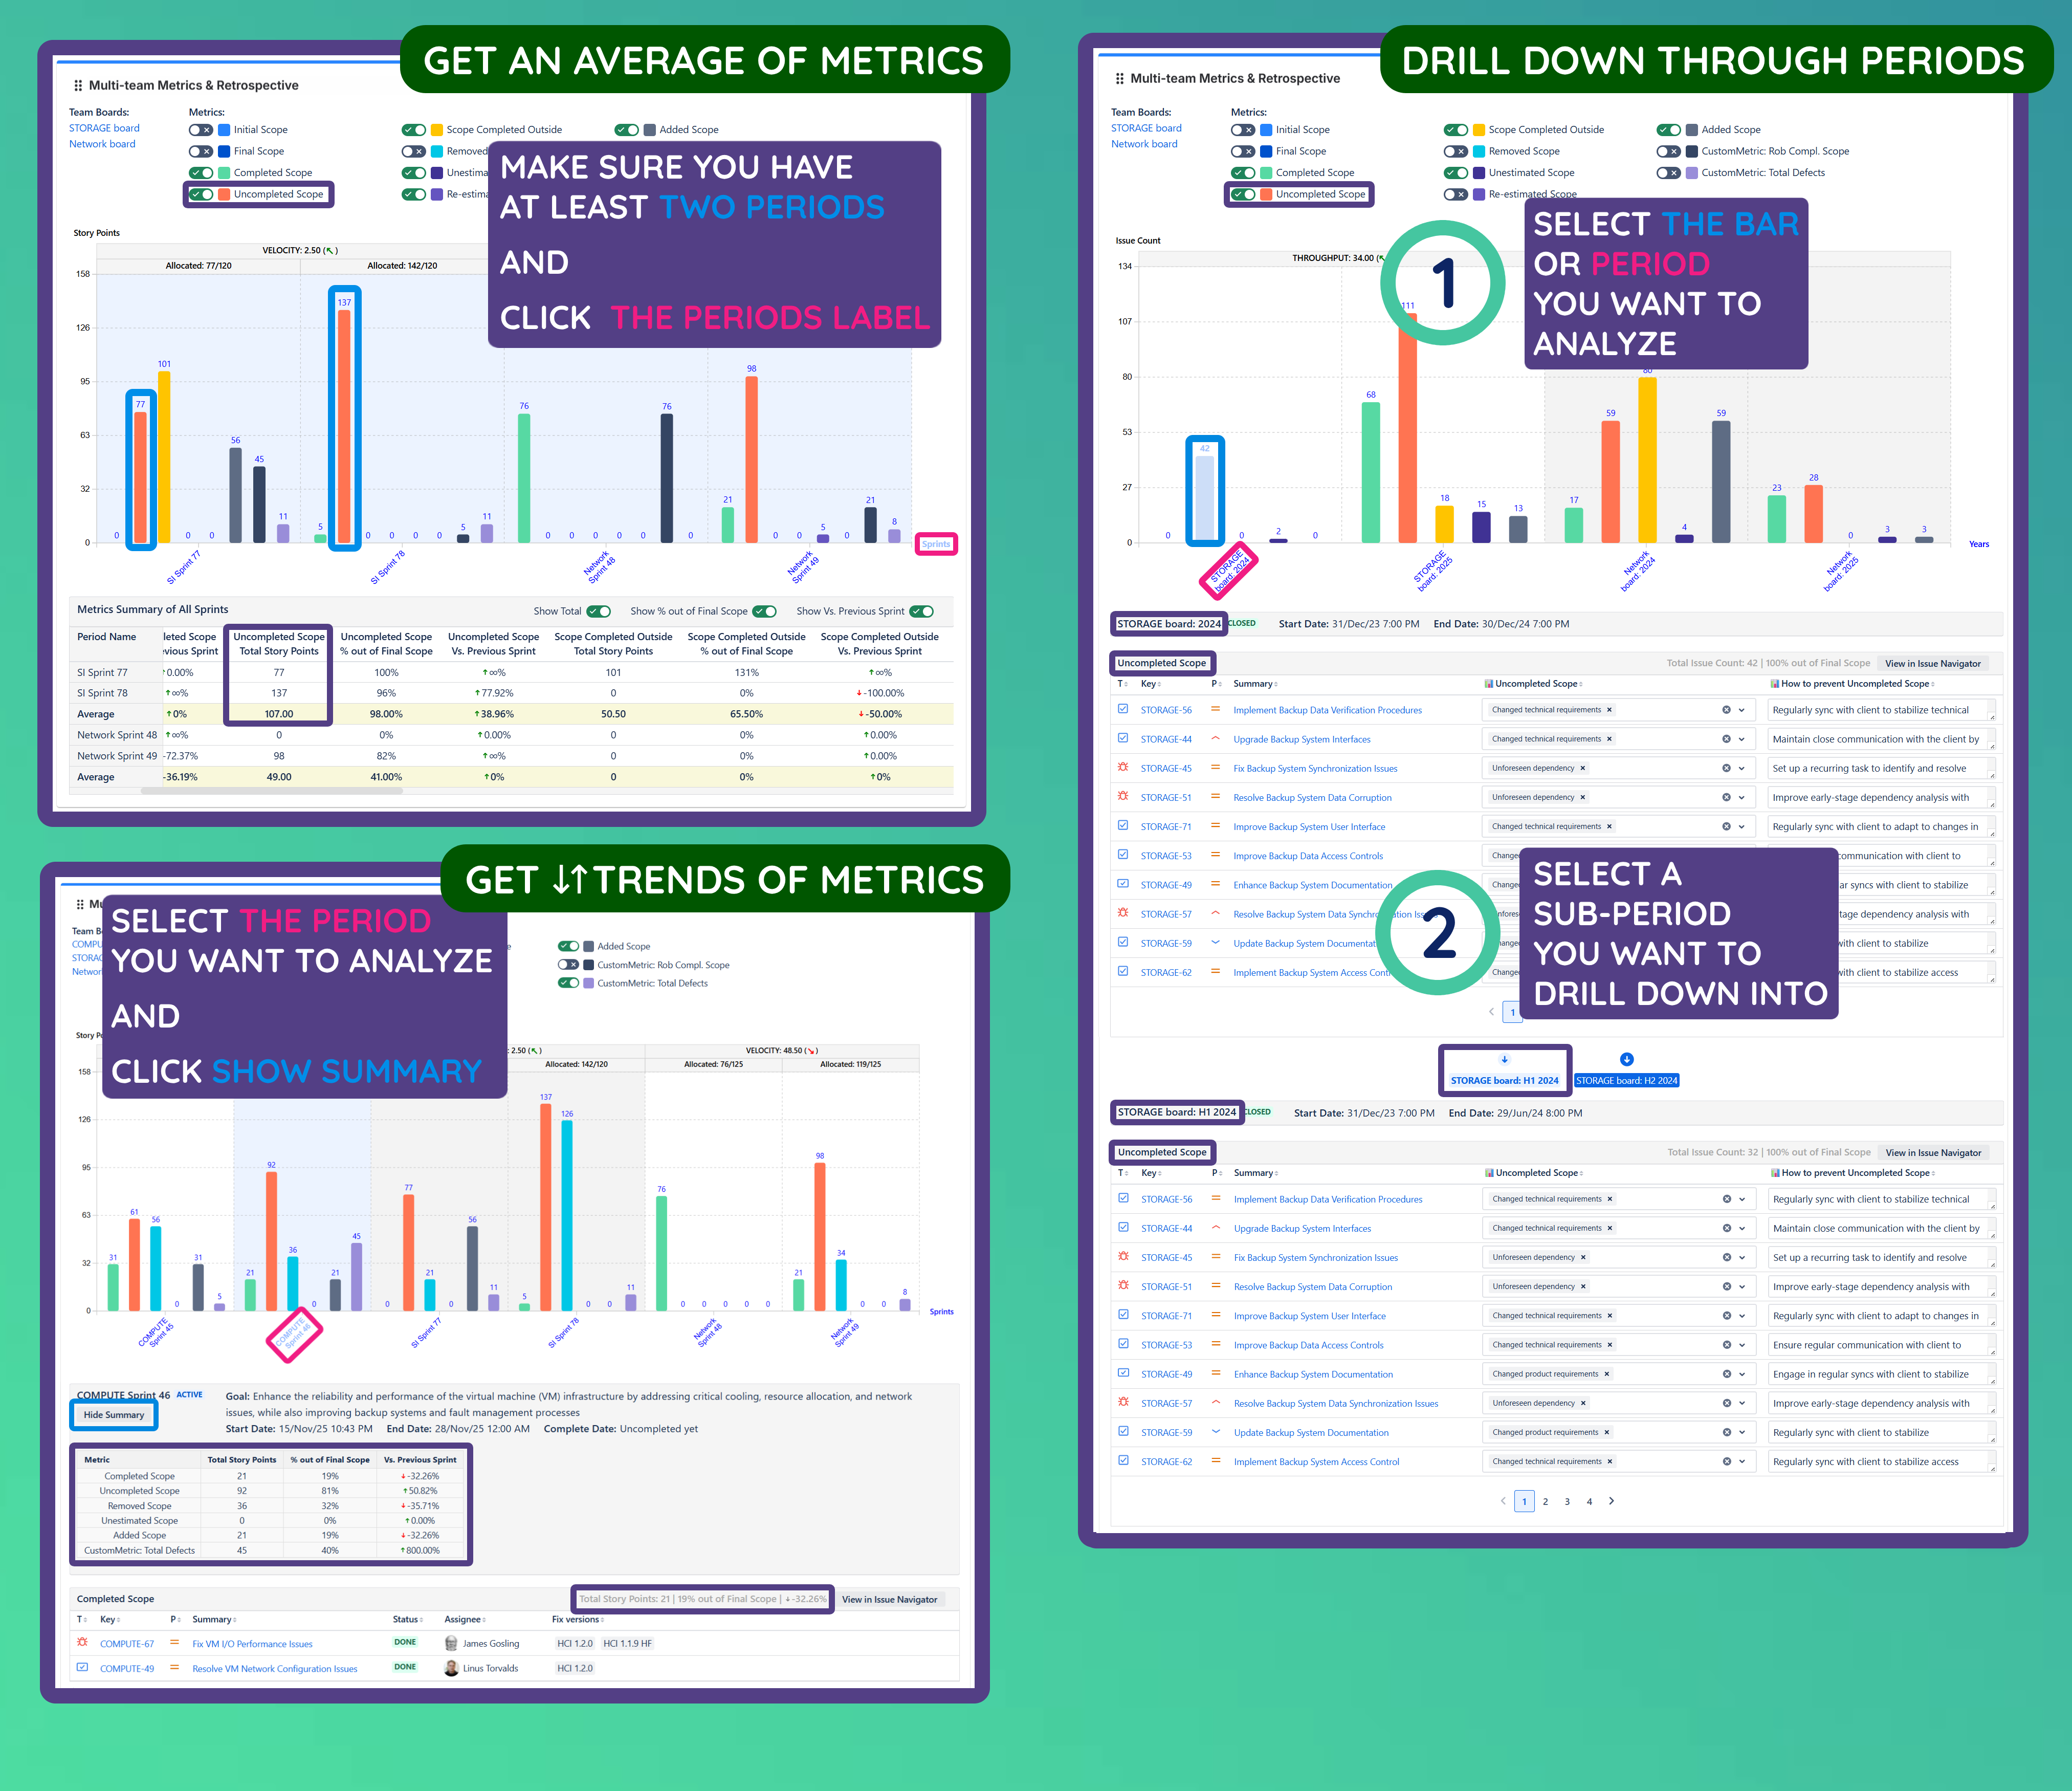
Viewing and Drilling Down Bars’ Content
Bar charts are fully interactive: Click any bar → see the issues behind it in a table. Drill down from year → half-year → quarter → month → sprint.
This allows teams to trace bottlenecks back to specific issues and specific periods.
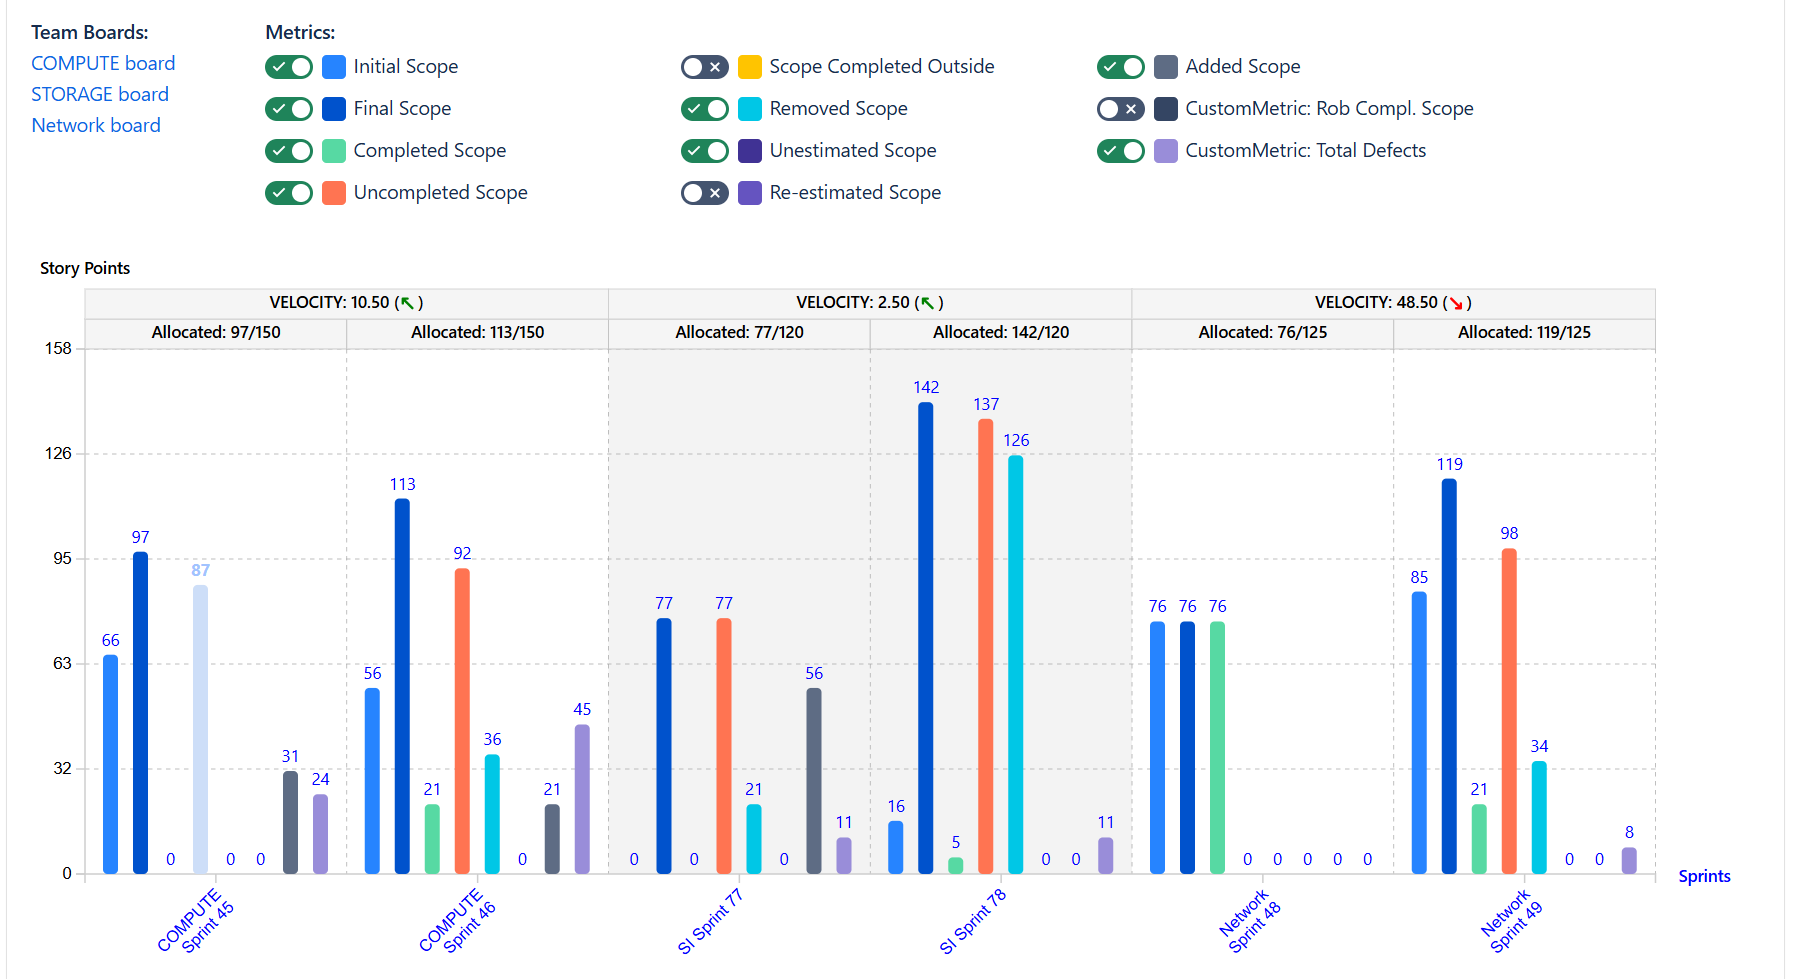
Viewing Trends and Average Metrics Across Selected Periods and Teams
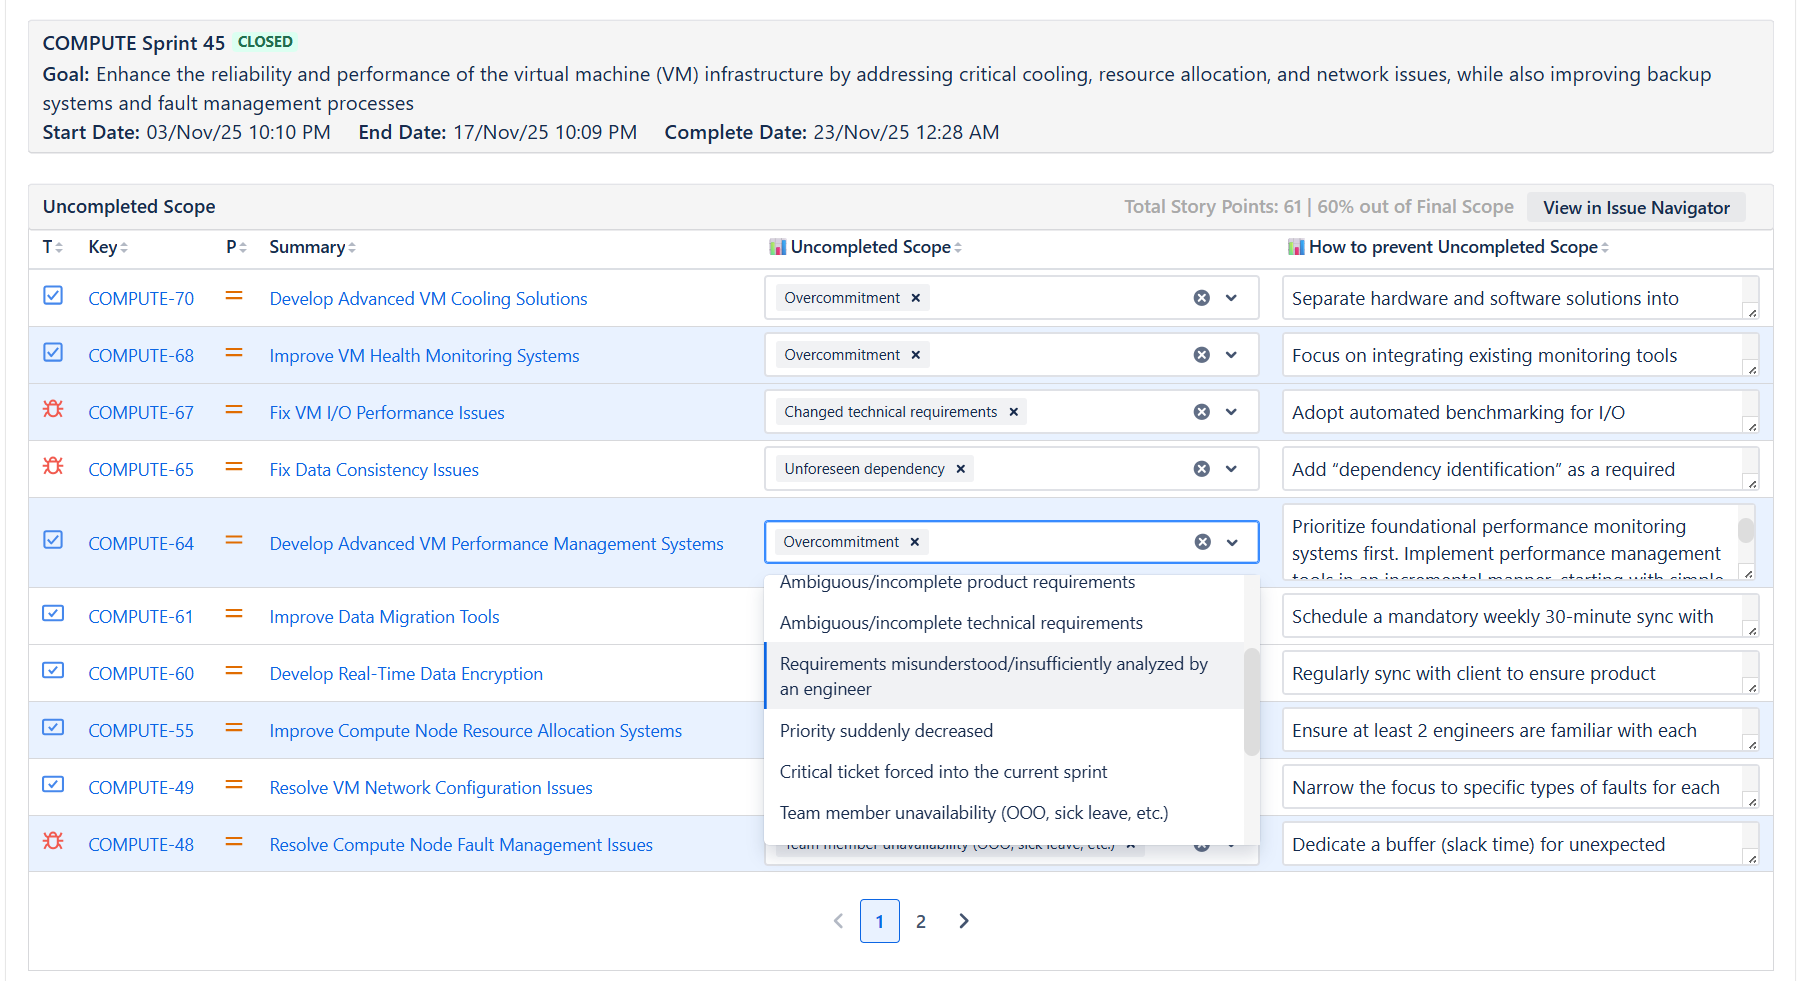
Retrospecting Failed Metrics Directly in the Chart
This is where the magic happens. Click a problematic bar → select a reason from a customizable dropdown → describe how to avoid it next time. This creates quantifiable retros instead of subjective discussions.
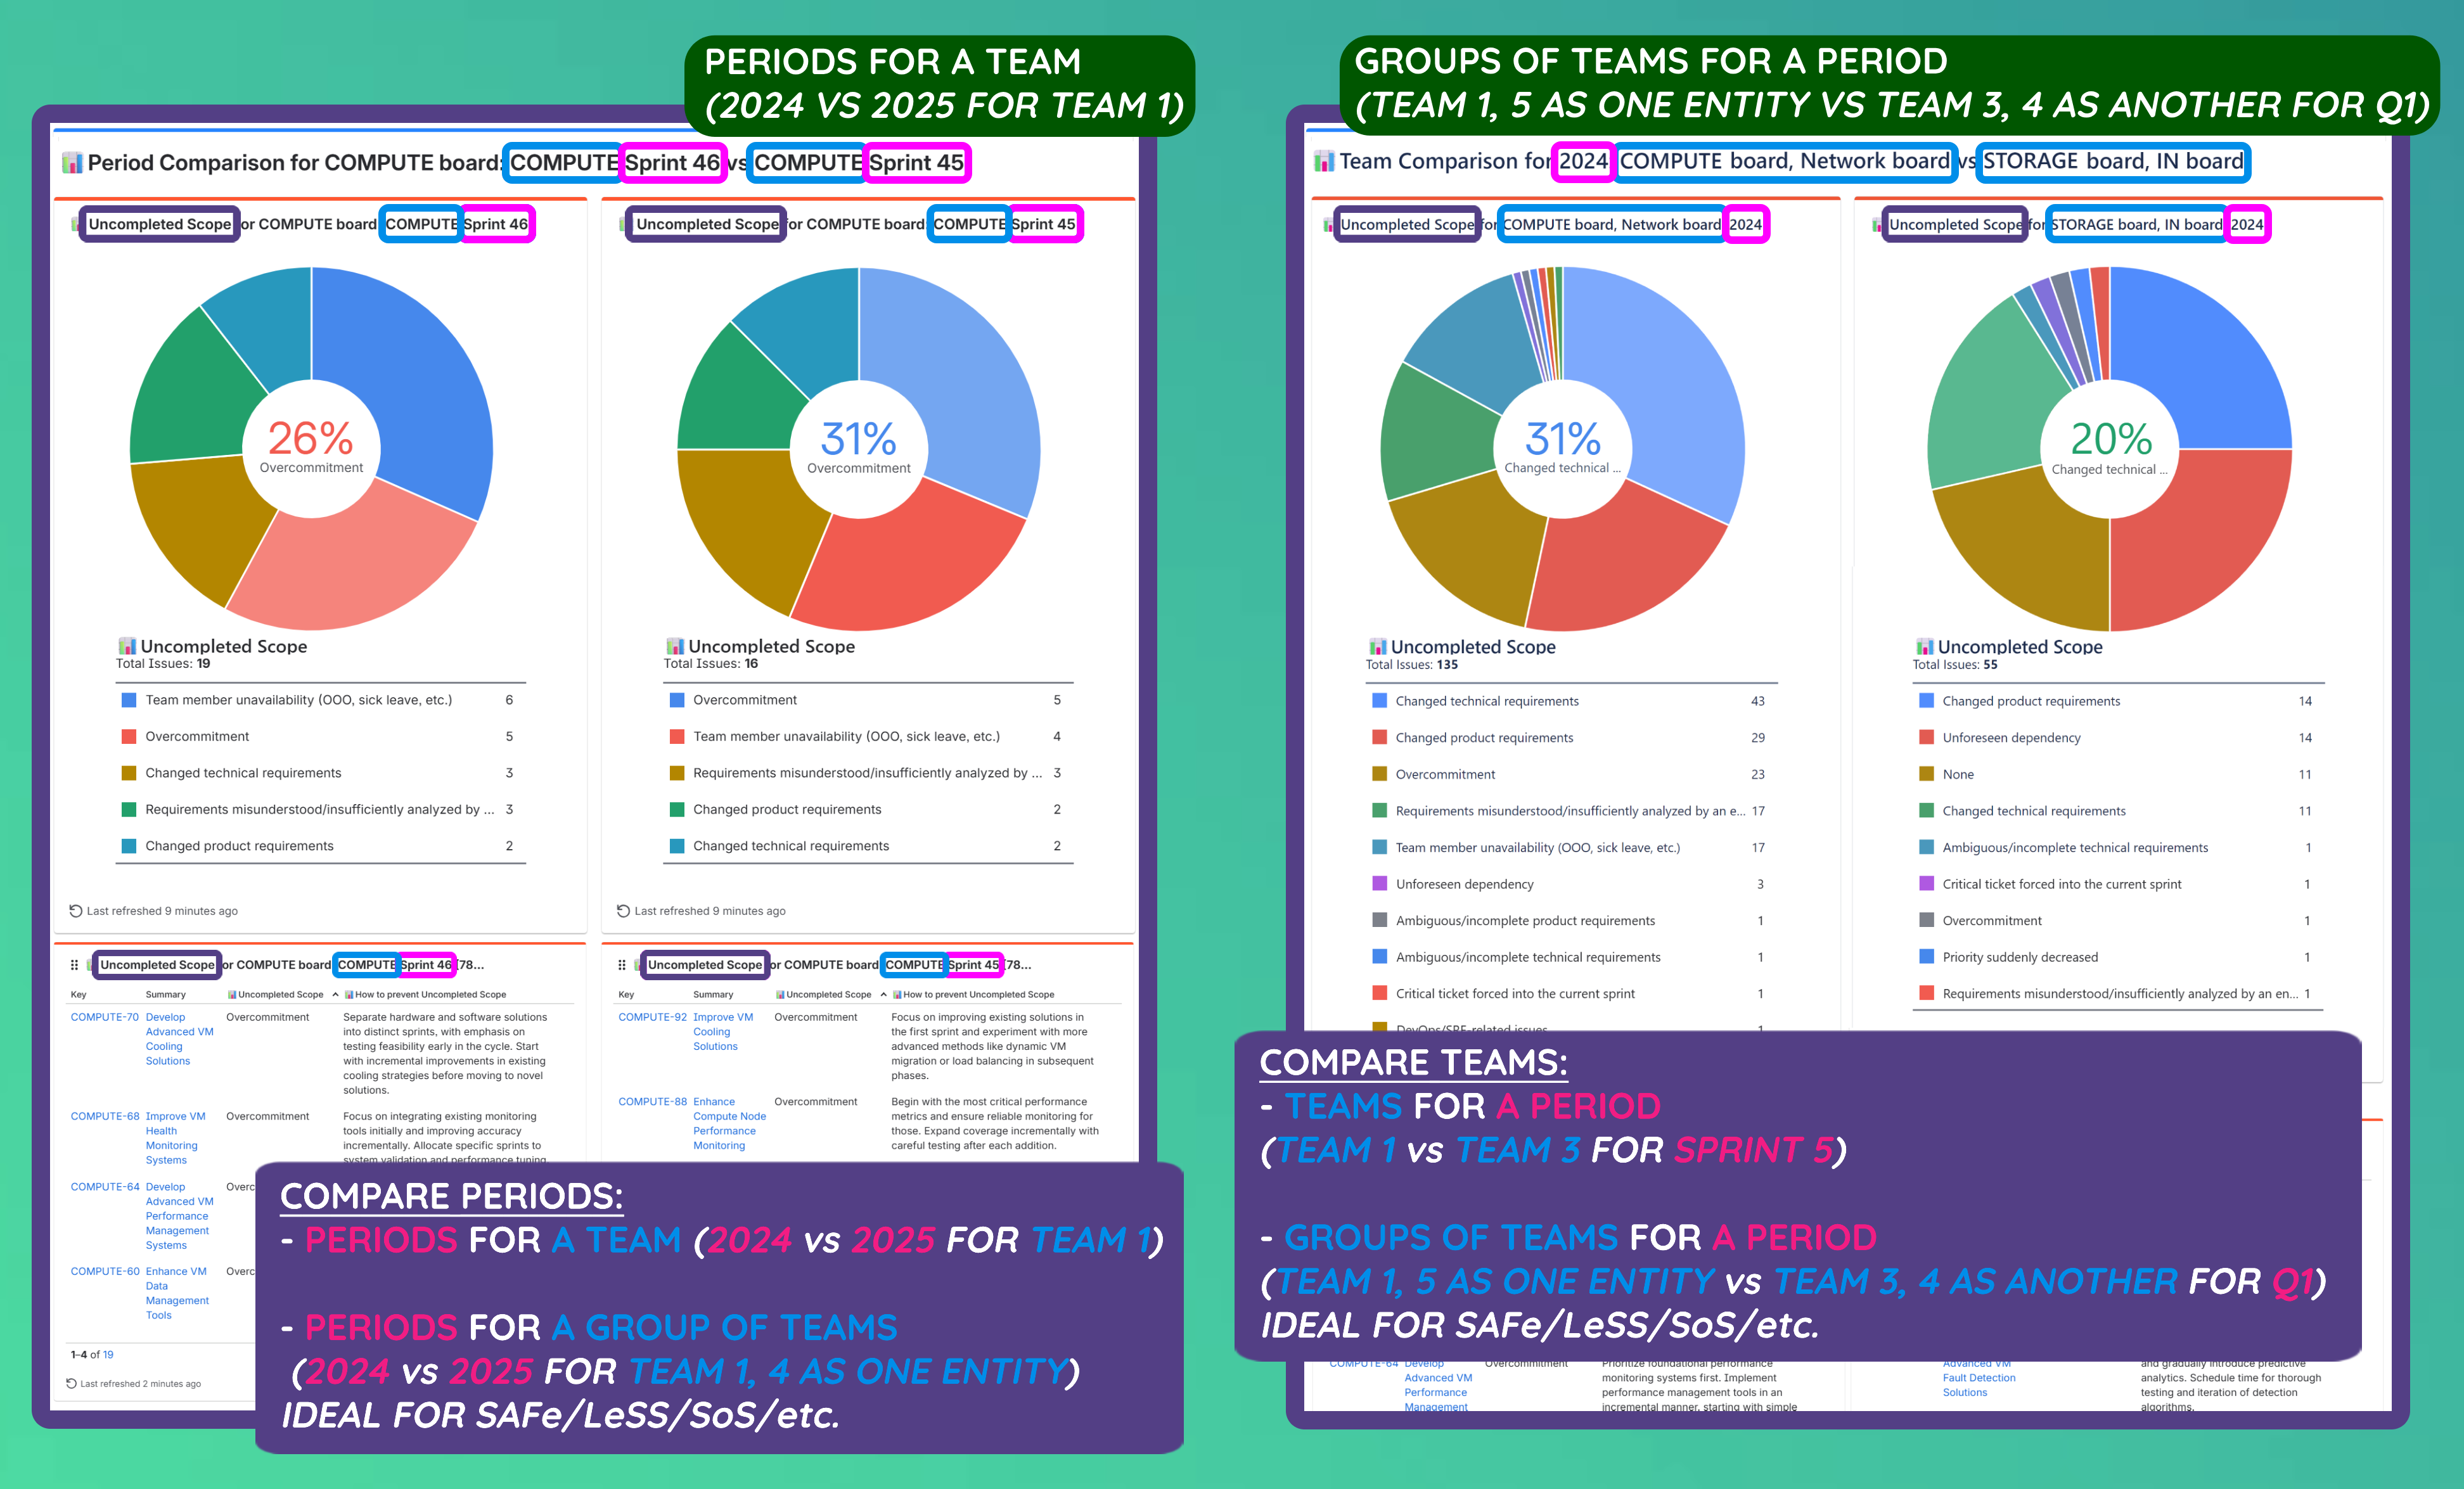
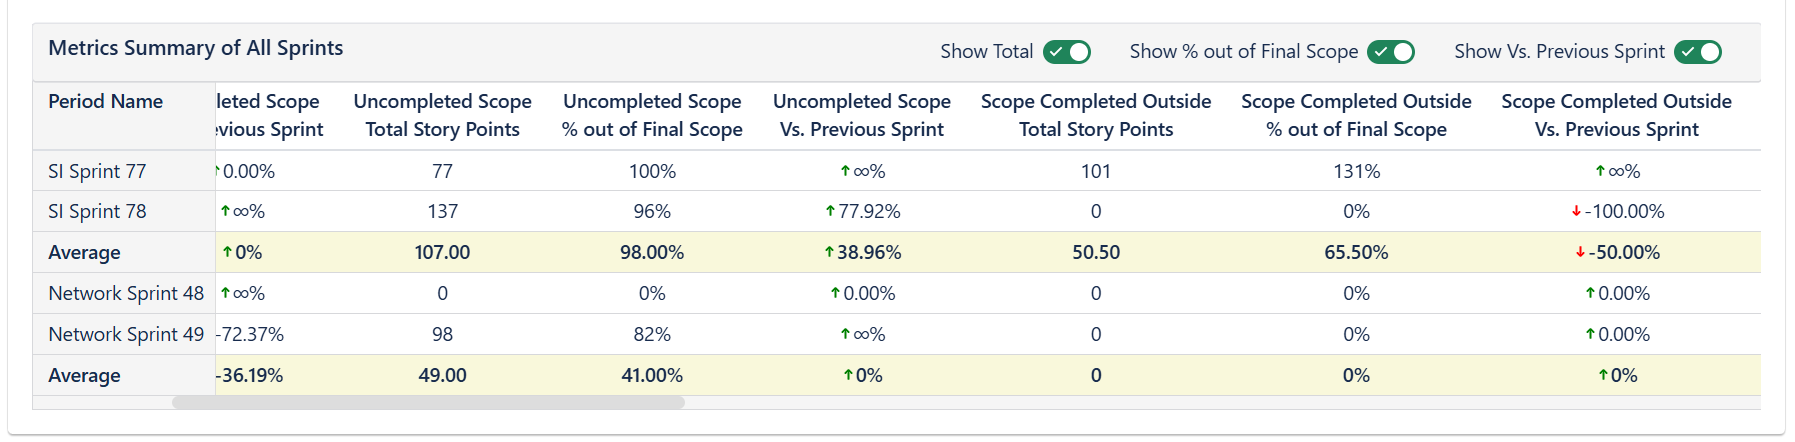
Generating Retro Reports Across Any Teams and Periods
Retro reports aggregate and sort all reasons from the period and show:
- What consistently caused performance declines
- How much teams could improve if certain reasons were fixed
Comparisons:
- Teams vs teams (Team 1 + Team 5 vs Team 3 + Team 4 for 2025)
- Periods vs periods (2024 vs 2025 for a team or group of teams)
These are reports engineering uses to improve quality and predictability - and execs use to decide where to invest money (e.g., “If we add more testing capacity, how many more work items will we deliver?”).
Fine-tuning Metrics to Your Process
Teams can:
- Include Removed Scope into Uncompleted/Final Scope.
- Exclude duplicates.
- Exclude “testing discovered” linked issues from Added/Re-estimated Scope.
How we built it
The project is built with:
- React for the UI
- Atlassian Forge to integrate securely and natively with JIRA
- Memoized async issue fetching to handle heavy data operations efficiently
The design philosophy was:
- No performance degradation, even when aggregating hundreds of issues across dozens of periods.
- No assumptions about user workflows - everything should be customizable.
Challenges we ran into
Performance: Retrieving large volumes of issues across many periods and many boards required asynchronous batching and await Promise.all to avoid UI blocking.
Drill-down logic: Users can start with months, quarters, or half-years, and must still be able to navigate all the way down to sprints. Designing an engine that handles arbitrary hierarchies was surprisingly difficult.
Customization with stability: The app needed to remain fast while allowing users to build any metric using JQL.
Balancing simplicity with power: The UI had to remain simple enough for non-technical users, even though advanced teams could create extremely complex reporting setups.
Accomplishments that we're proud of
Teams using this approach have observed:
- 2× delivery throughput
- 3× increase in flow efficiency
- 4× increase in planning accuracy and commitments
What we learned
- True predictability comes from tracking predictable metrics, not guessing.
- Retros only work when they are quantitative, connected to real JIRA data, and repeatable.
- Teams don’t struggle because they lack good intentions - they struggle because they lack visibility.
- User experience must be effortless; otherwise teams will not adopt even the most powerful tools.
- Period hierarchy logic must be extremely flexible because companies structure their sprints and planning cycles very differently.
What's next for Multi-team Sprint/SAFe/Scrum Metrics & Retrospectives
- Forecasting models using historical flows and reasons.
- Improvement scenario simulation, e.g.: “If we eliminate reason X, throughput increases by ~18%. Here’s what that looks like next quarter.”
- Advanced multi-team roadmaps rooted in real historical performance.
- AI-assisted retrospective summaries directly using reason logs.
The long-term vision:
A unified JIRA-native operating system for engineering effectiveness, predictability, and continuous improvement - without requiring managers to manually gather or interpret data.
Demo (22 min)
See the 4K demo here


Log in or sign up for Devpost to join the conversation.