-
-
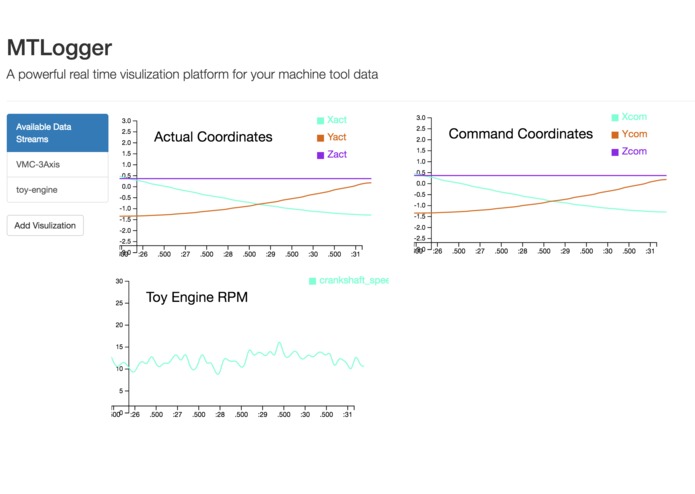
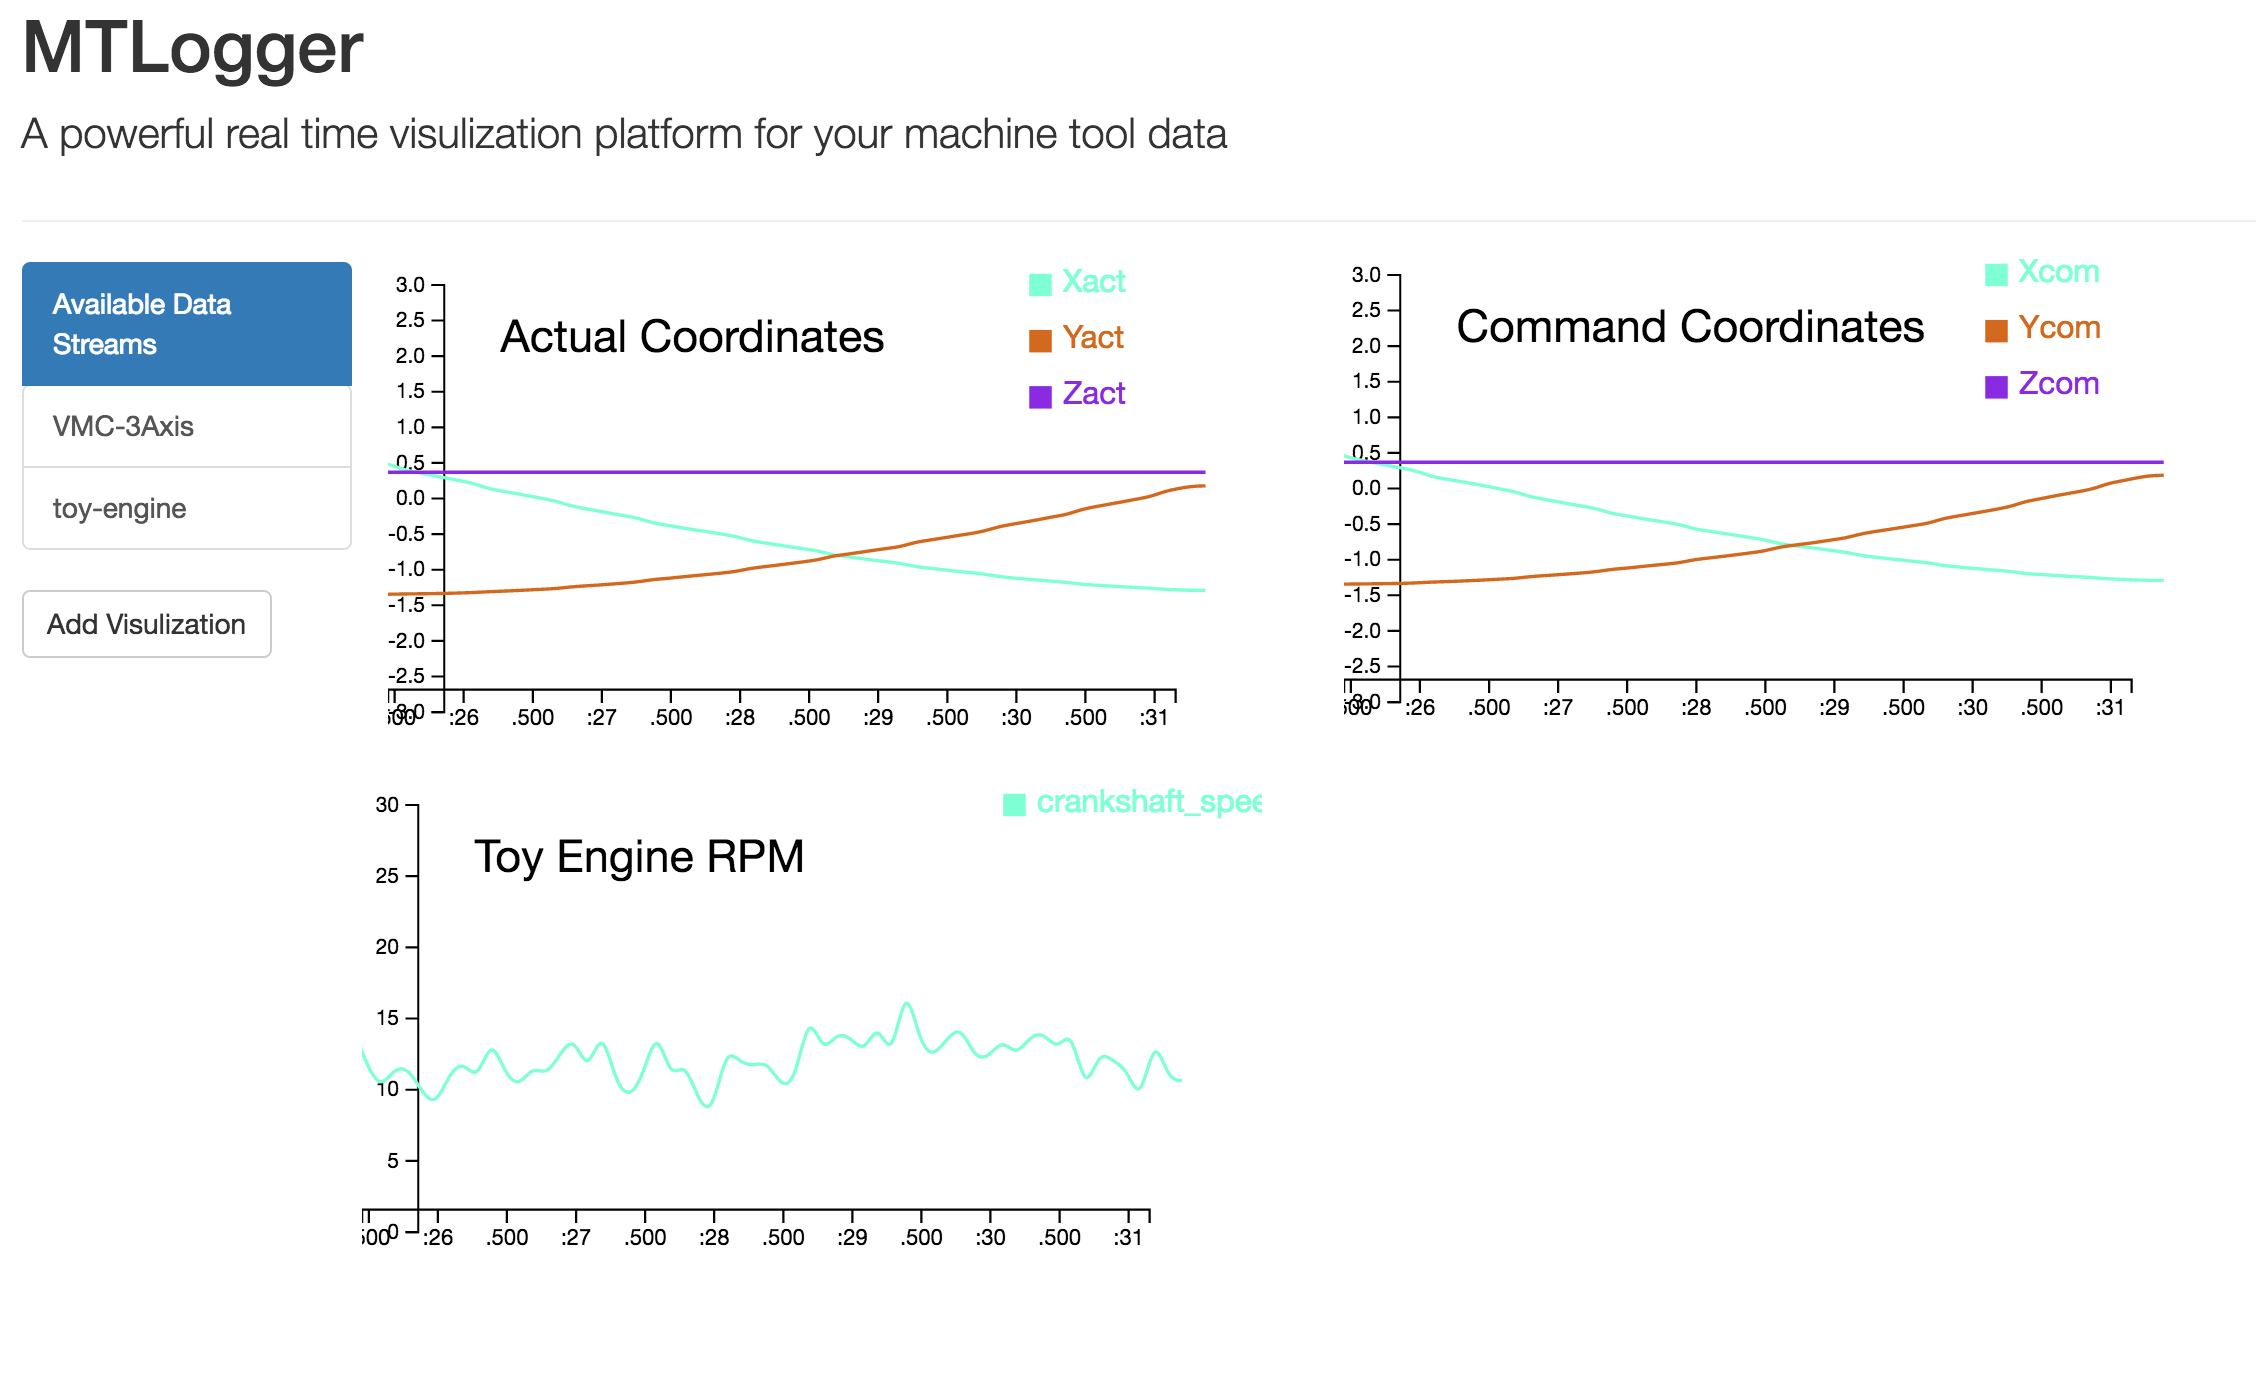
Three charts showing real time data visualization from two machine's data
-
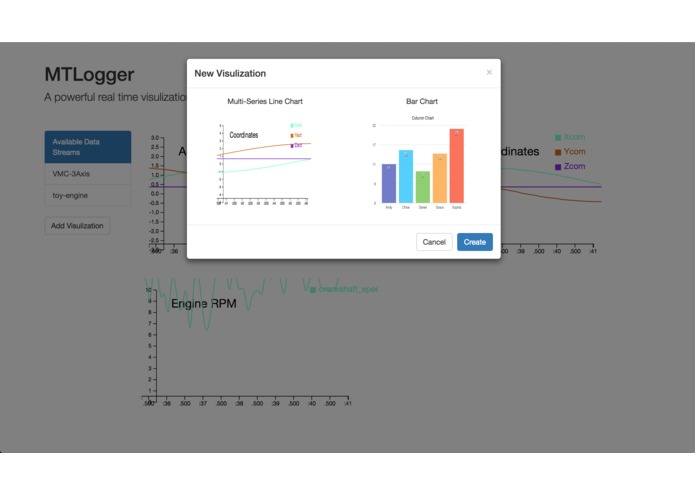
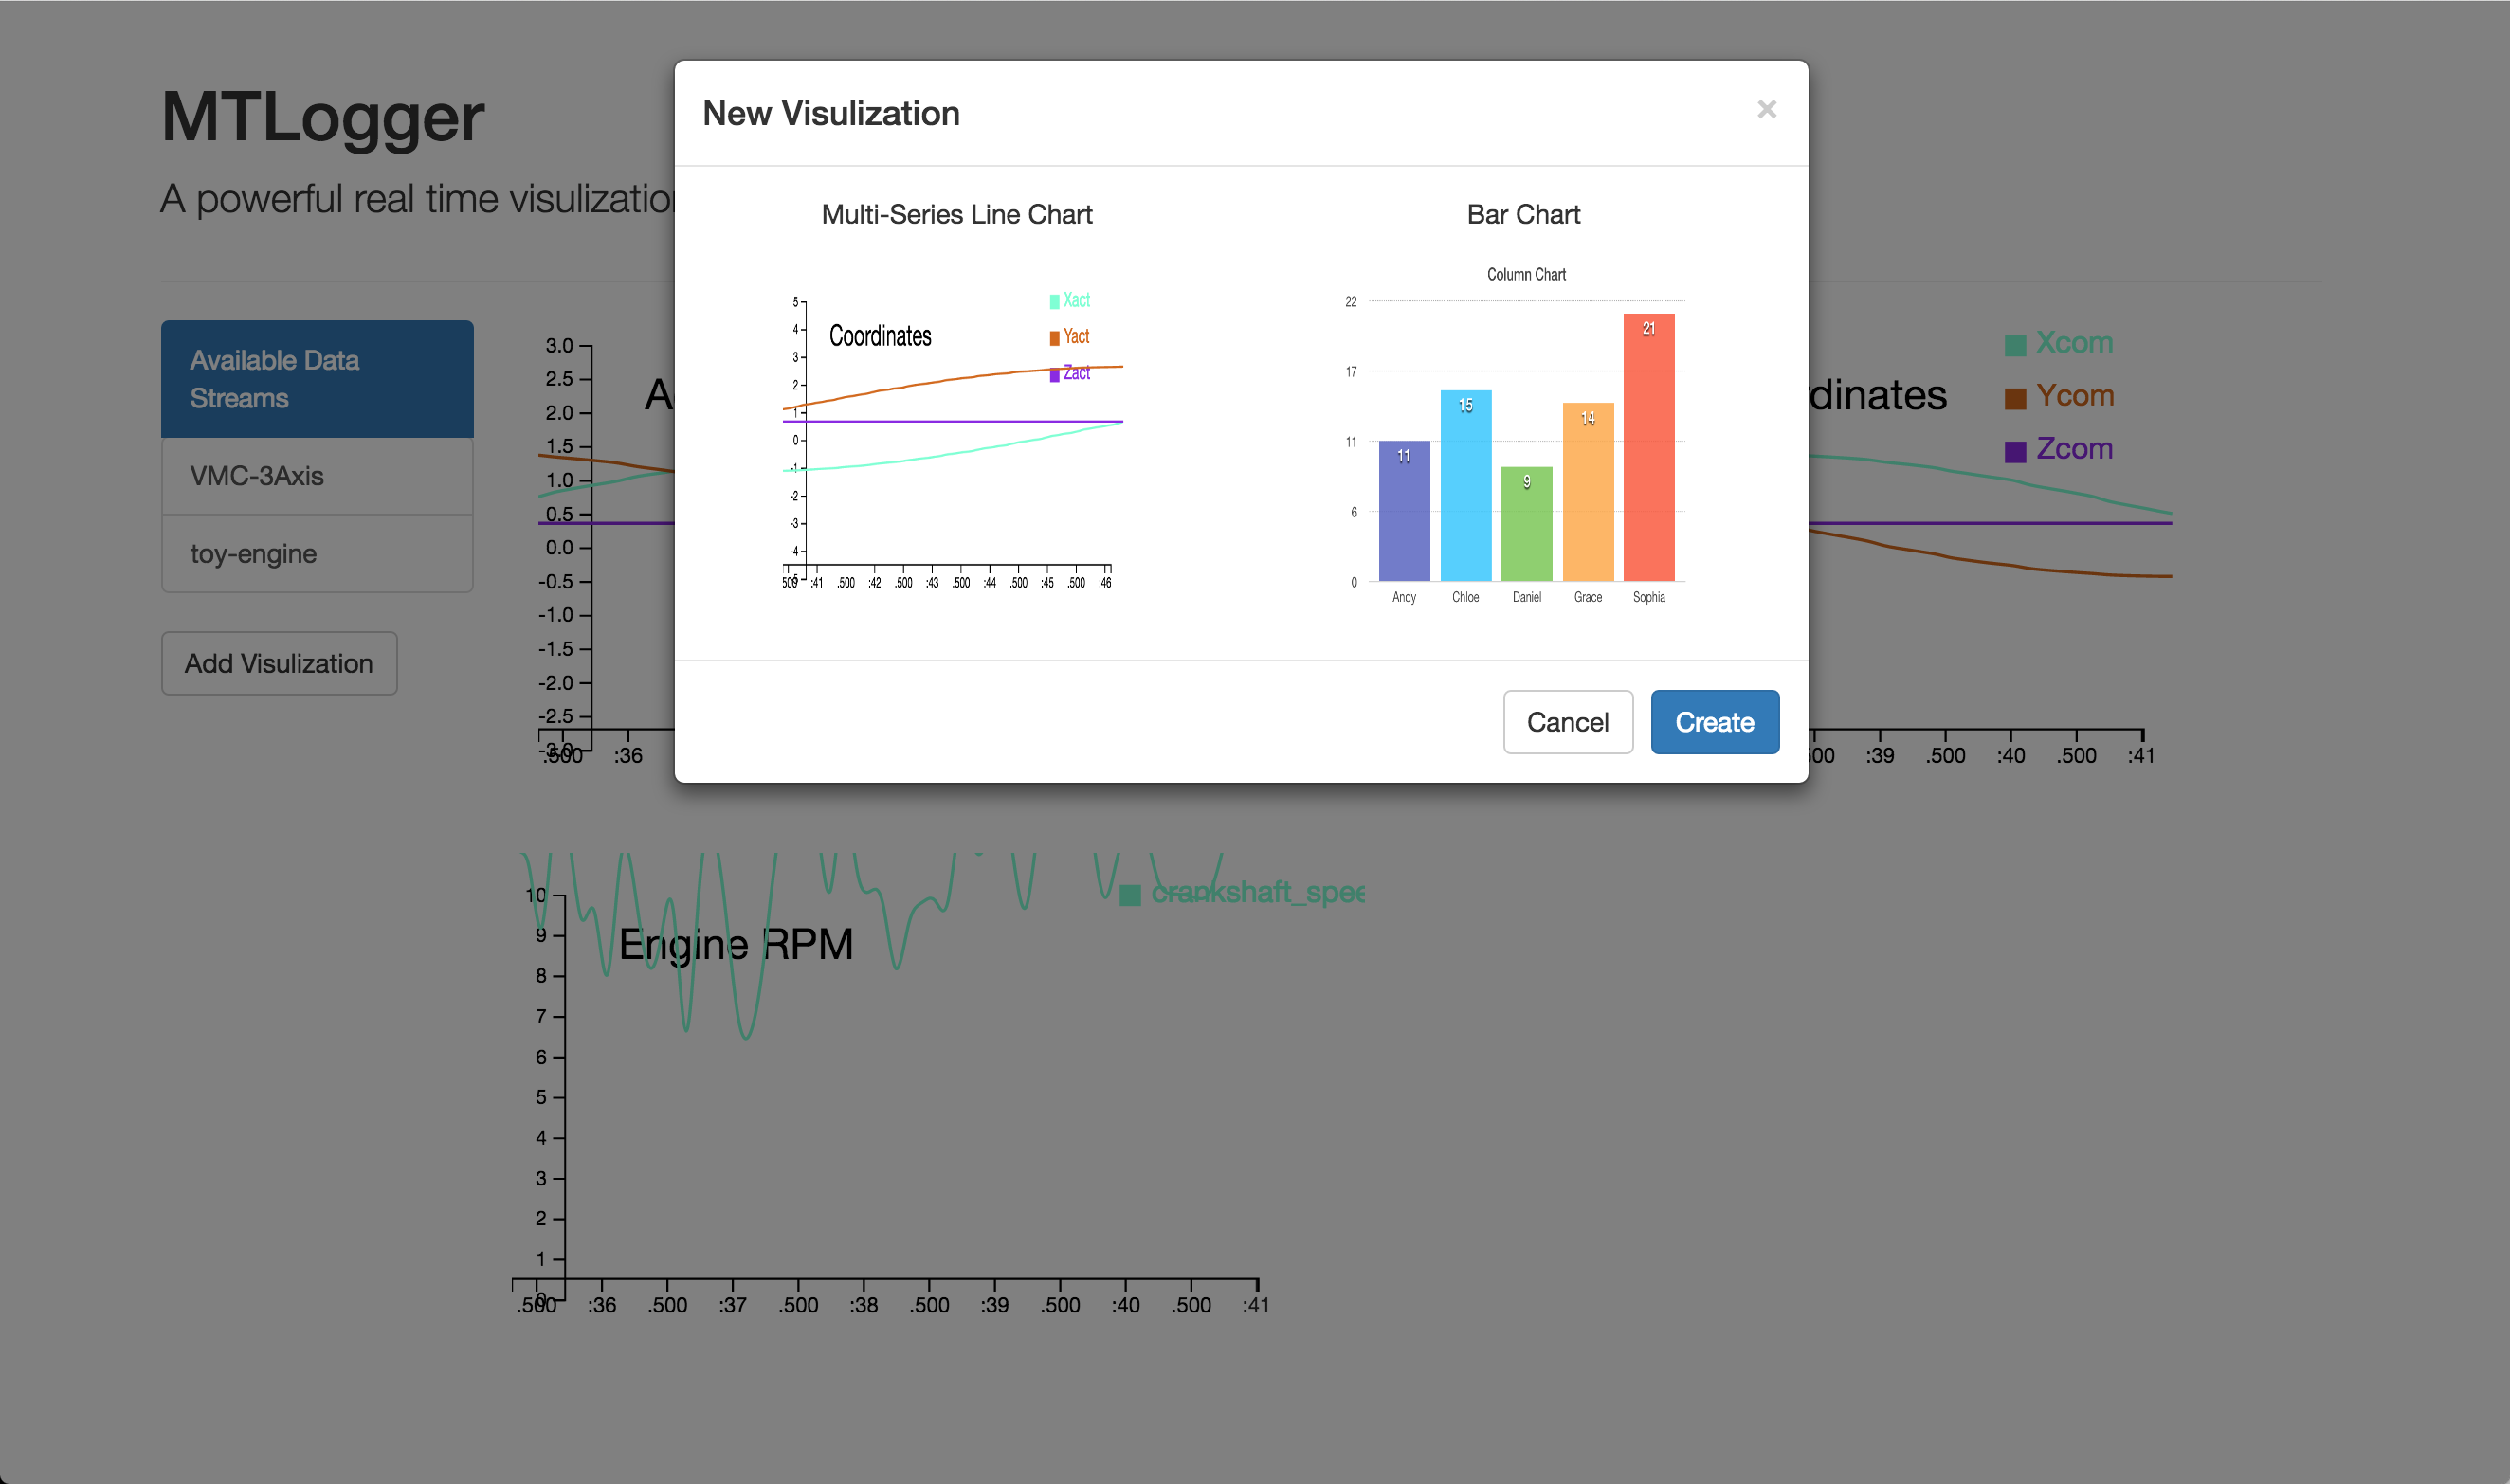
Selecting chart type
-
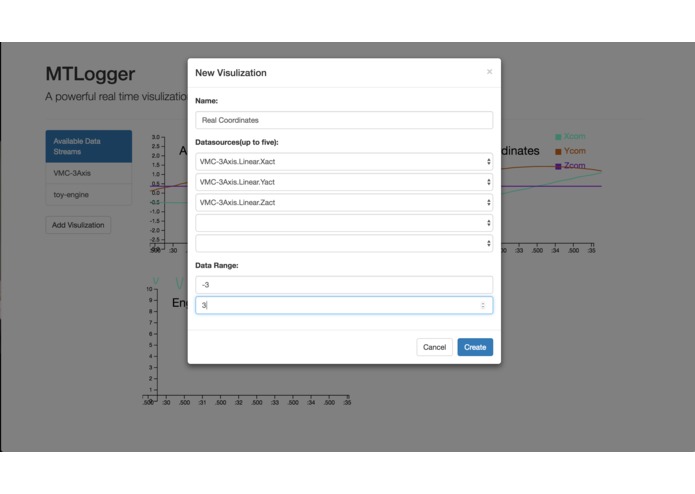
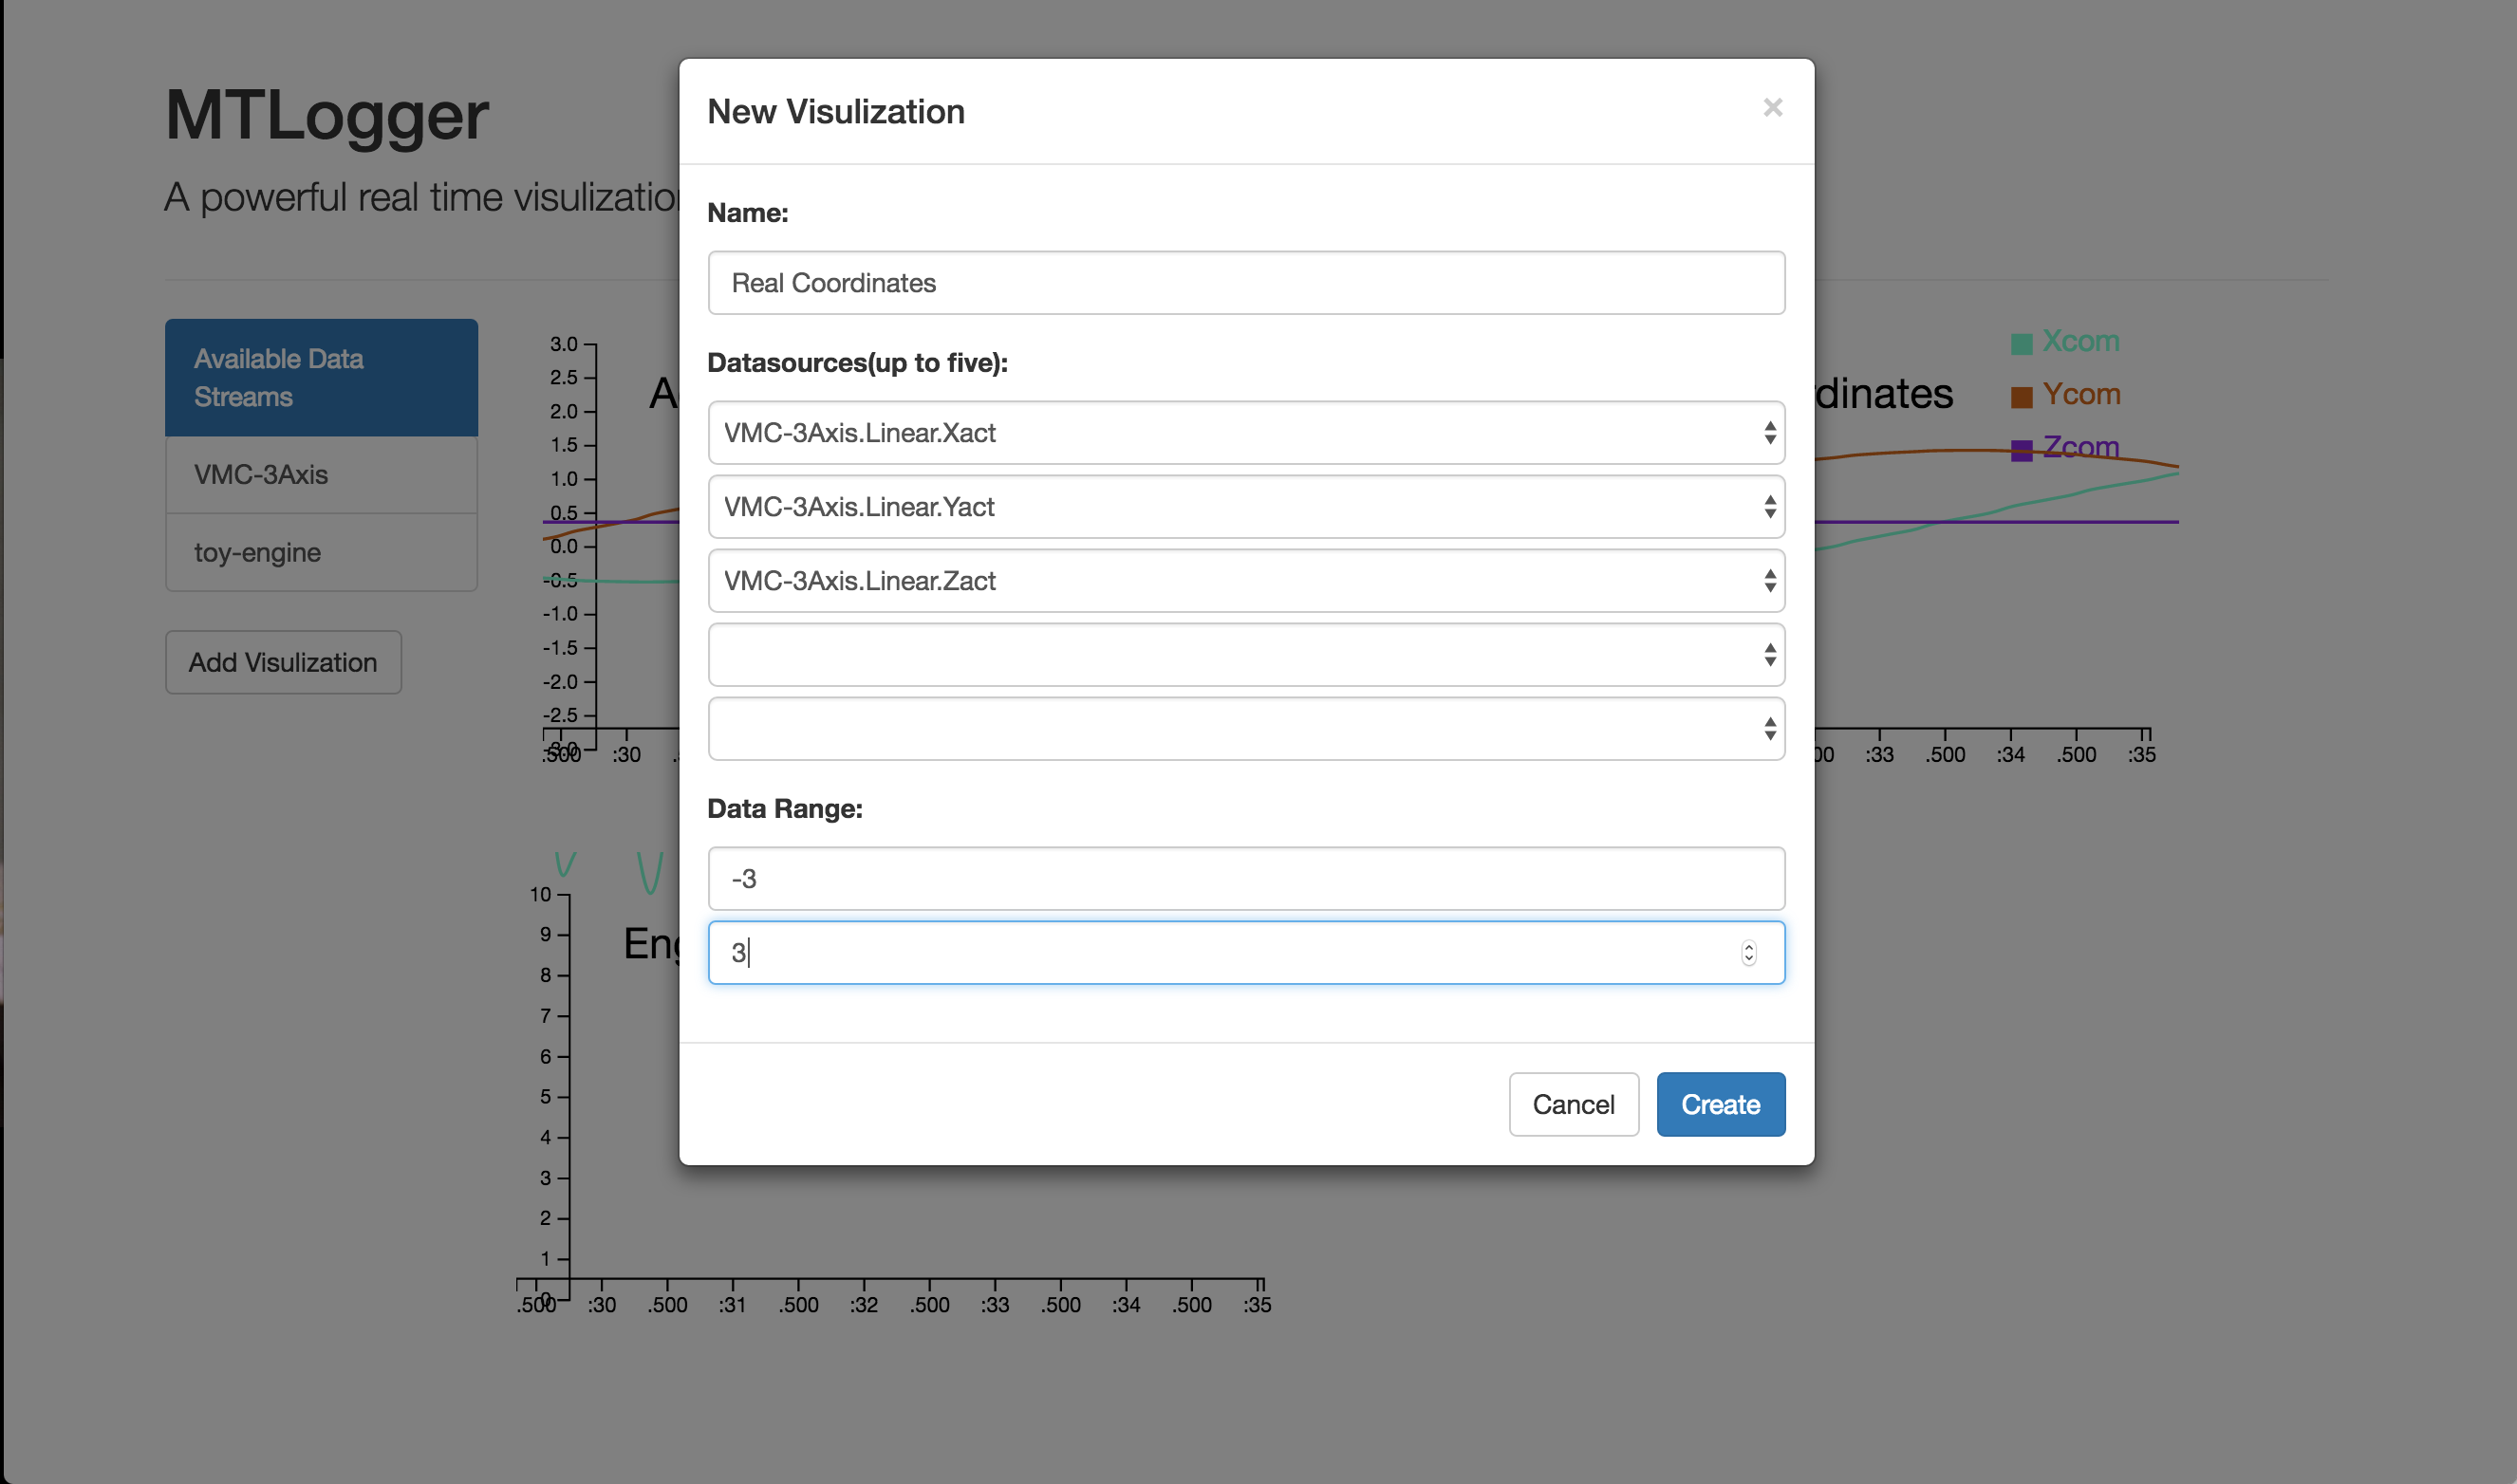
Filling out multi-line chart data sources and config
Inspiration
Real time data visualization benefit users to have a better and immediate grasp on the status of their machine tools. With MTConnect, we can easily query real time structured data from machines, therefore, I think it will be beneficial to make sense of these real time data by visualizing them.
What it does
It allows users to create real time data visualization easily by selecting specific data sources from data stream provided by MTConnect.
How I built it
I built it with node.js, d3.js, bootstrap and jquery.
Challenges I ran into
It's kinda difficult to design a website.
Accomplishments that I'm proud of
I made some charts that moves!
What I learned
I learned how MTConnect work
What's next for MTLogger
The next step for MTLogger is to create more chart types that work with more data type, such as conditions and events defined by MTConnect Standard.


Log in or sign up for Devpost to join the conversation.