Inspiration
The MSC is the busiest building on campus, and every student has wandered around it looking for a quiet place to study. Aggie Map shows which buildings have amenities, but it has no indoor floor plan, no water fillers or study spots, and nothing that changes over time. Nobody had measured how loud the study spots actually are, so we went and measured them.
What it does
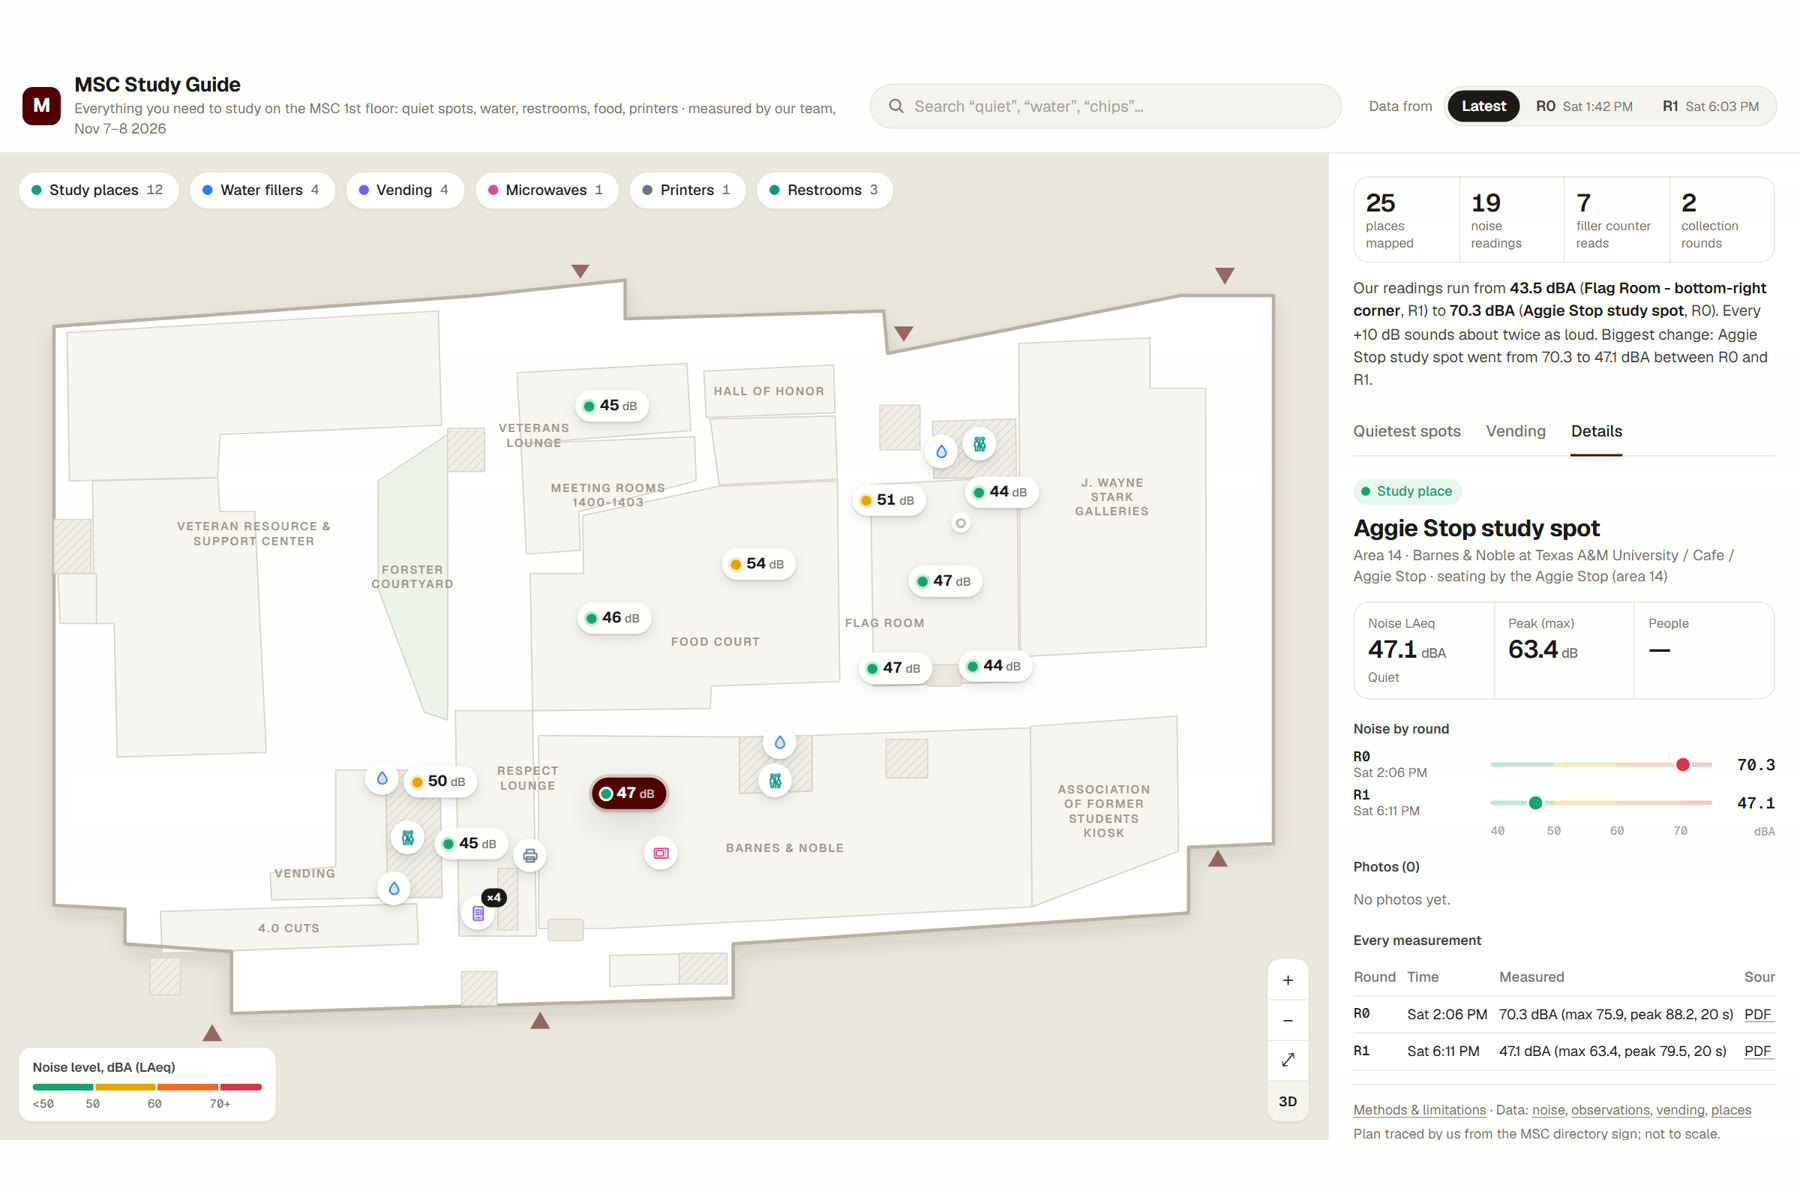
MSC Study Guide is an interactive map of the MSC 1st floor built entirely on data we collected in person during the event:
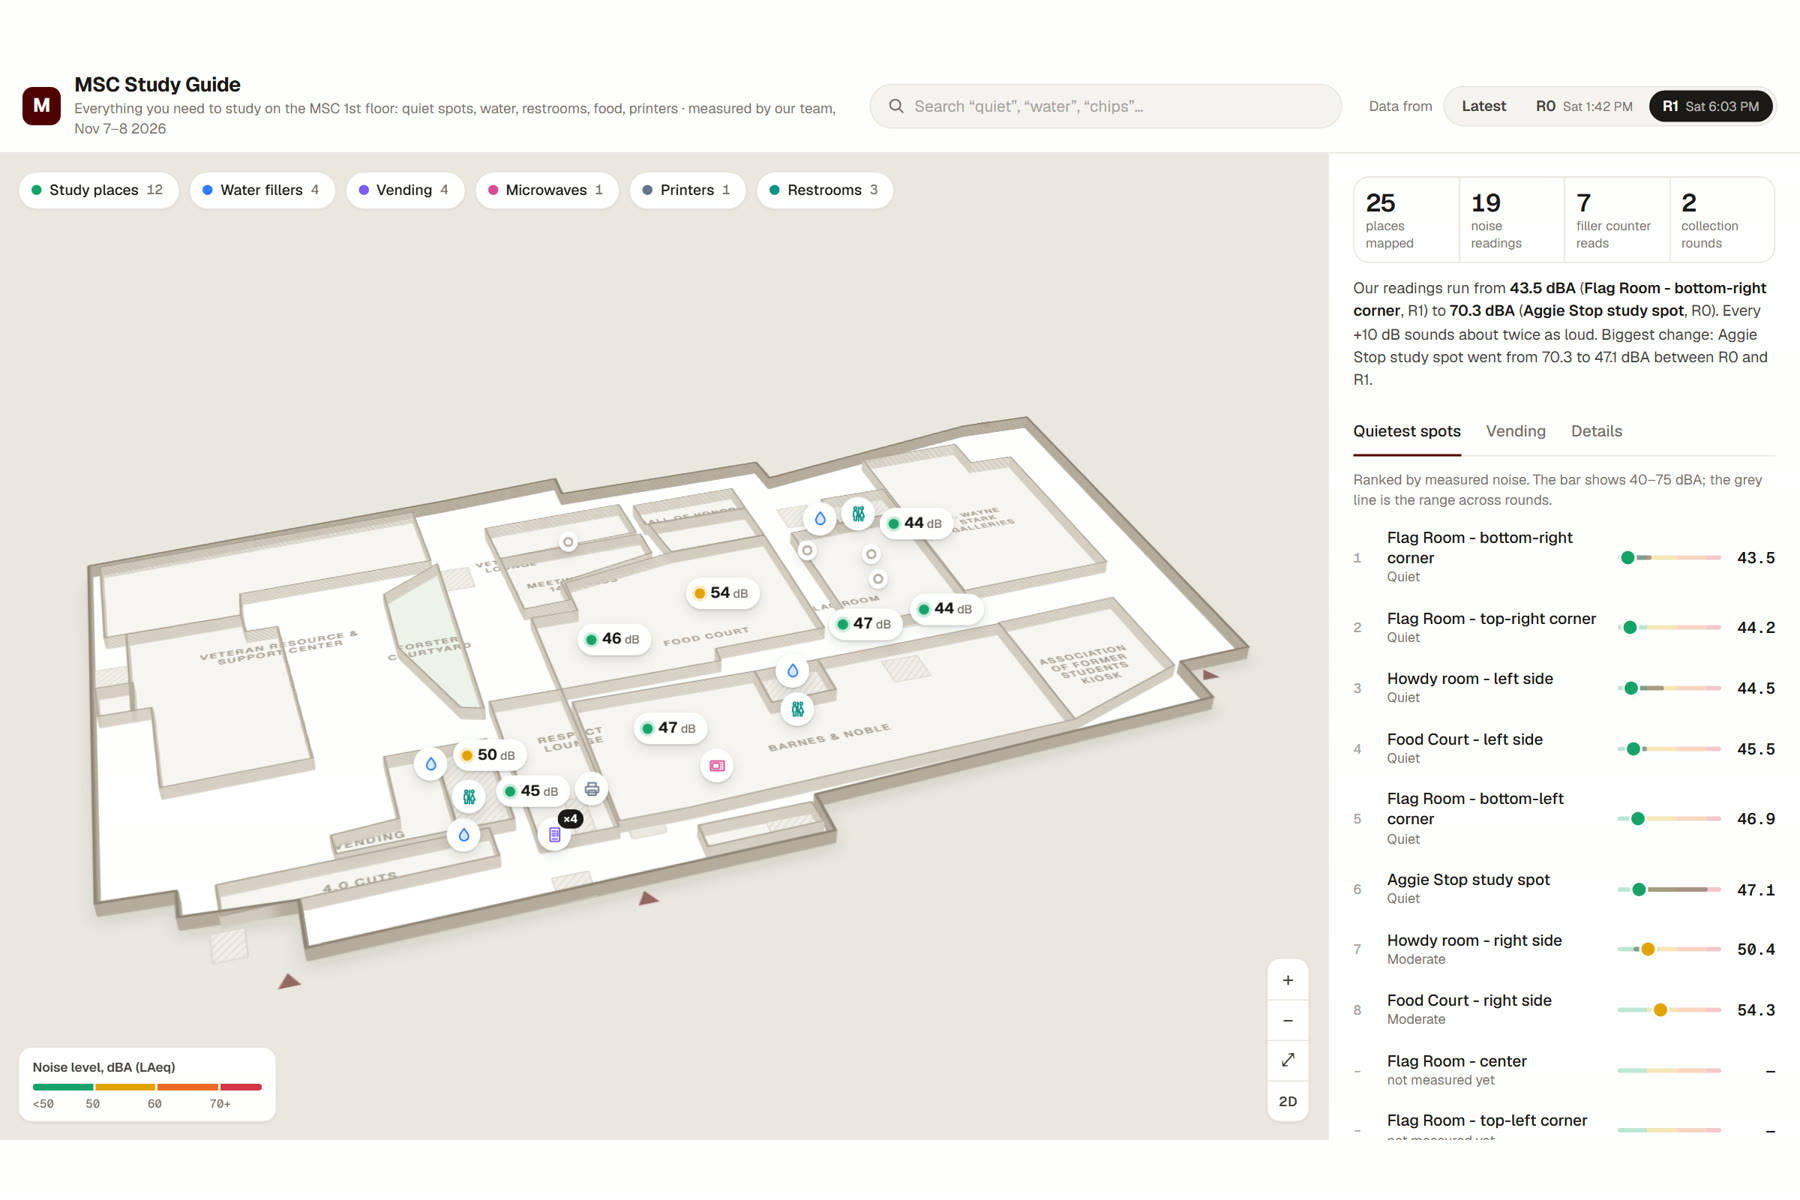
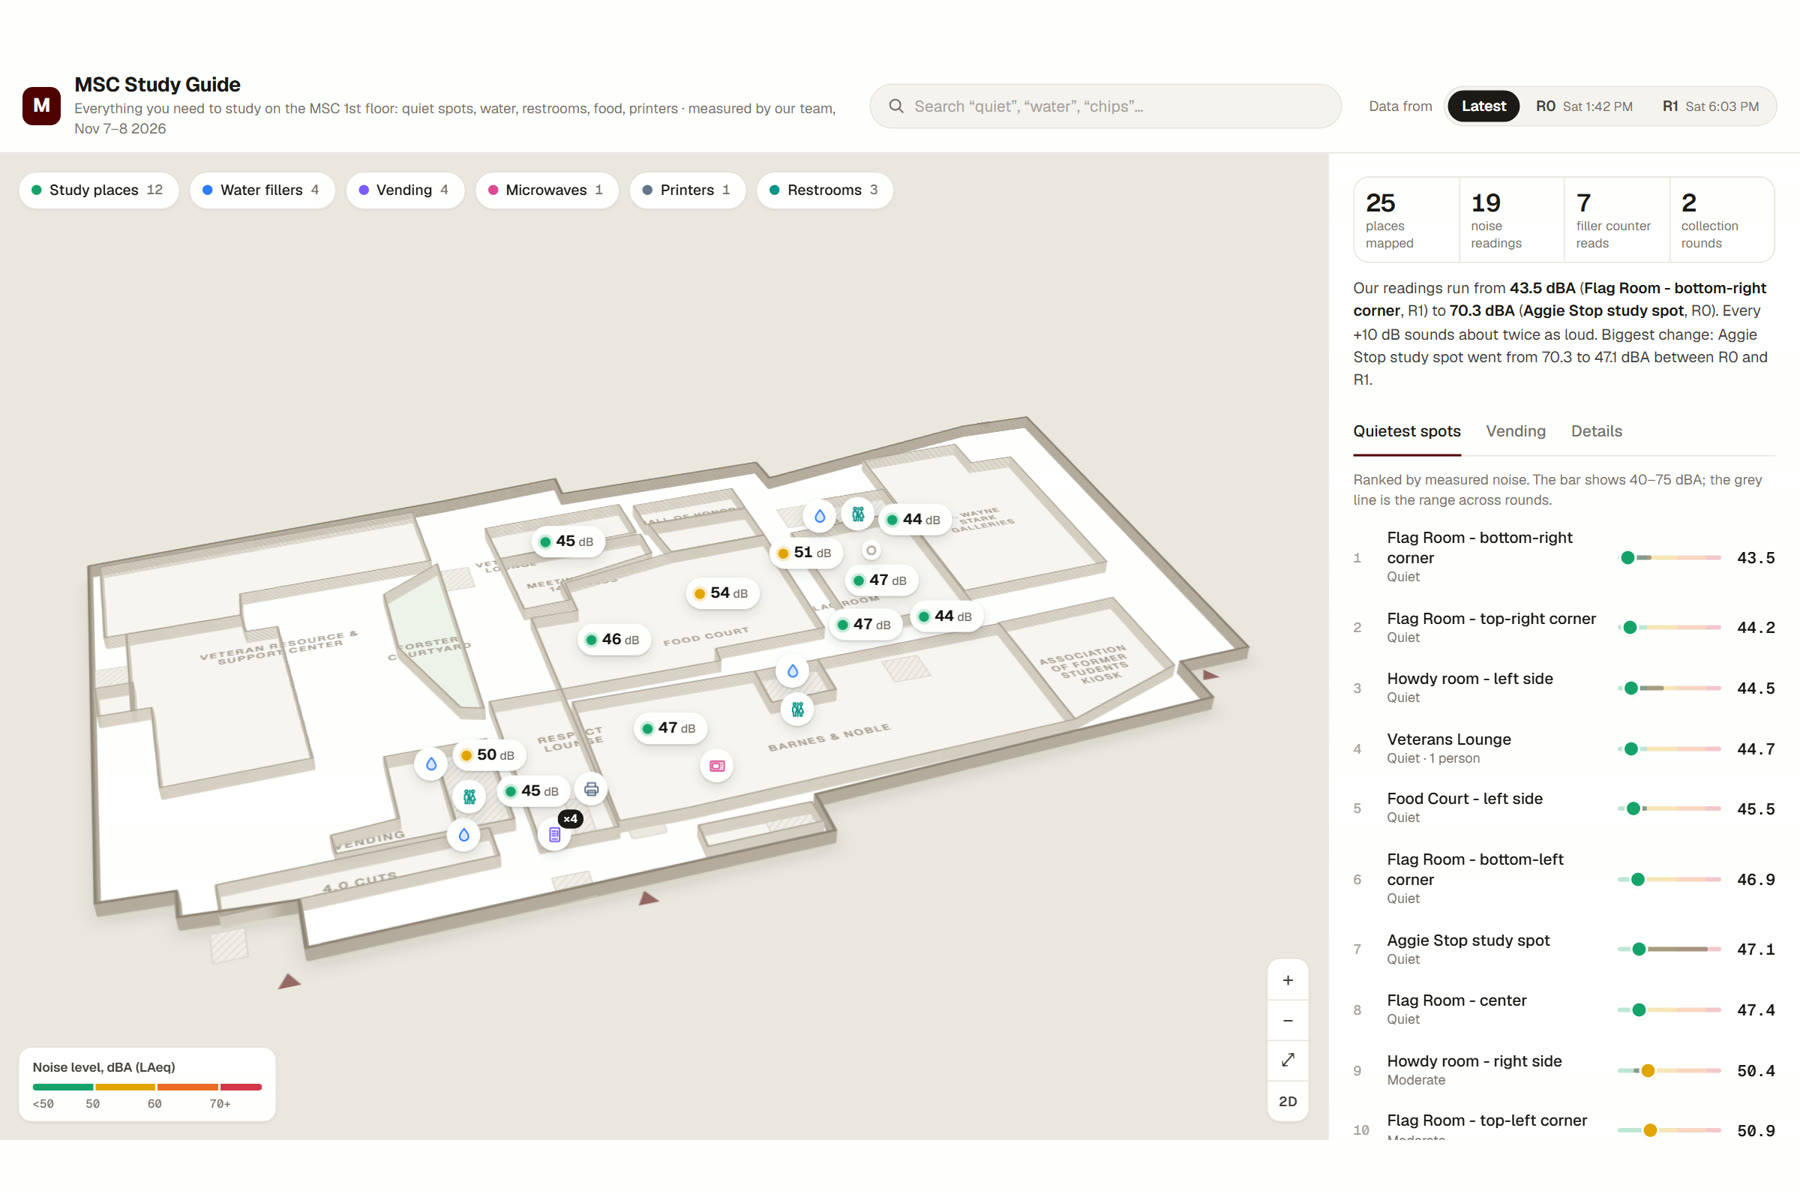
- Noise at every study spot: the measured level (LAeq, dBA) shown as a value pin on the map, color-coded from quiet to very loud, plus a list ranking the spots from quietest to loudest.
- Round switch: compare the afternoon walk (R0, 1:42 PM) with the evening walk (R1, 6:03 PM) and see how the floor changes.
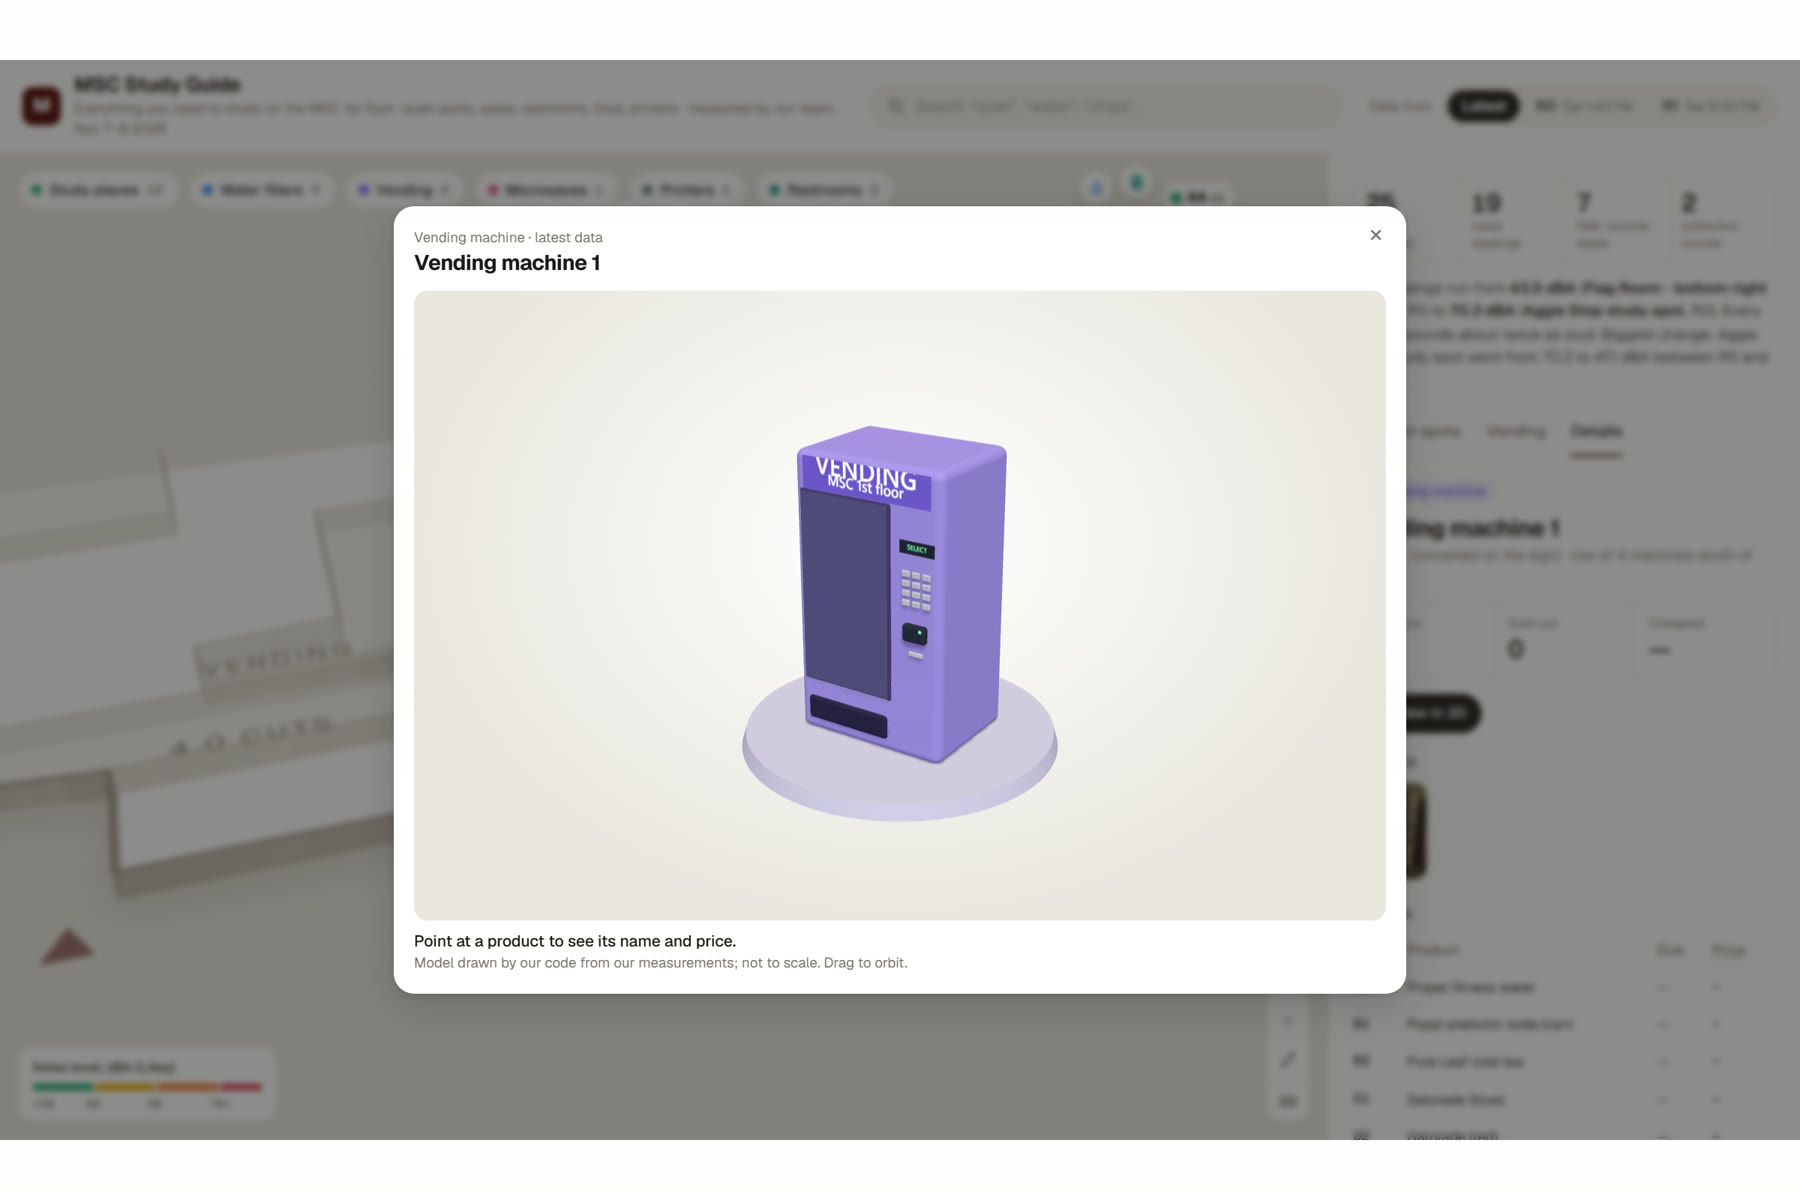
- Amenities: water fillers (with their "bottles saved" counters), vending machines (36 products and prices read from our photos), microwaves, printers and restrooms, each at its real position.
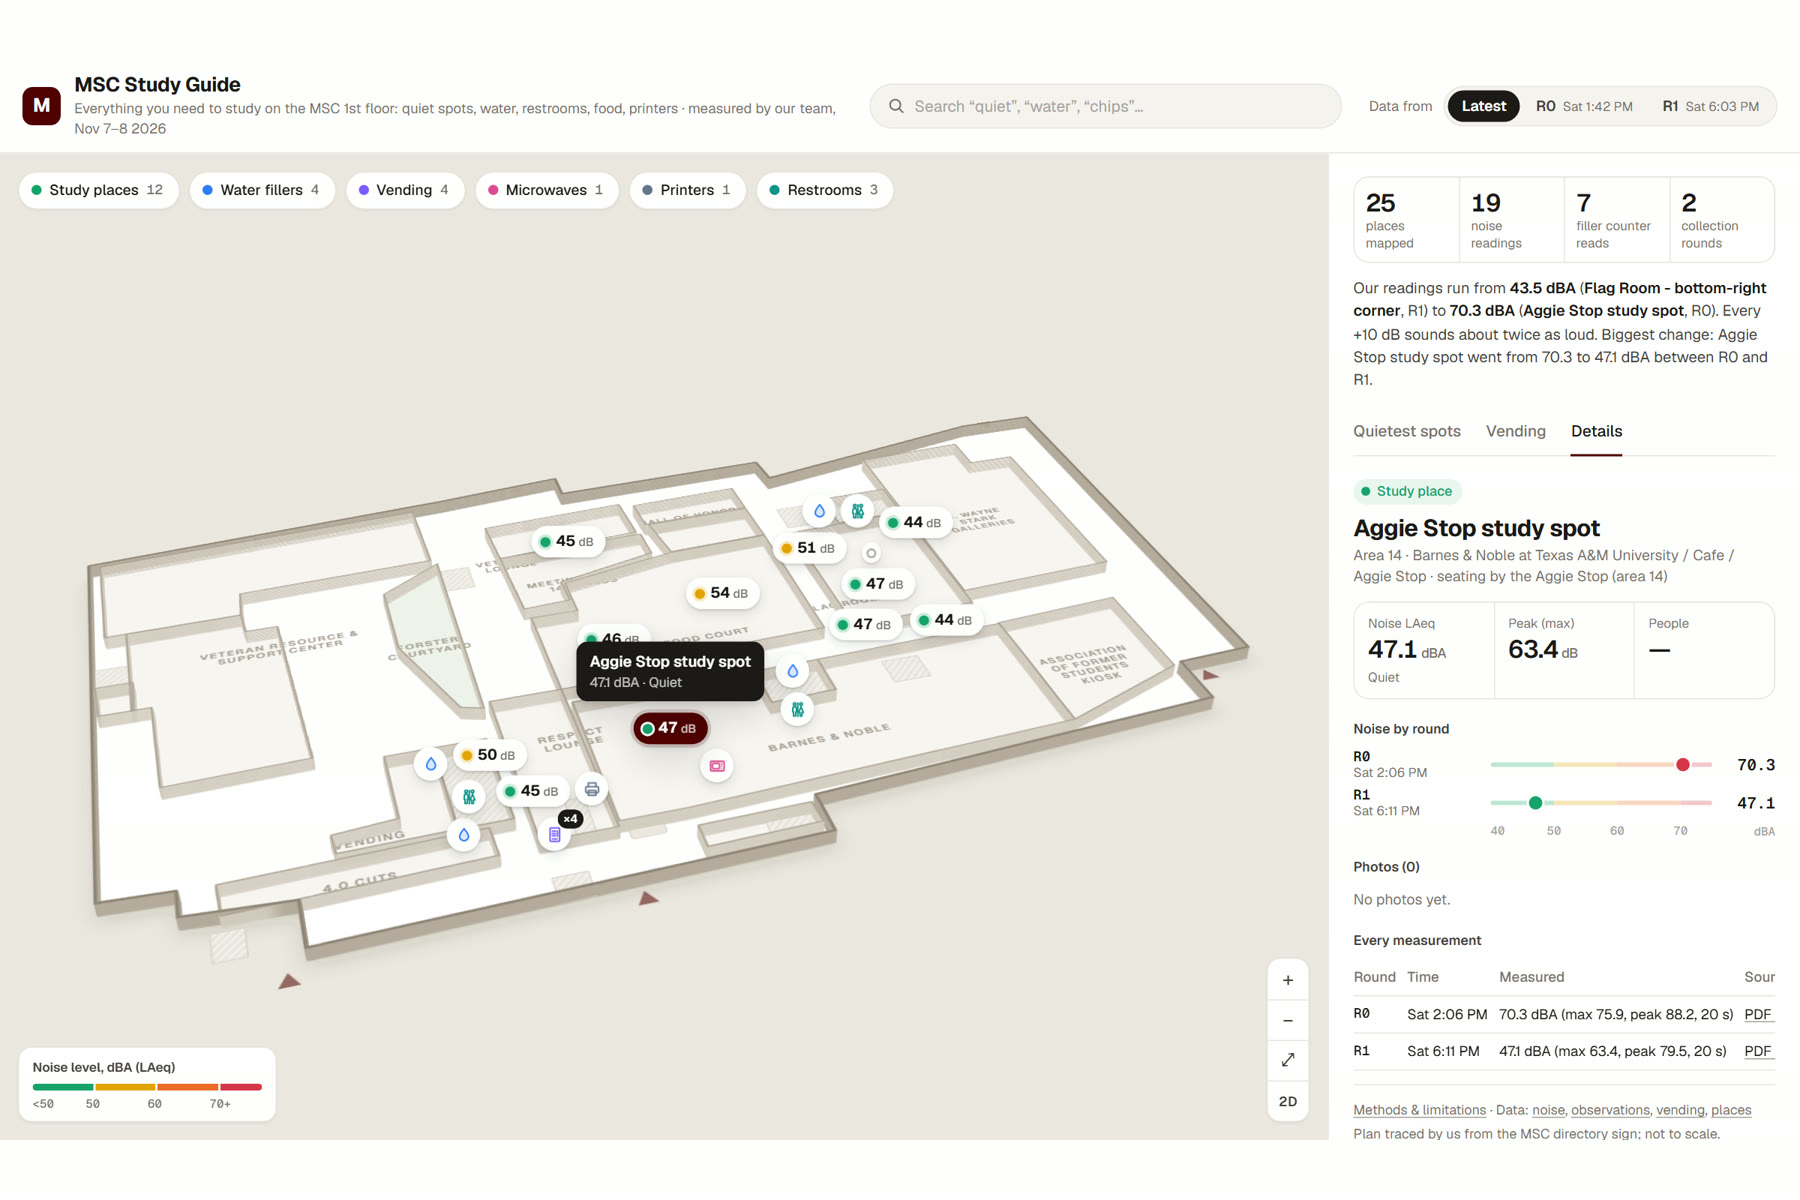
- Details panel: every measurement links to its source, the original NIOSH sound-meter PDF report or our photo, so nothing has to be taken on trust.
- A 2D / 3D view of the floor and small 3D models of each amenity, generated from our data.
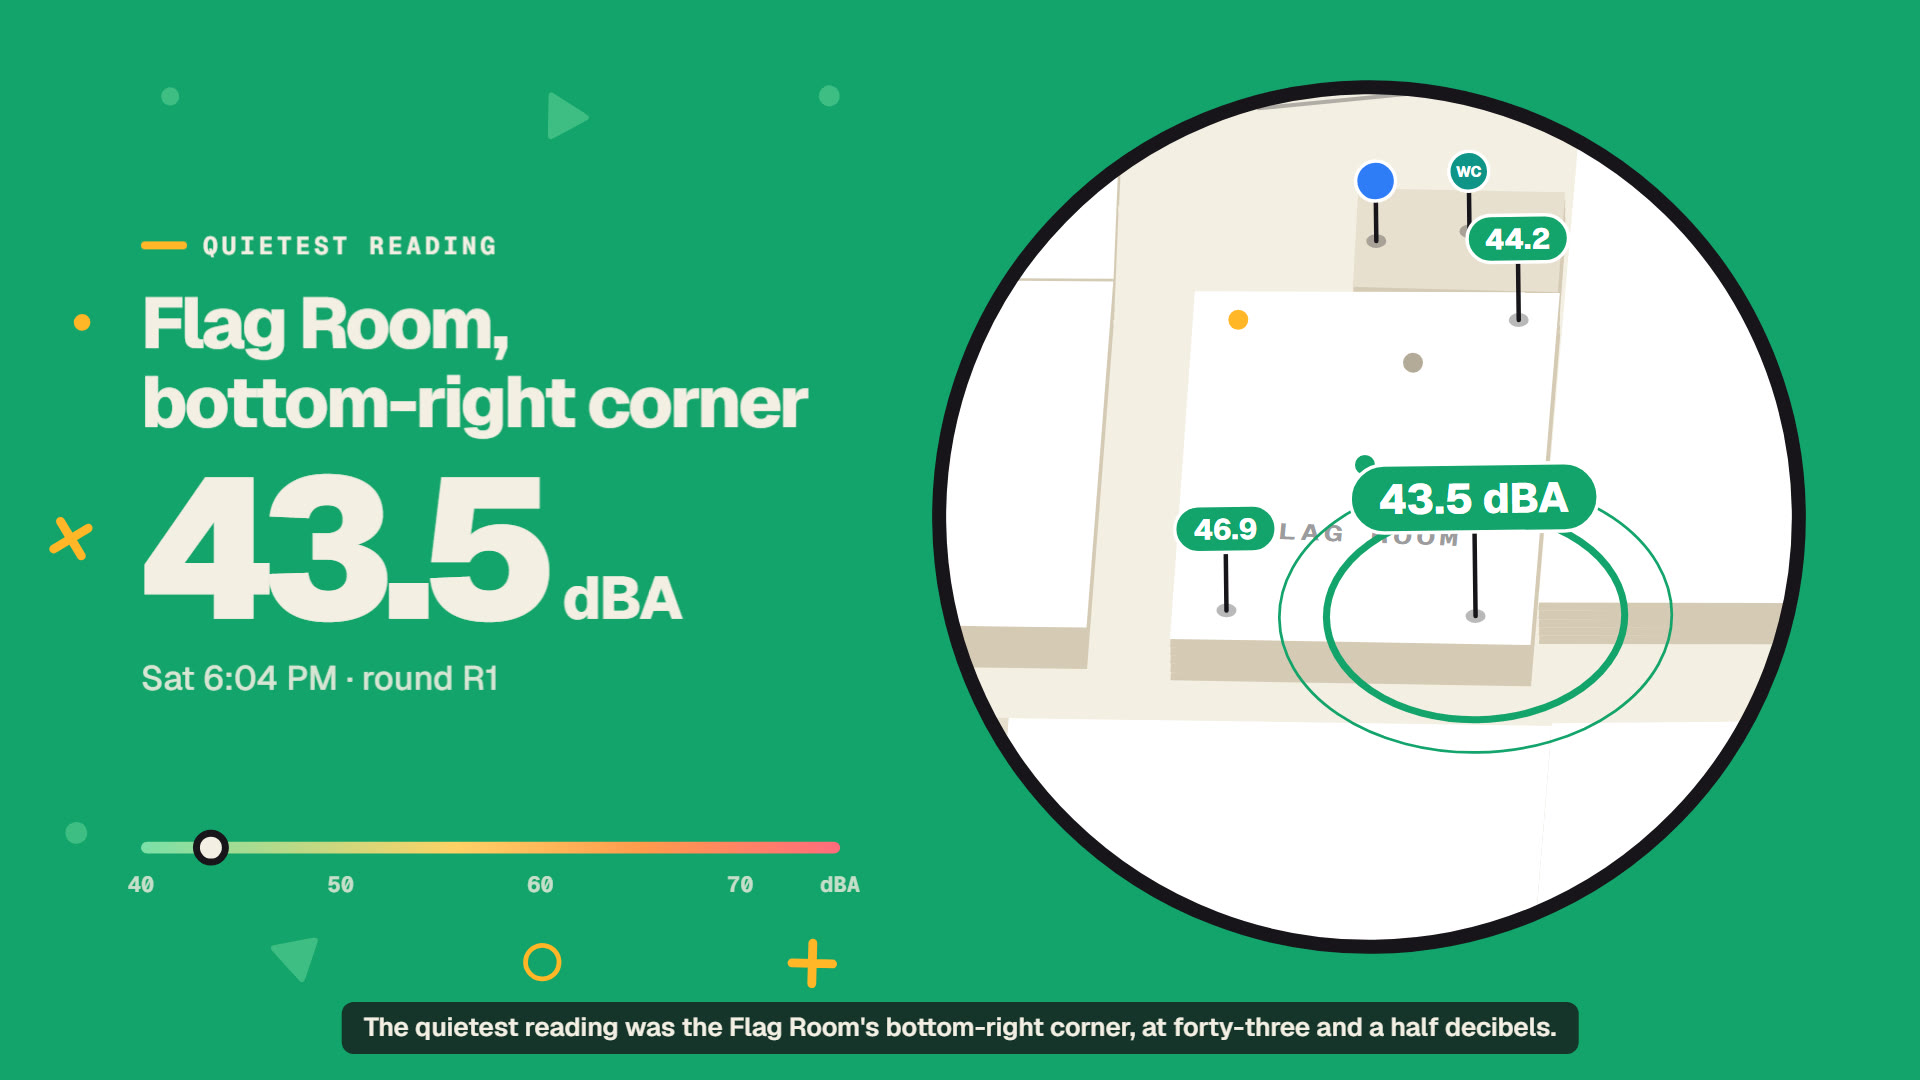
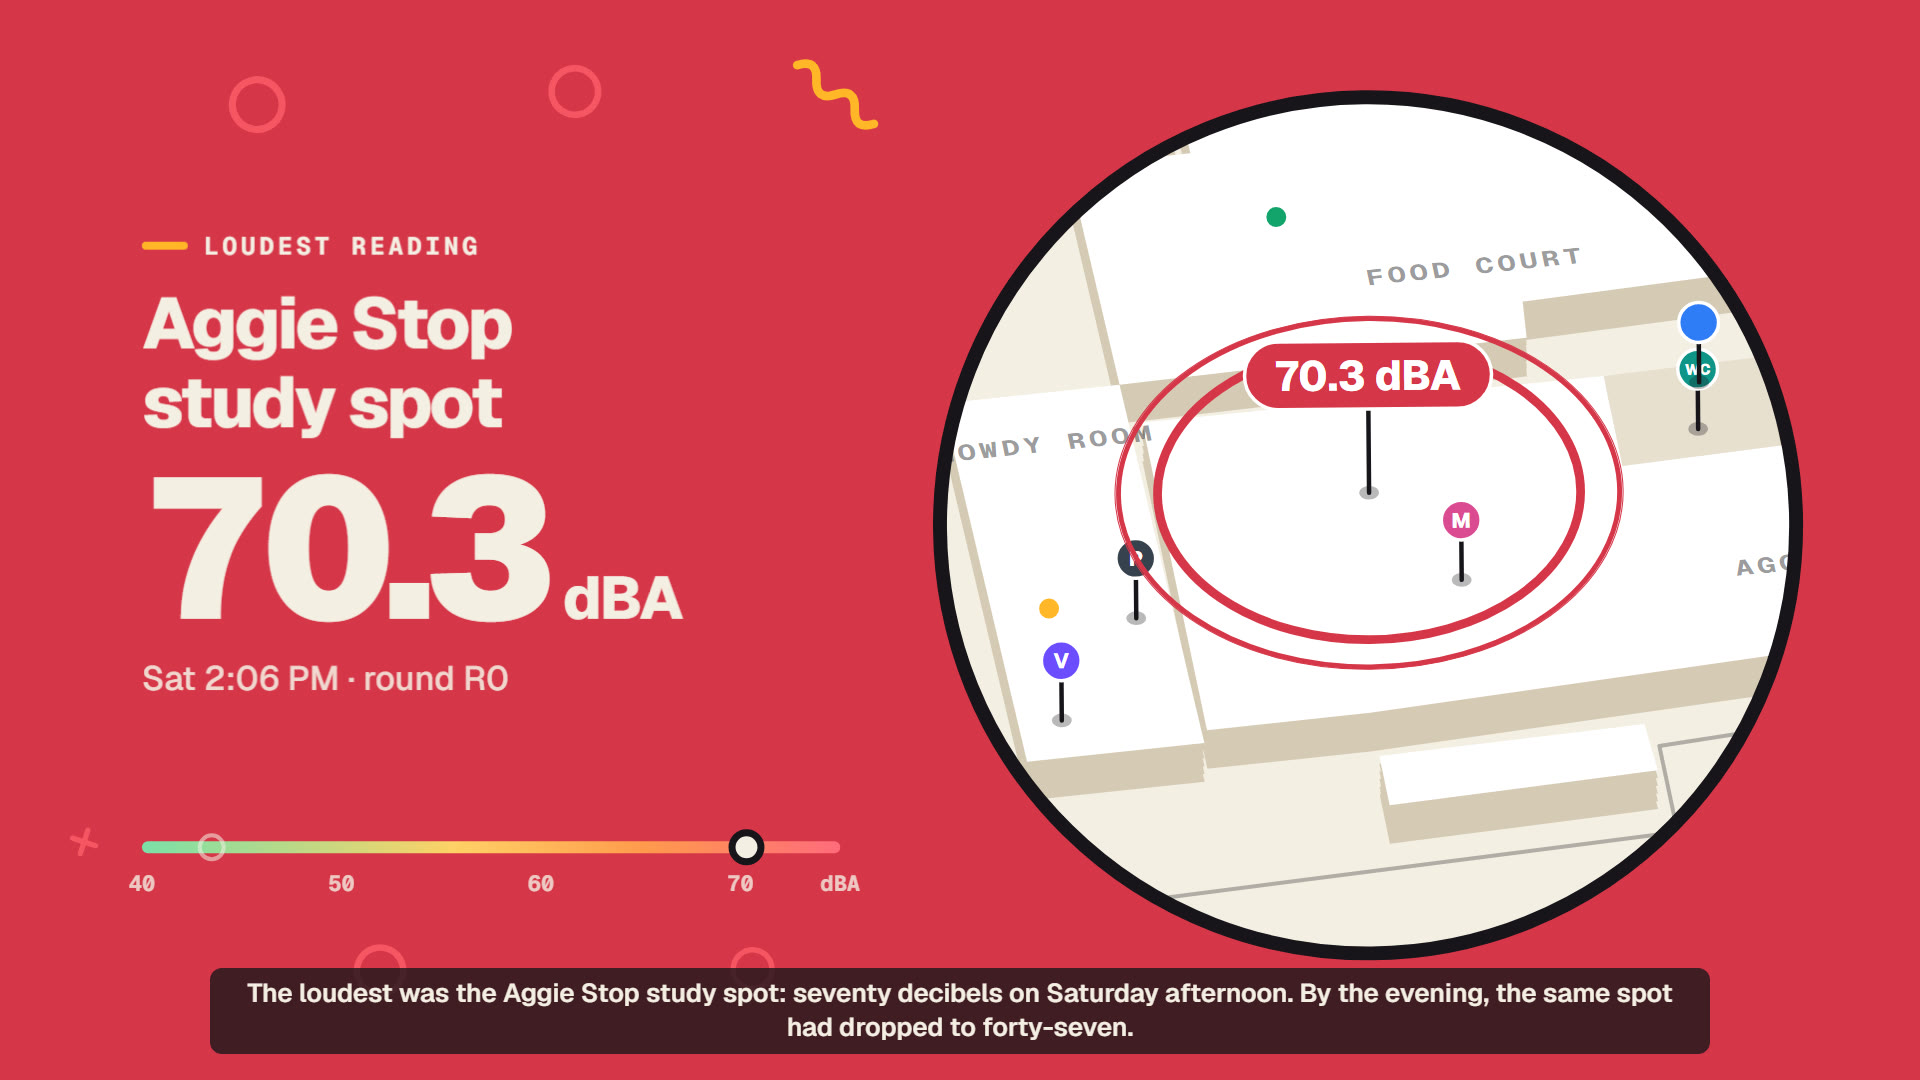
Some findings: the quietest reading was 43.5 dBA in the Flag Room's bottom-right corner (Sat 6:04 PM). The loudest was the Aggie Stop study spot at 70.3 dBA (Sat 2:06 PM); by the evening the same spot had dropped to 47.1 dBA, 23 dB quieter. When you go matters as much as where.
How we built it
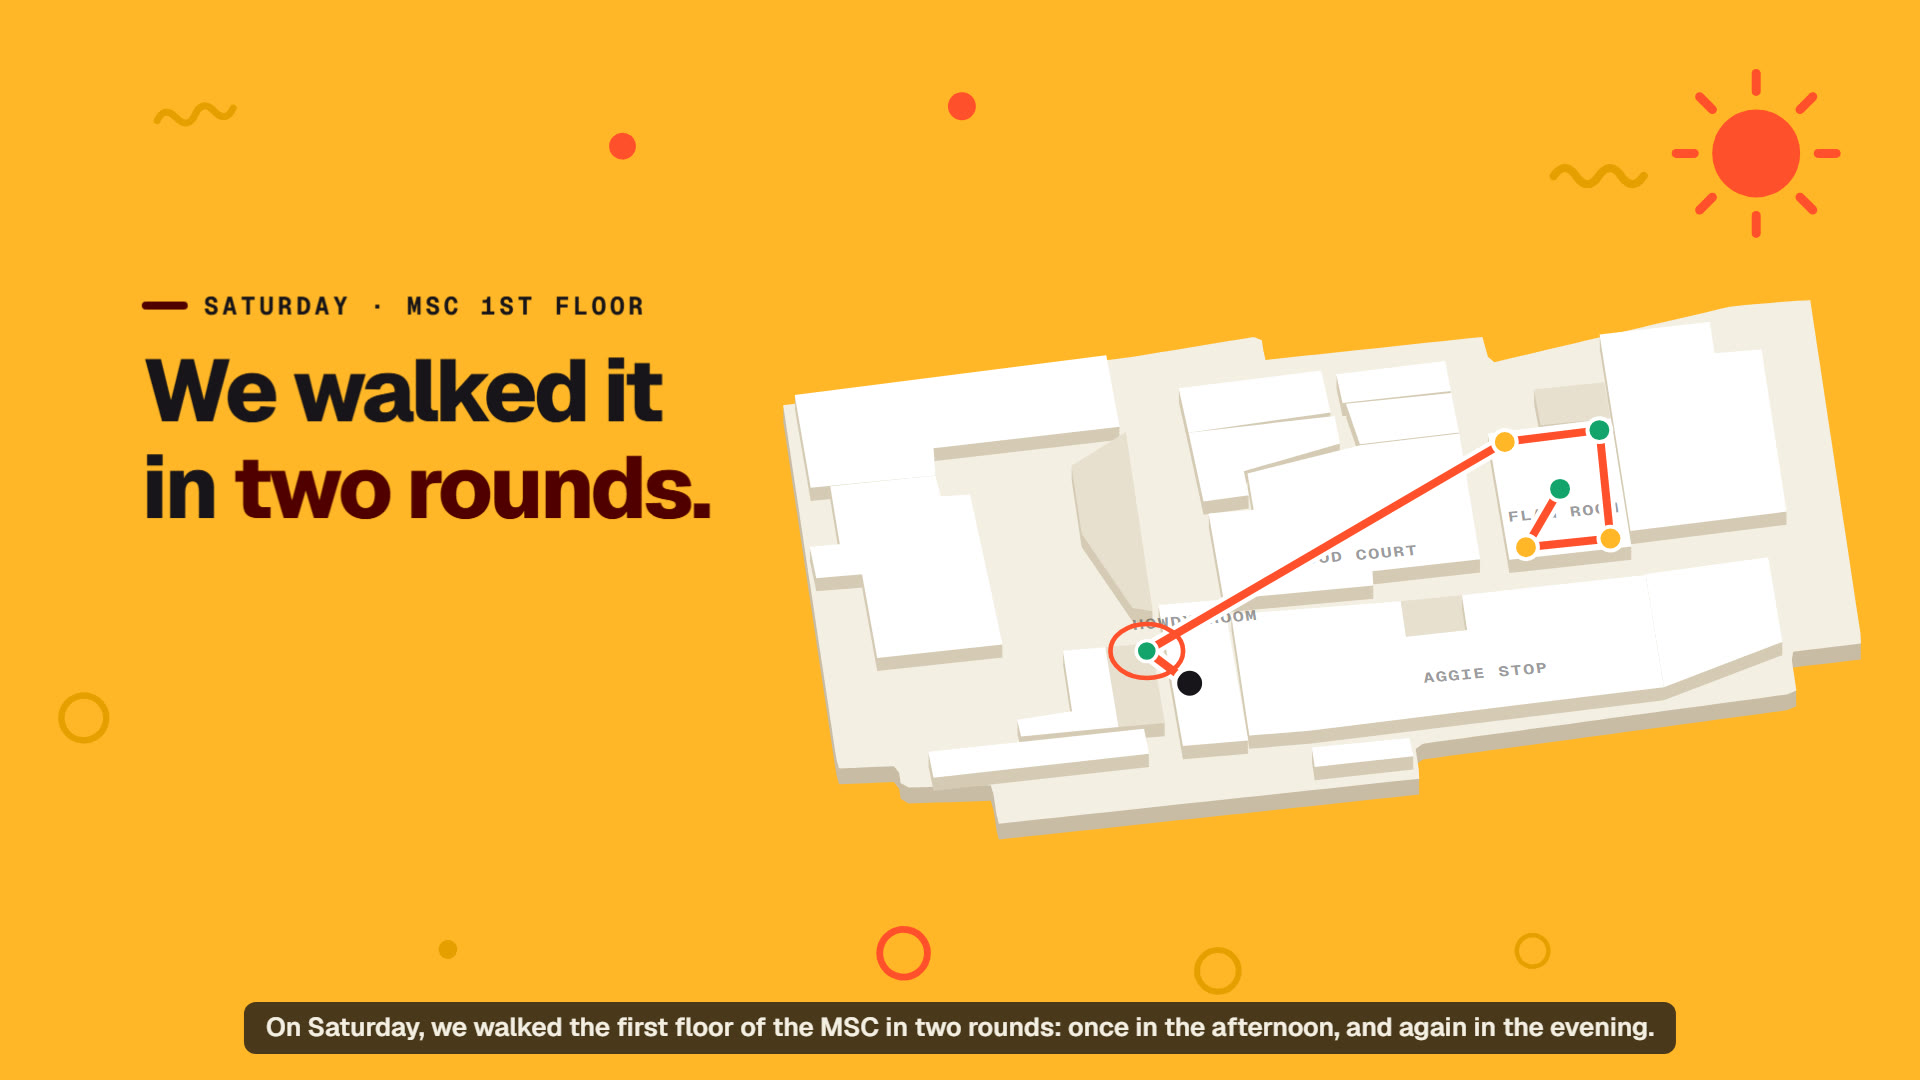
- Collection: we walked a fixed route through every study spot and amenity on the 1st floor, twice on Saturday. At each study spot we recorded about 20 seconds of sound with the NIOSH Sound Level Meter app and exported a PDF report. At each water filler we read the "bottles saved" counter and photographed the display. We photographed each vending machine's front and payment panel, and checked the microwaves and printers.
- Locating places: there is no public indoor floor plan, so we photographed the MSC directory sign, marked every place on it, and hand-traced our own schematic plan in the same pixel frame. Each place's x/y comes straight from that photo.
- Pipeline: Python scripts parse the PDF reports into
noise.csv, strip EXIF and GPS from the photos and resize them, merge the field notes, and run data-quality checks (IDs, value ranges, counter monotonicity, files present). - App: a static HTML/CSS/JavaScript site. The map is our own SVG renderer with value pins, pan/zoom, clustering and pin collision handling; Three.js draws the amenity models. No backend is needed, so it runs from any static host.
- Video: generated from code. The voiceover is synthesized with edge-tts, every frame is rendered in headless Chromium, and every number shown on screen is read from our CSVs.
Challenges we ran into
- No floor plan to build on. The official MSC plans are event-space drawings and copyrighted, so we traced our own plan from the directory sign.
- Making phone measurements trustworthy. We used one phone and one app for every reading, kept the method fixed (spot, height, duration), and attached the raw report to every value.
- A dense map. The Flag Room alone has six measured spots, so pins overlapped. We added clustering, pin repulsion and automatic placement of area labels.
- Privacy in a public building. We never photographed faces or recorded who anyone was; people were only counted. All photo metadata is removed.
Accomplishments that we're proud of
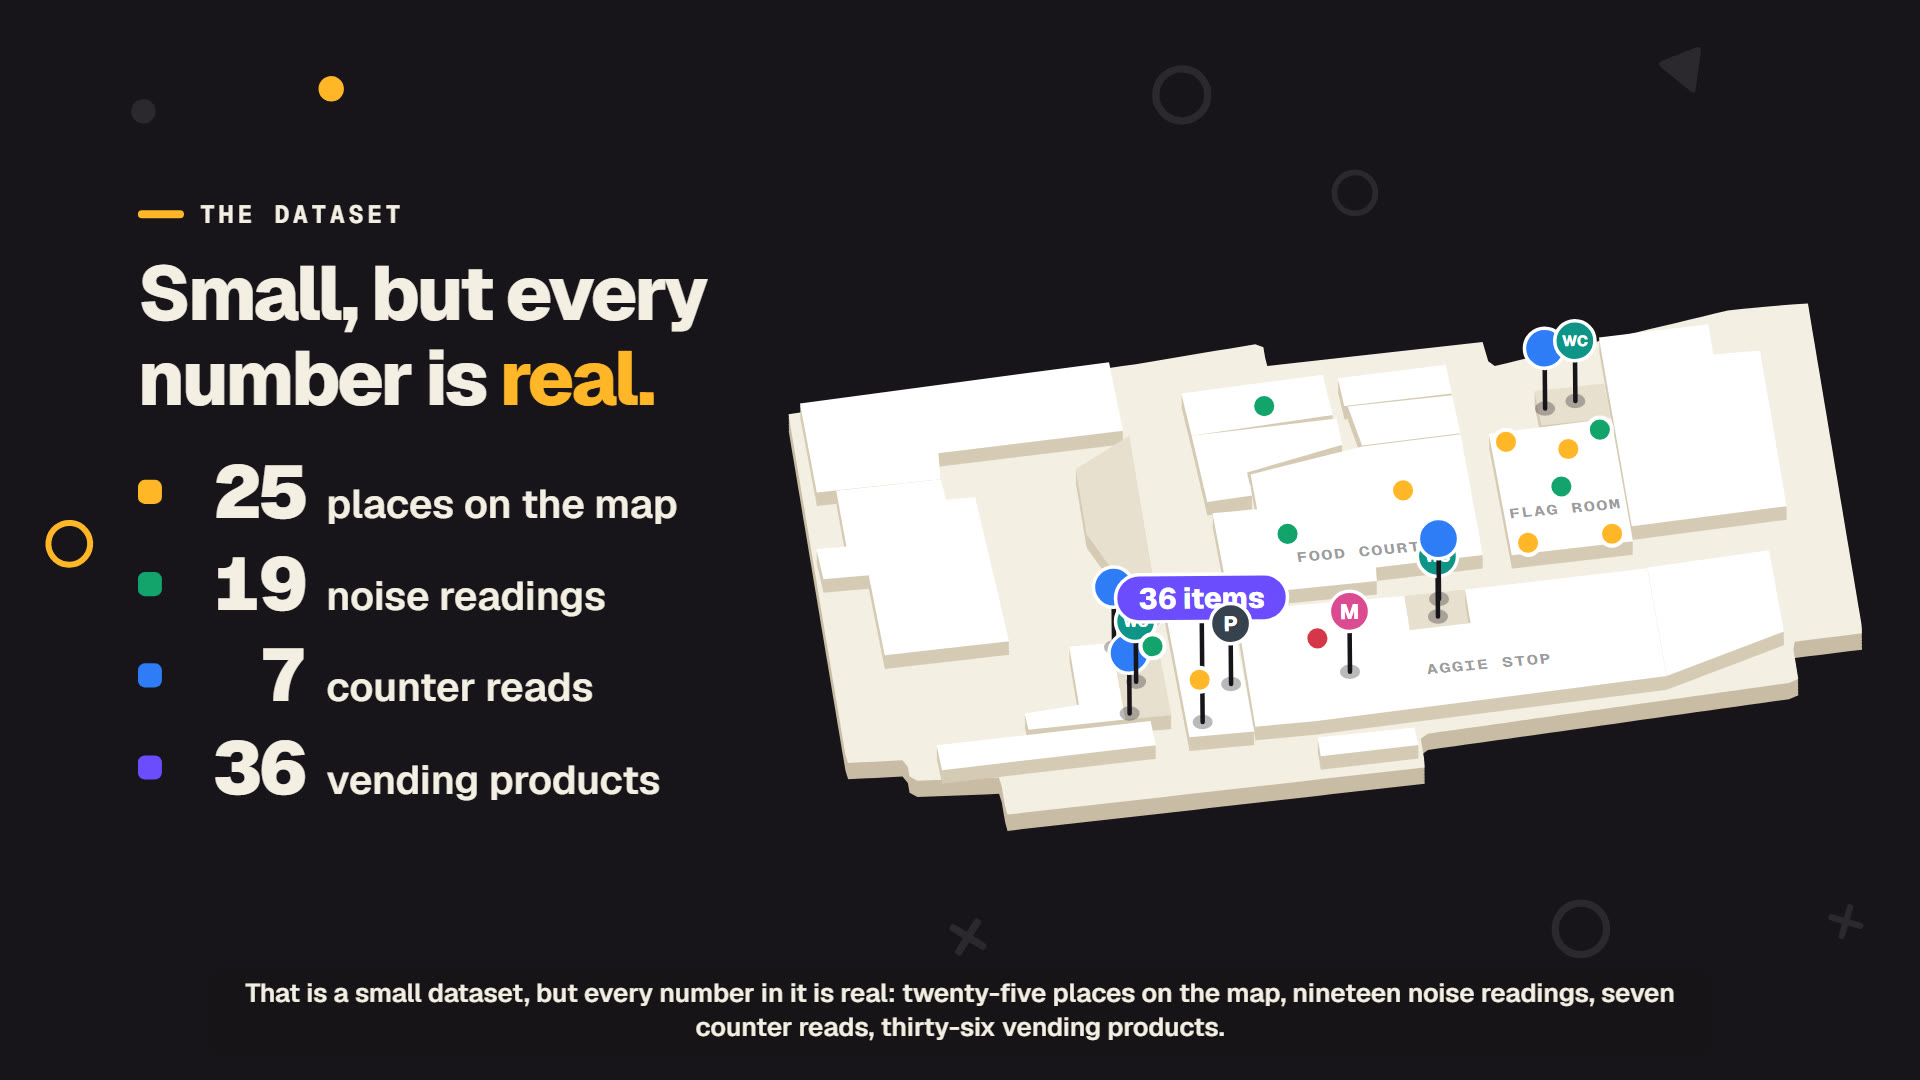
- A small but fully traceable dataset: 25 places, 19 noise readings, 7 water counter reads and 36 vending products. Nothing is simulated.
- Water filler counters used as a usage sensor: +8 bottles across the fillers in about four hours on a quiet Saturday.
- An app where every number links back to the PDF report or photo it came from.
What we learned
- Time matters as much as location: the same spot changed by more than 20 dB between afternoon and evening, and +10 dB sounds about twice as loud.
- Simple physical signals, like a filler's bottle counter, can be turned into data with nothing but a phone camera.
- Fixing the method first (route, duration, device) made the data far easier to clean and compare.
What's next for MSC Study Guide
- More rounds, including weekdays and exam weeks, to turn snapshots into typical patterns.
- The other MSC floors and the West Wing, then other study buildings.
- Letting students submit readings from their own phones with the same method, so the map stays current.
- Seat occupancy alongside noise, to show where it is both quiet and free.
