-
-
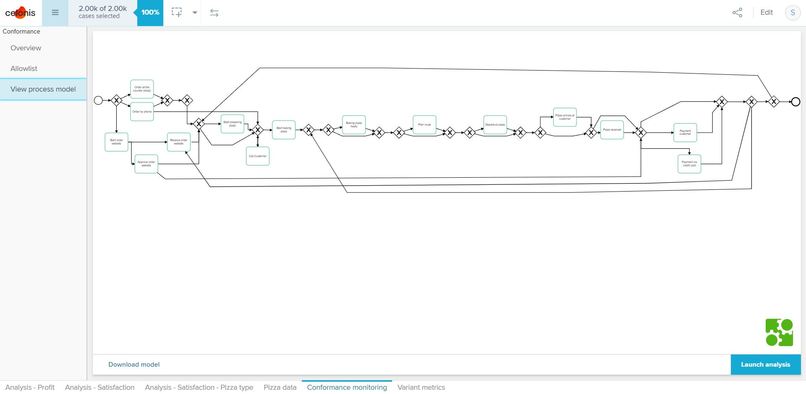
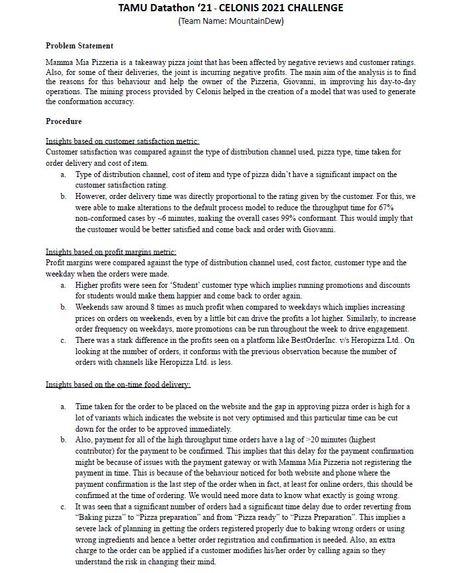
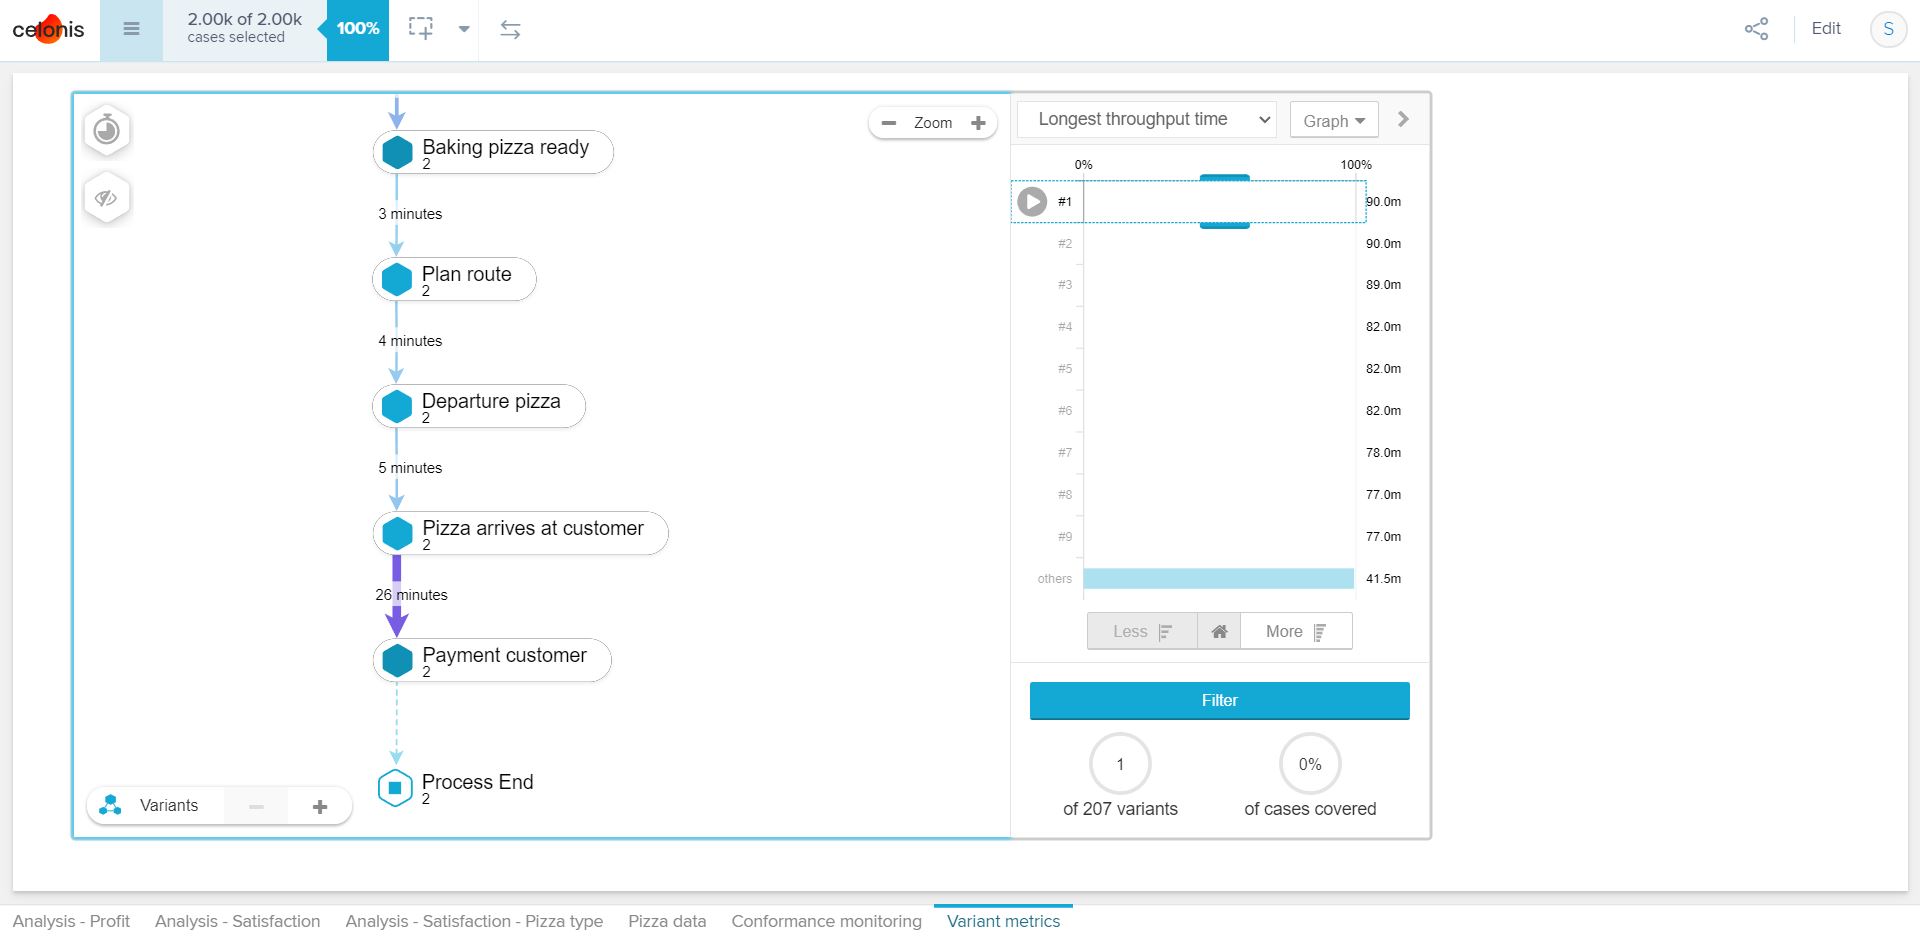
Process model
-
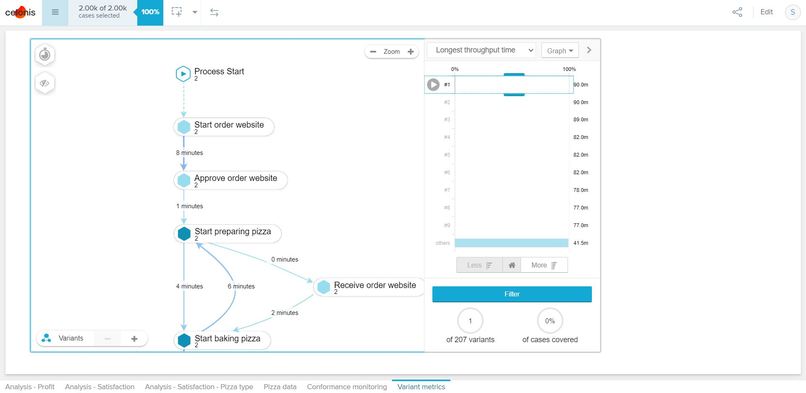
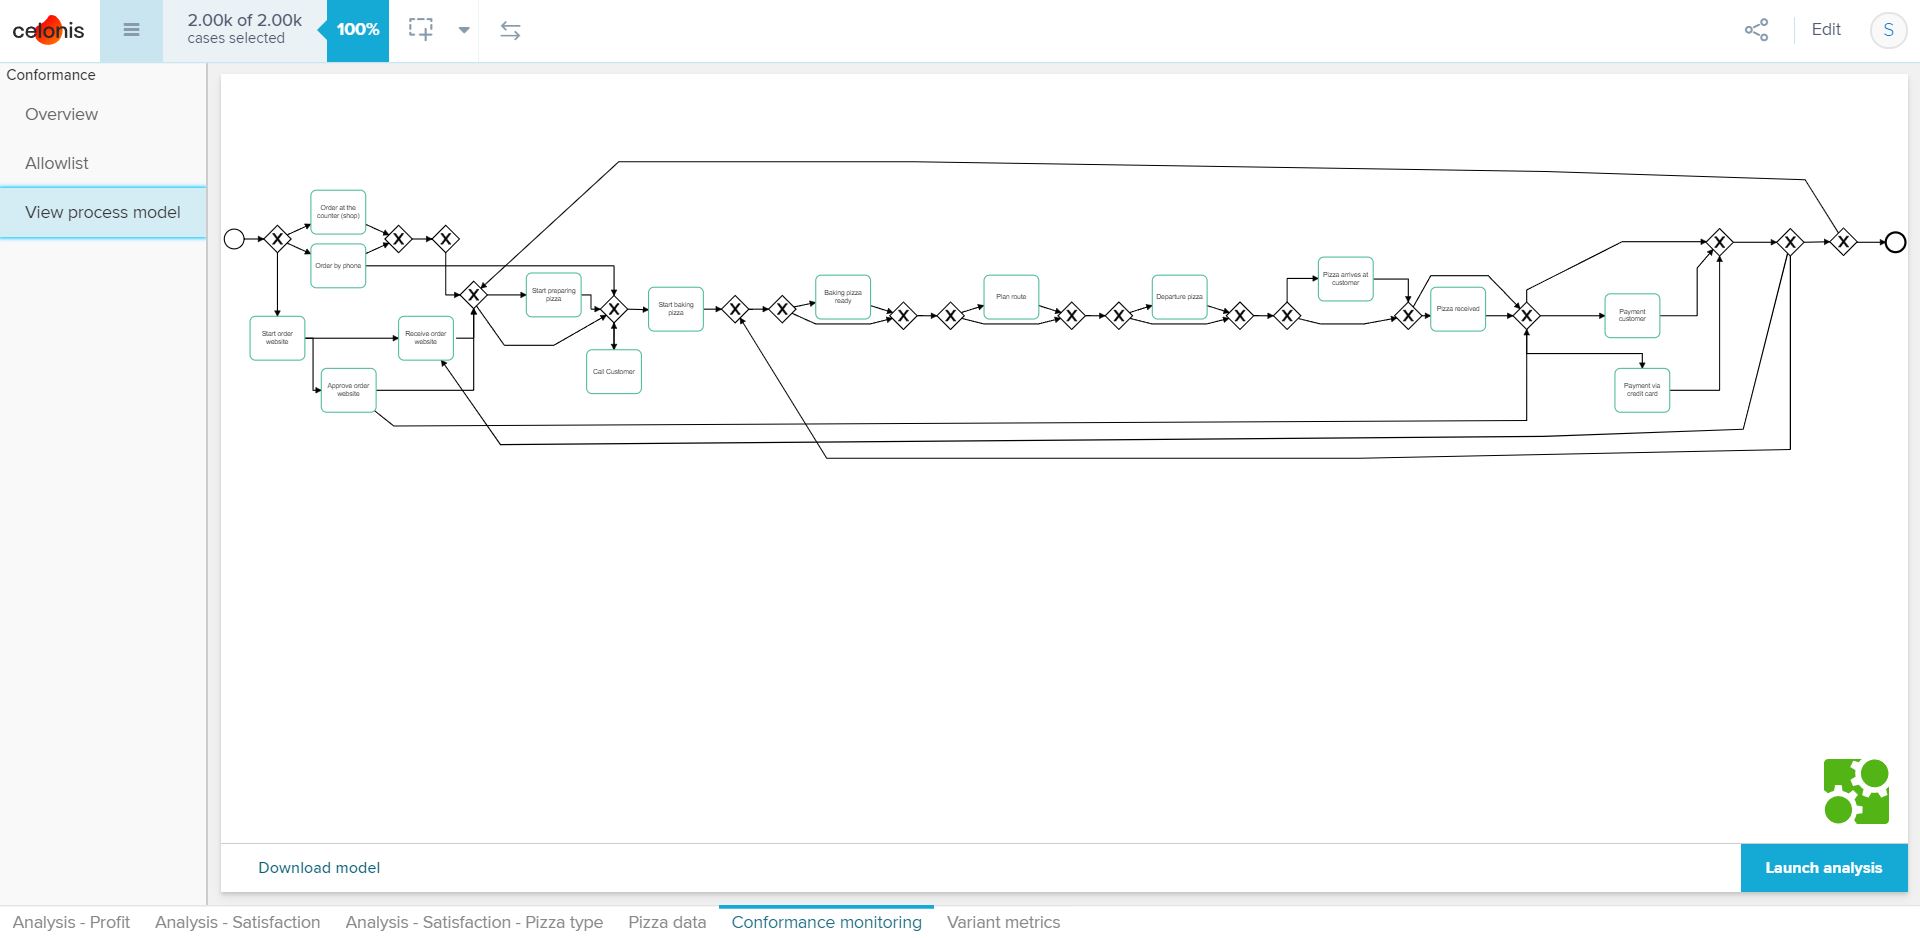
Variance Metrics 1
-
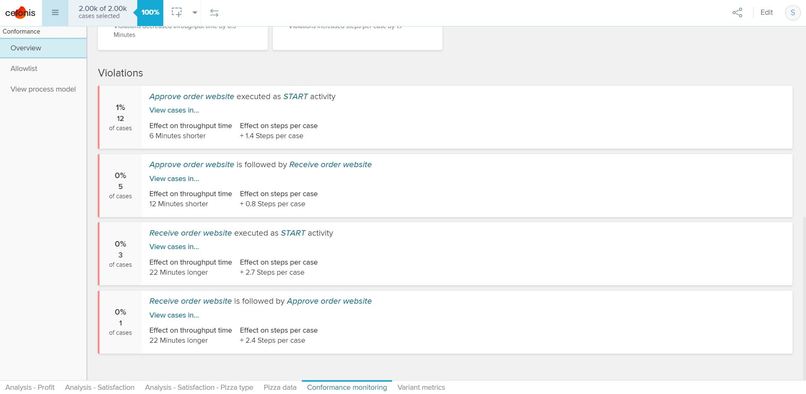
Violating vs Conforming cases 2
-
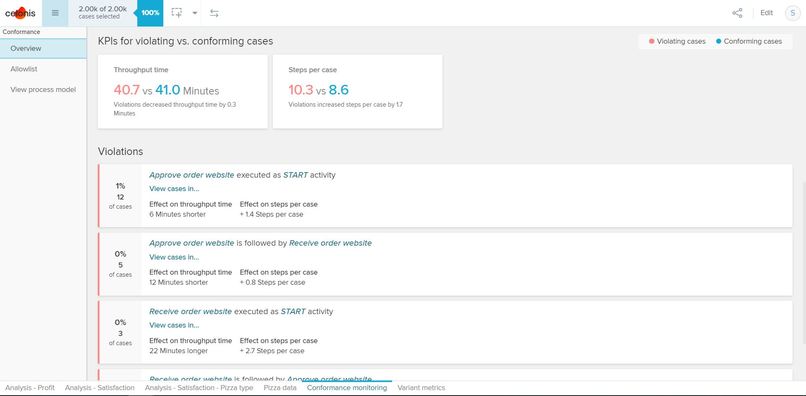
Violating vs Conforming cases 1
-

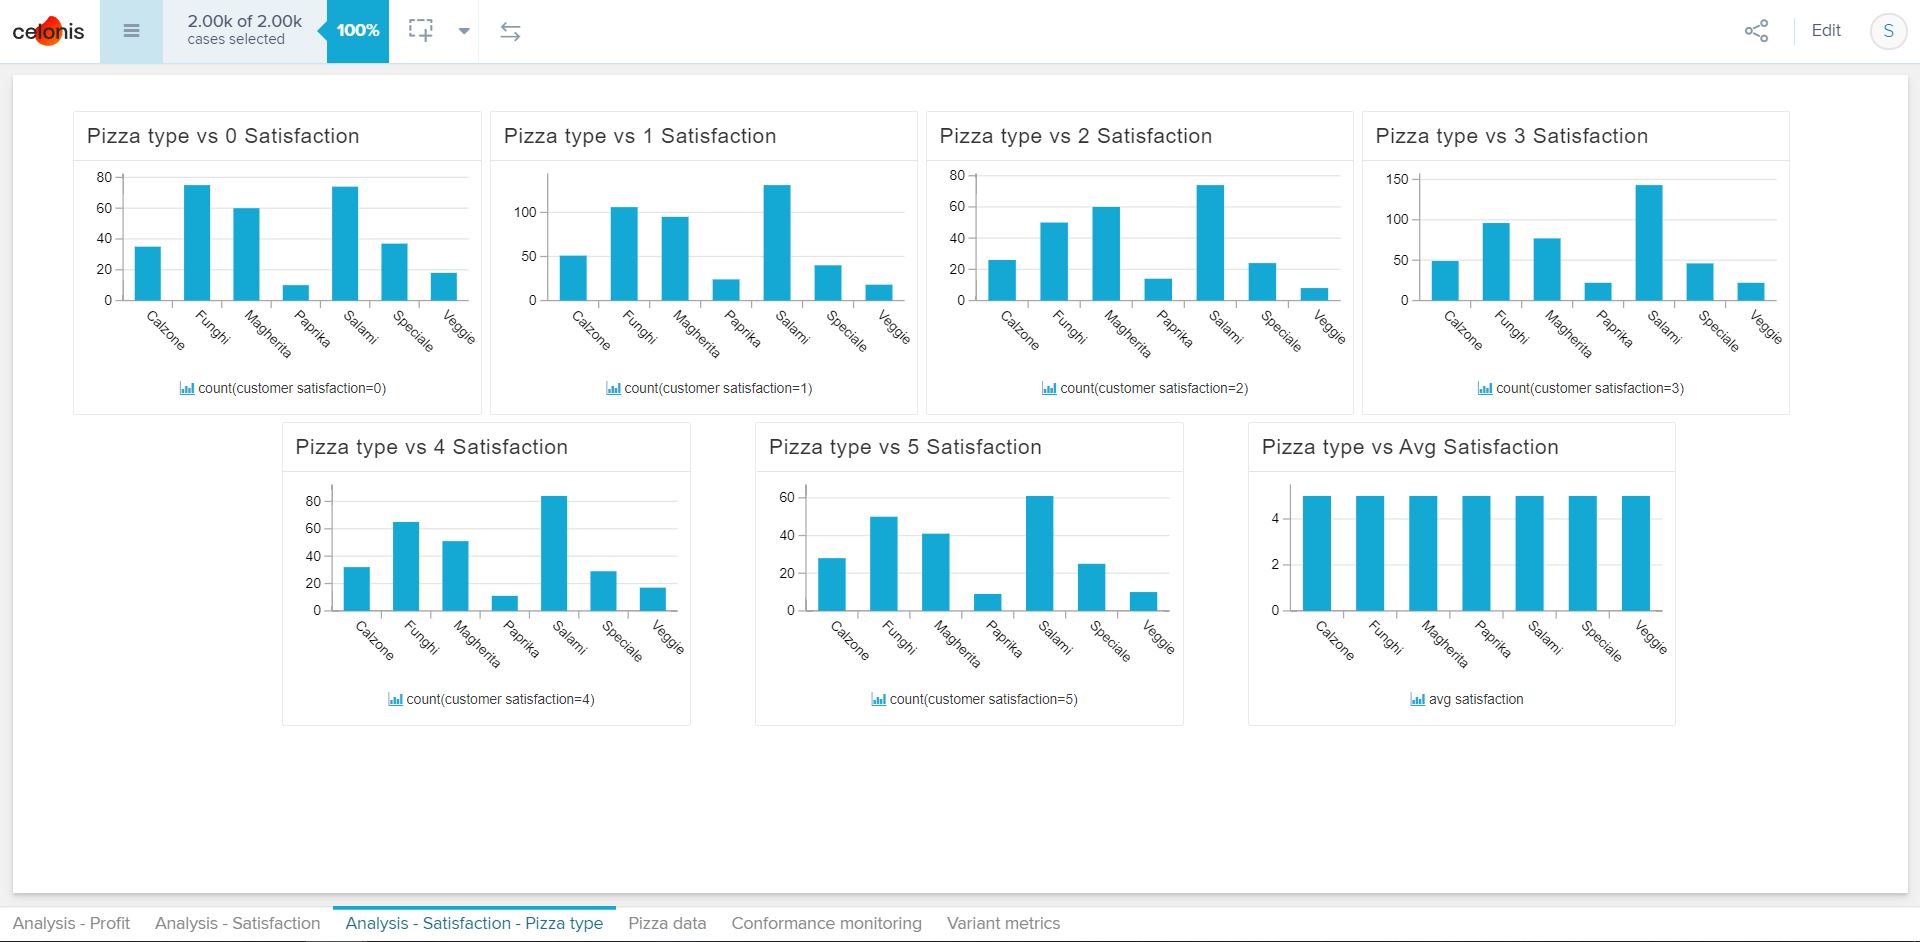
Analysis of Customer Satisfaction, Pizza Type
-

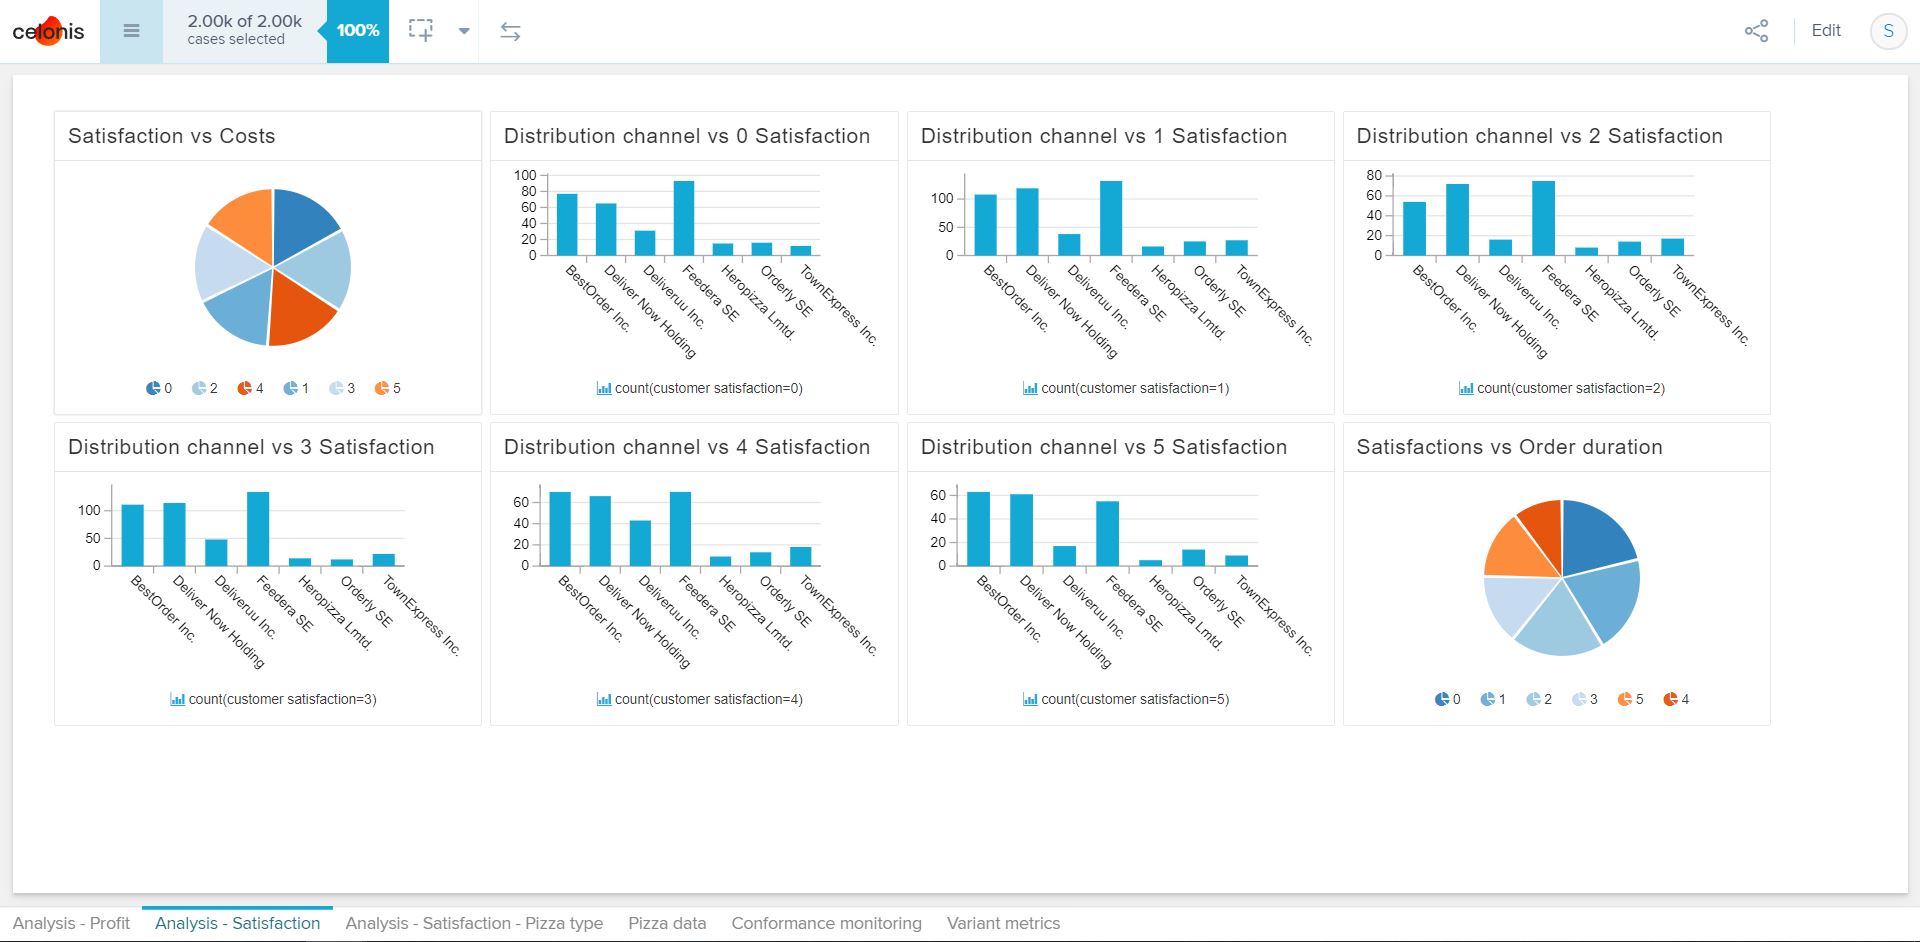
Analysis of Customer Satisfaction
-
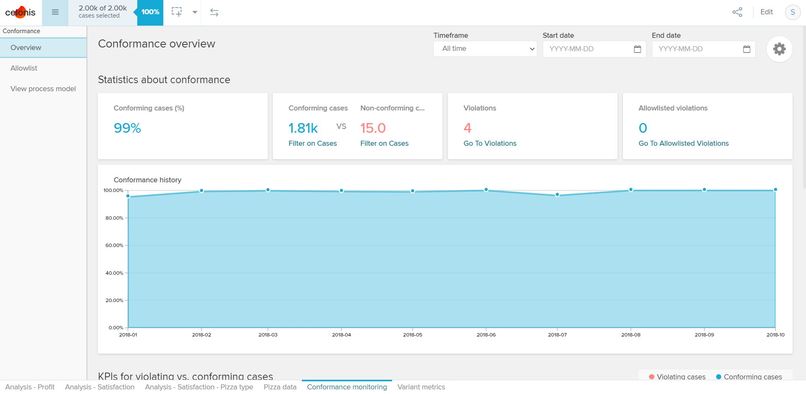
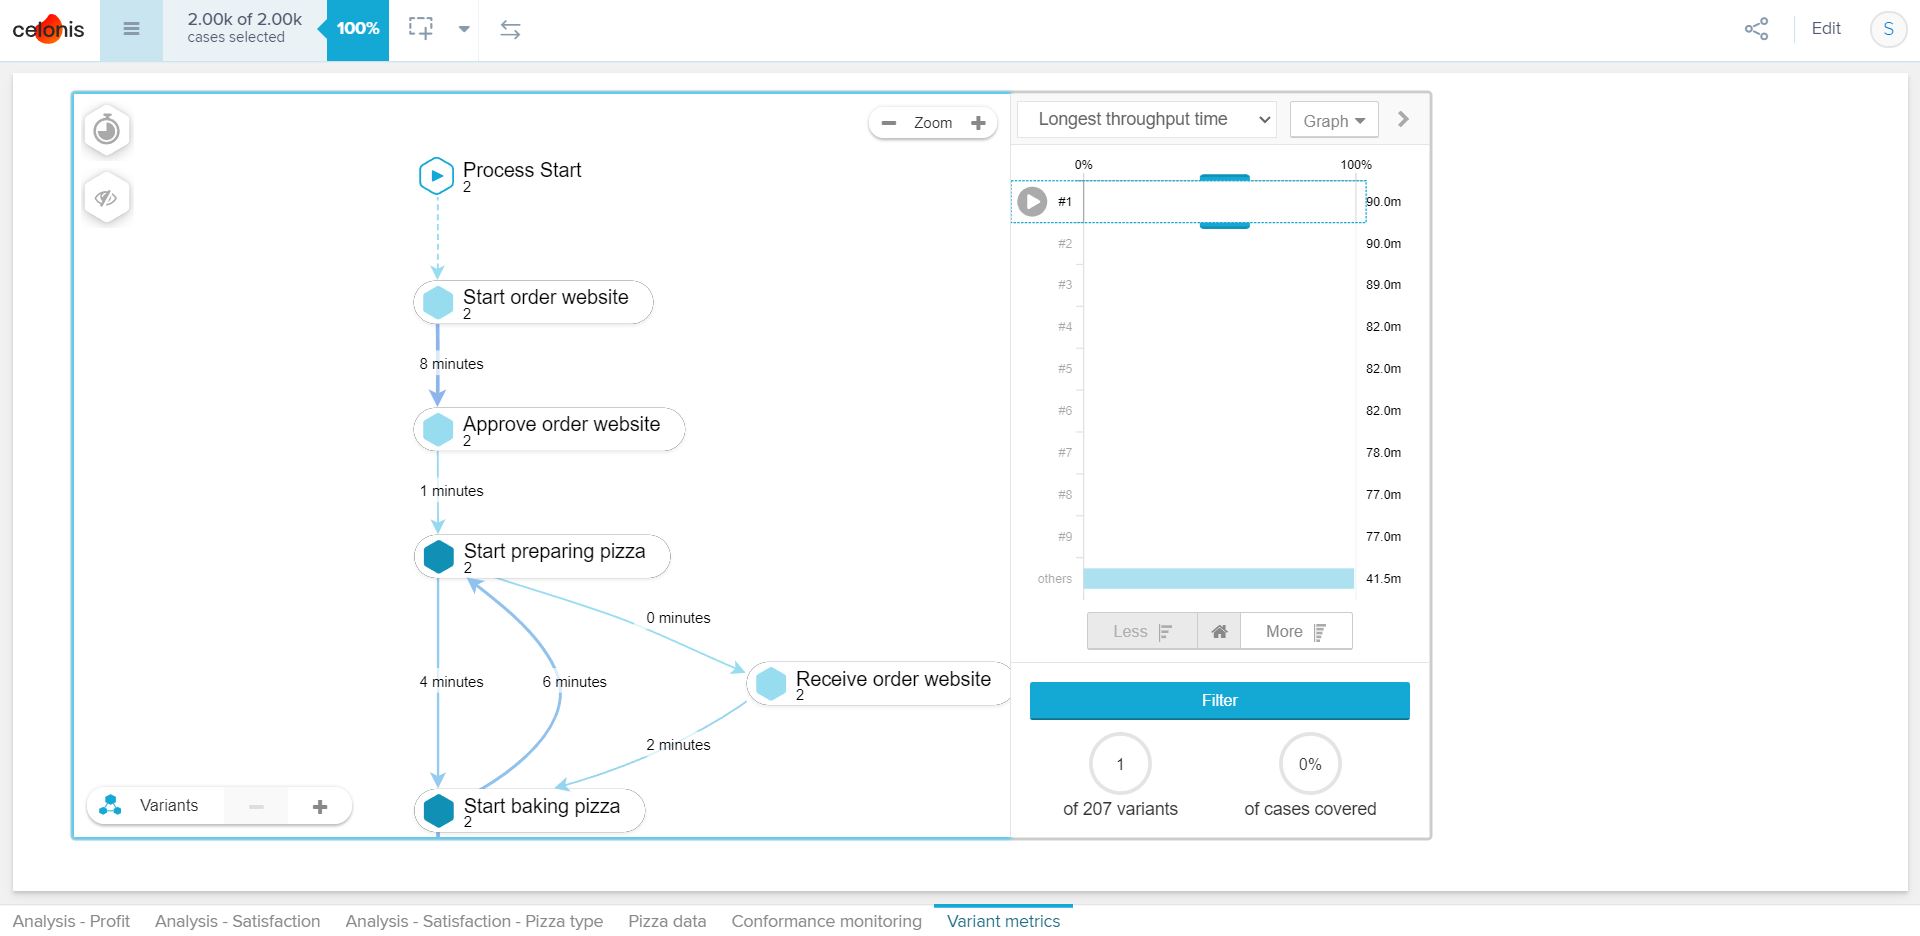
Conformance statistics 1
-
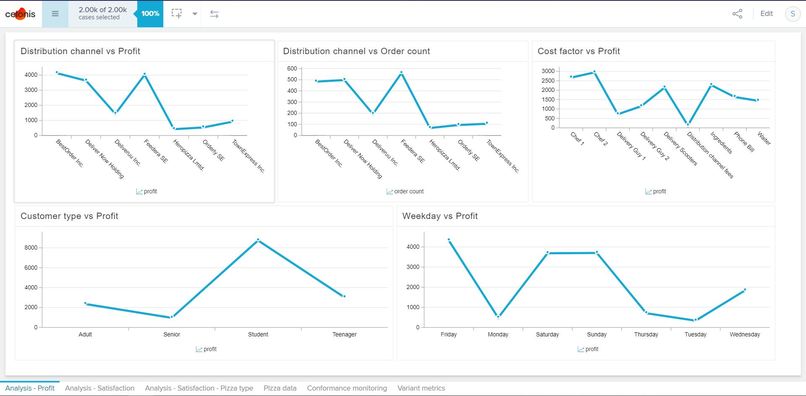
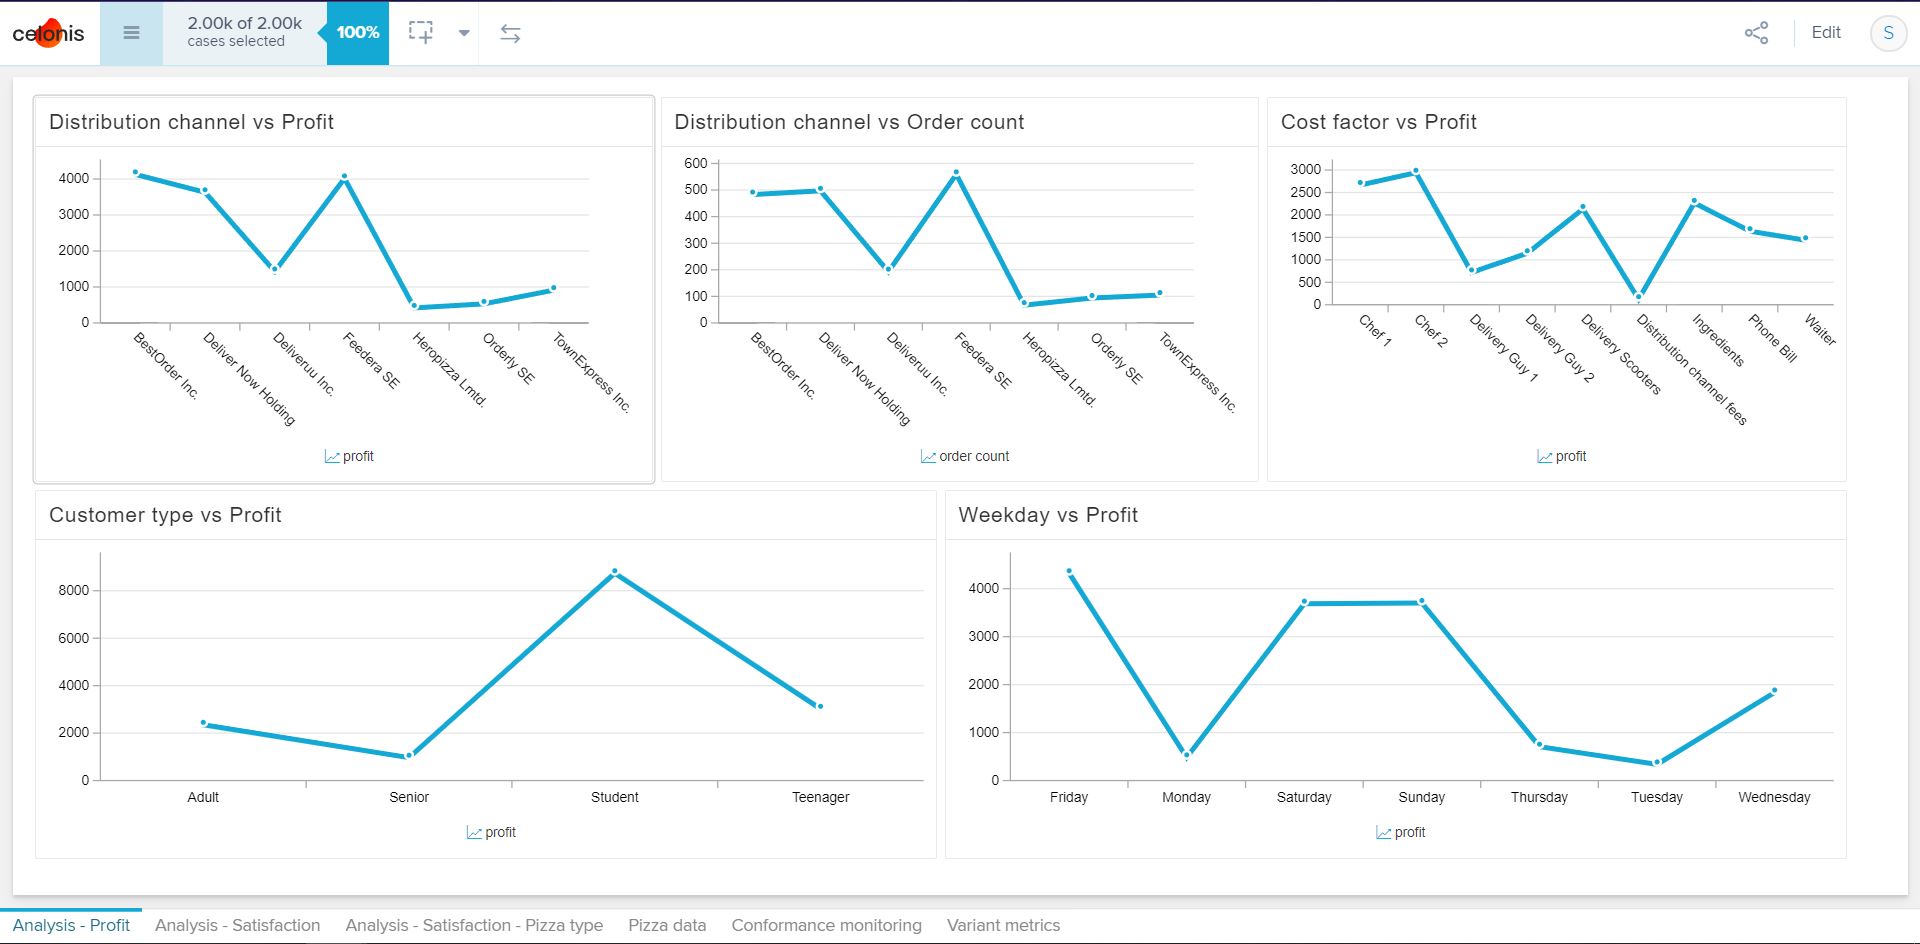
Analysis of Profit
-
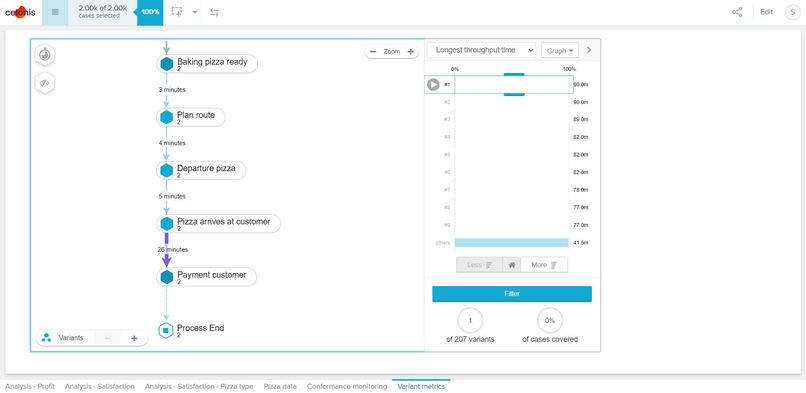
Variance Metrics 2
-
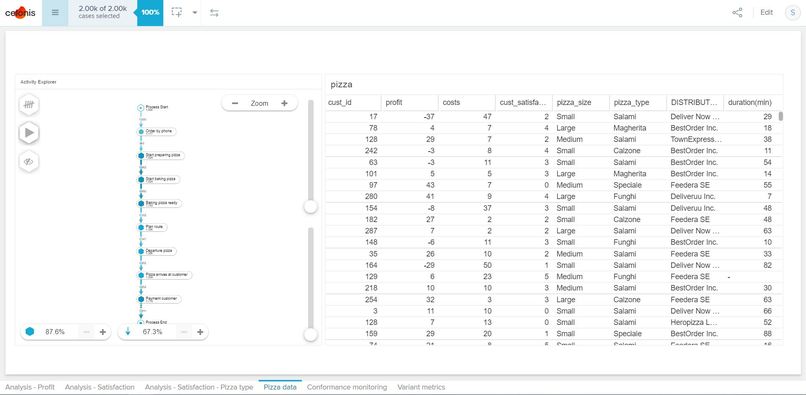
OLAP data
-
1-page write up


Inspiration
The inspiration was to leverage the power of data visualizations to provide accurate recommendations for the end user just by looking at some of the process data.
What it does
The project contains charts that can be provided to the owner of the Pizzeria that show various metrics that are relevant to the improvement in the rating, positive feedback, and increase revenue.
How we built it
We have built a model that conforms with the dataset of Mamma Mia Pizzeria with a conformity rate of 76%. The datasets were analyzed by making various charts and graphs using Celonis as well as python in local machine. Once the analysis was done, the model was built using the provided model as a reference. Using the mining tool of Celonis, the model was updated.
Challenges we ran into
Building the initial graphs and charts and doing the initial analysis with the small dataset was a challenge. Since PQL is a new language for us, writing the queries took more time than expected.
Accomplishments that we're proud of
We were able to get a conformity rate of 76%, also reducing the total number of violations from 39 to 22.
What we learned
We learned a new tool as well as a new query language. We also gained insight into the power of process data mining and how it can be used to improve processes.
What's next for MountainDew_Celonis_2021_Challenge
It would be interesting the impact of recommendations learned from the various visualizations after performing process mining to see its real impact. This will help in gauging the impact of the process.
Built With
- celonis
- pql
- python


Log in or sign up for Devpost to join the conversation.