-
-
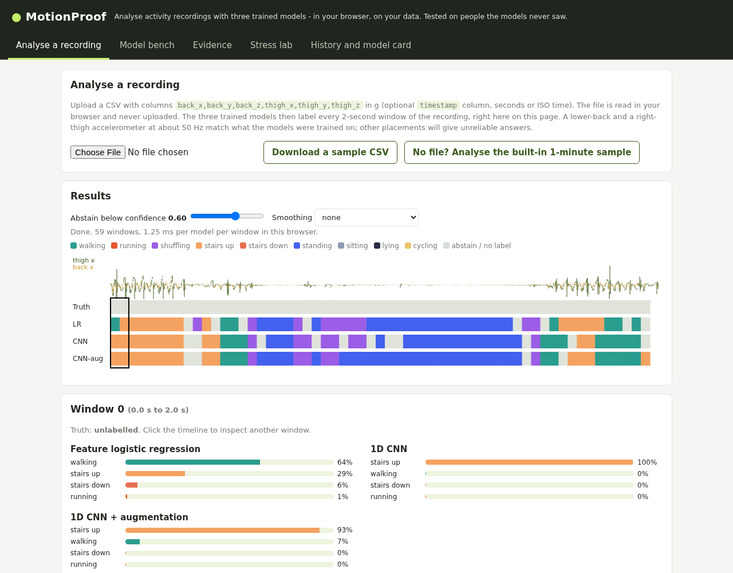
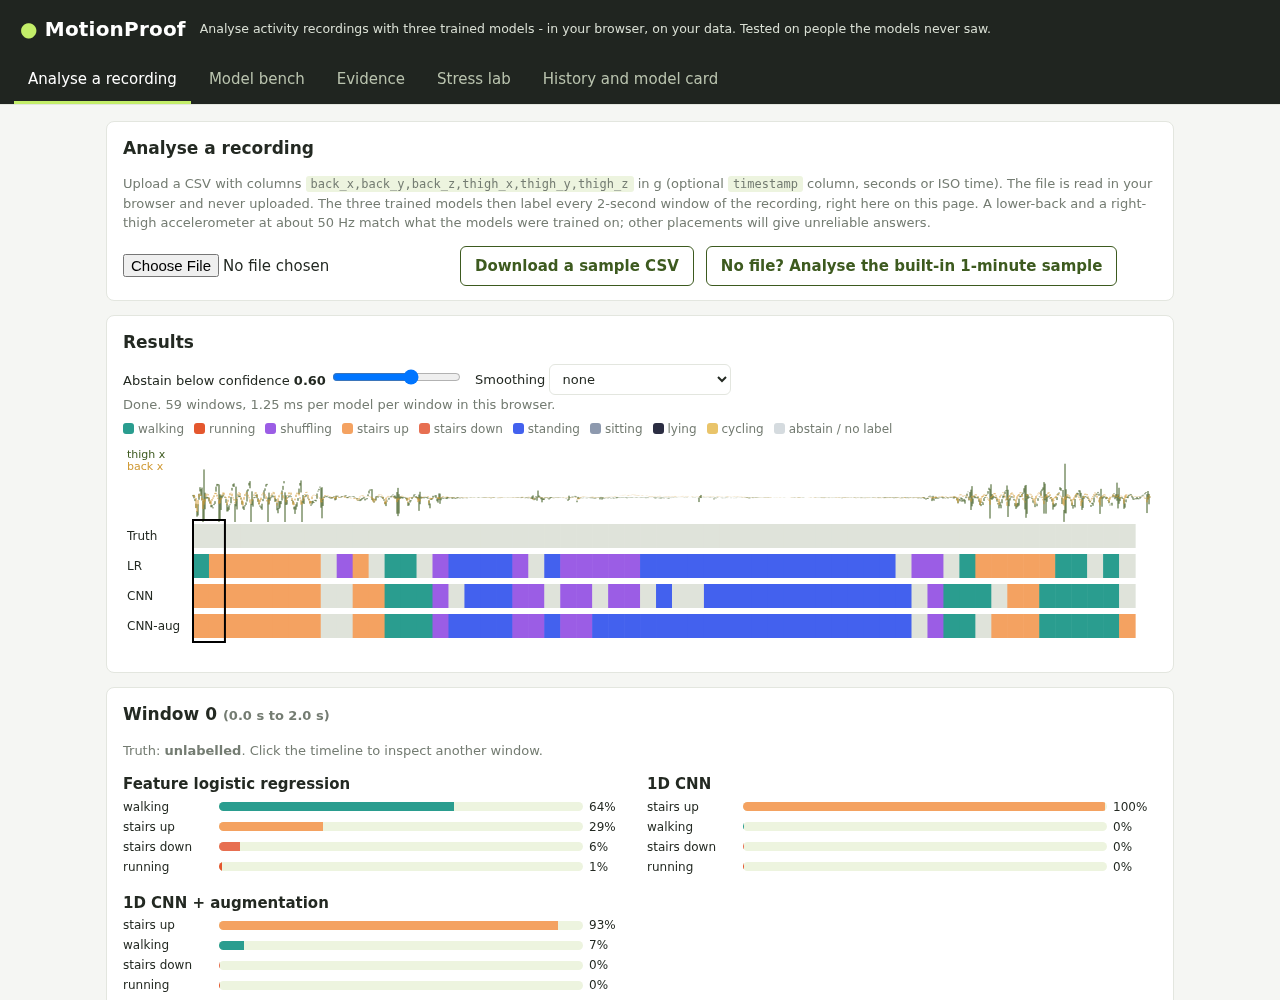
Analyse a recording: your CSV, three trained models and the true activity side by side, with an abstain slider (current app).
-
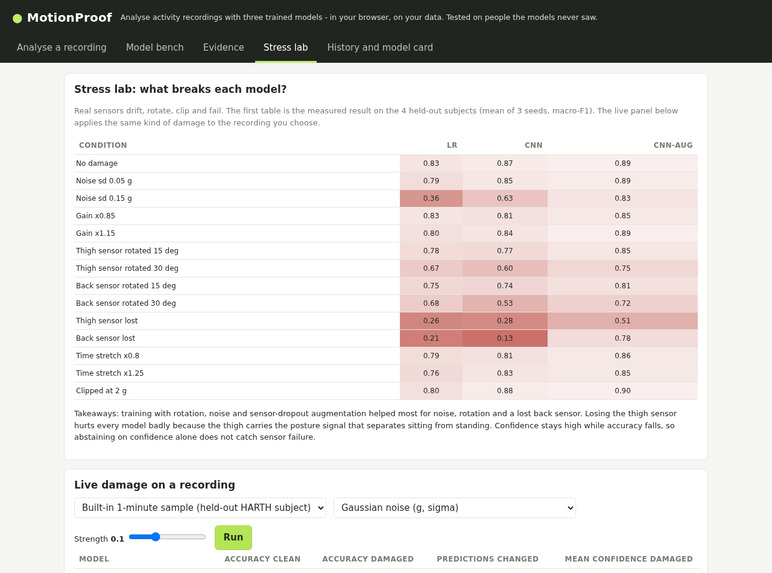
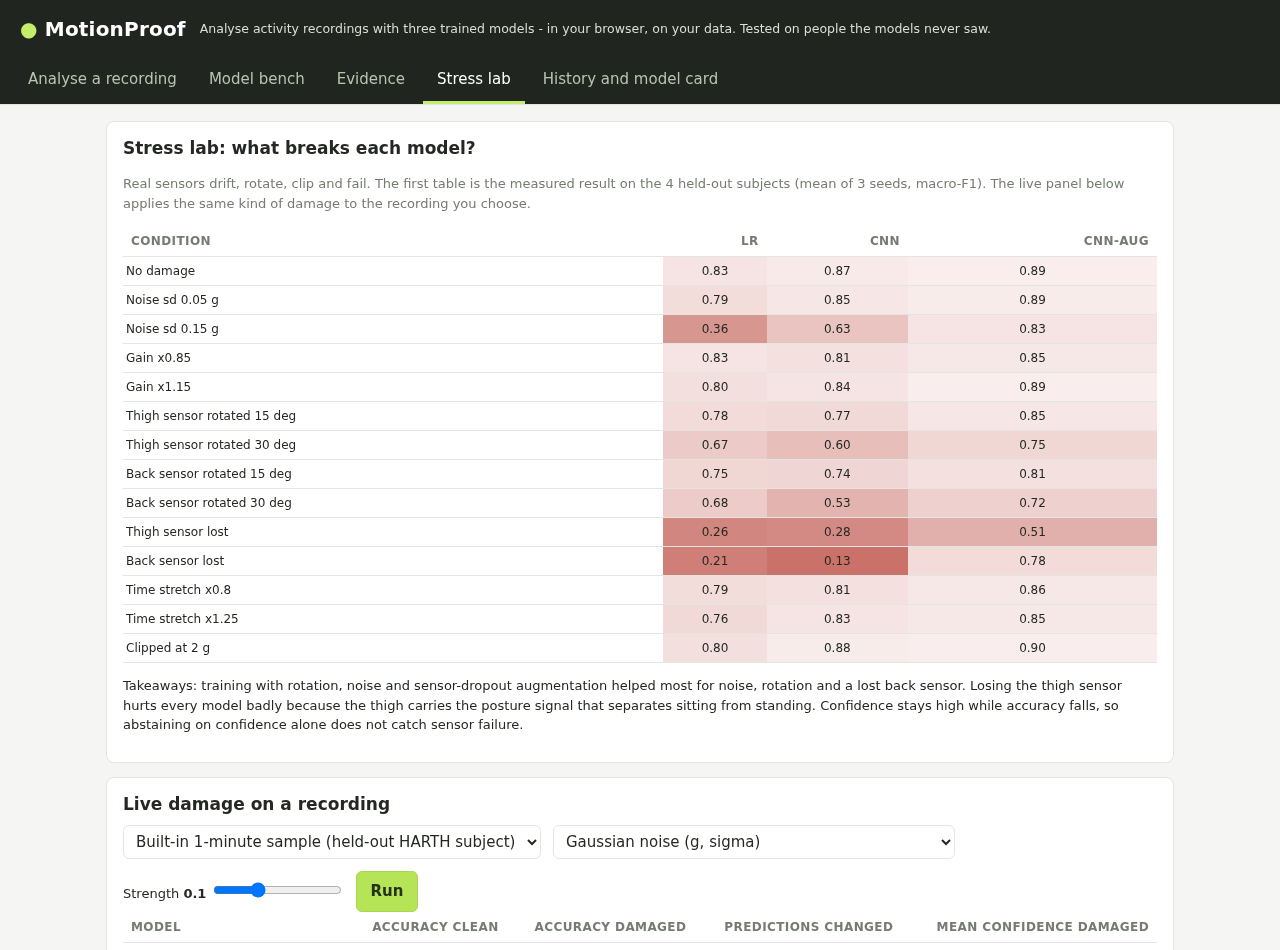
Stress lab: damage the signal and re-run all three models live, next to the measured held-out damage table (current app).
-
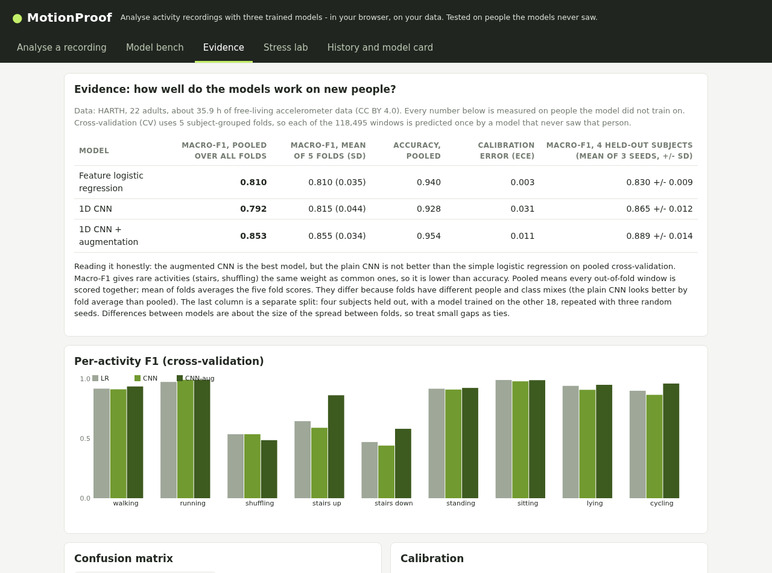
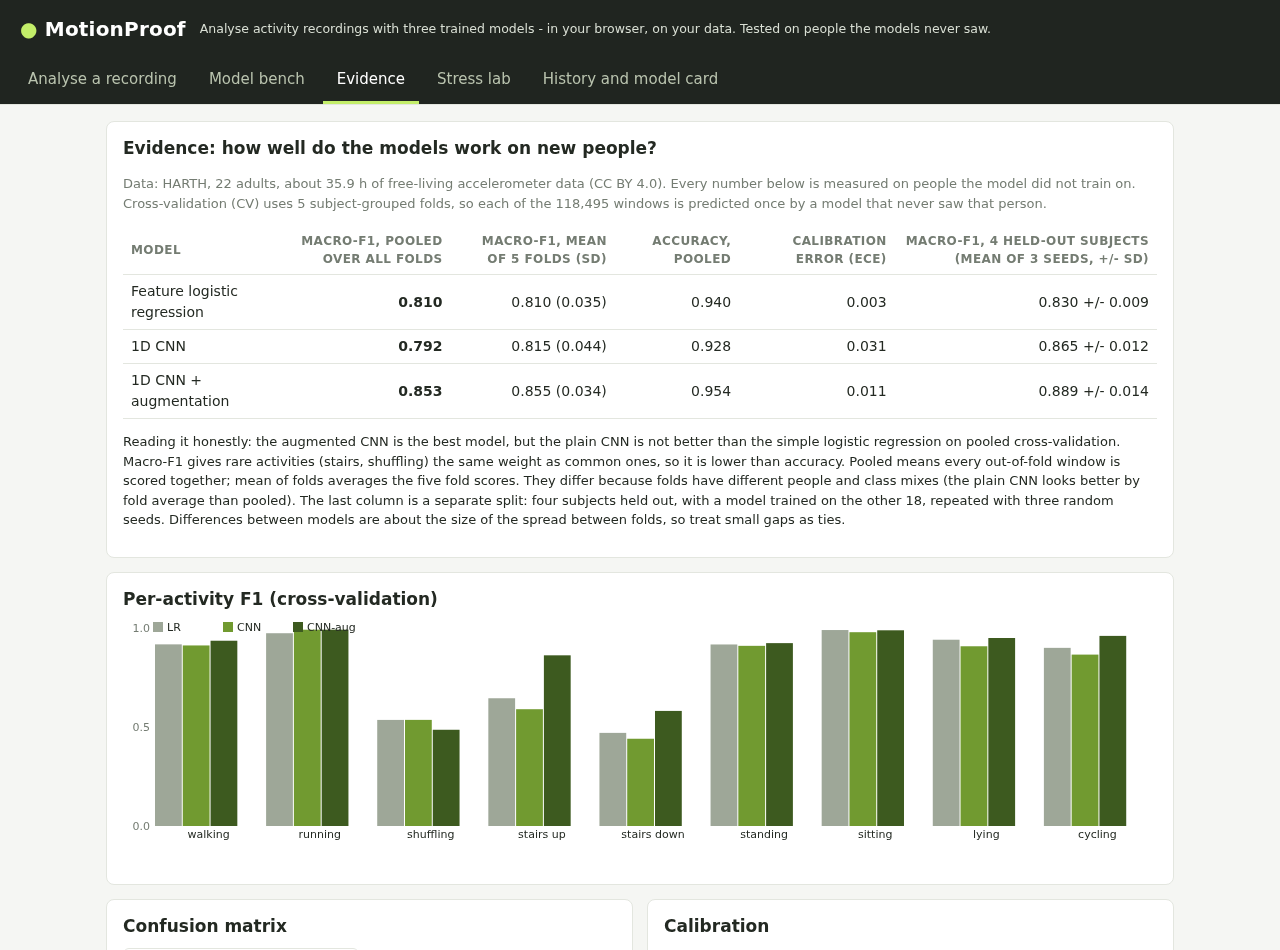
Evidence: subject-held-out metrics with an honest reading, per-activity F1 and calibration (current app).
Inspiration
Activity-recognition demos usually show one accuracy number from a random split. Windows from the same person look alike, so that number is inflated. We wanted a bench that answers the harder question: how does a model do on a person it has never seen, and how does it fail when the sensor data goes wrong?
What it does
MotionProof is an offline browser app (one HTML file, no server, no accounts, no model API) that runs three models we trained for this project on real wearable data:
- Feature logistic regression (67 hand-made features)
- A small 1D CNN (about 17k parameters)
- The same CNN trained with augmentation (rotation, gain, noise, sensor dropout)
Five tabs:
- Live bench: held-out recordings with the true activity next to all three models, an abstain slider and optional smoothing.
- Evidence: subject-held-out metrics, per-class and per-subject results, calibration. Every number is labelled by how it was measured.
- Stress lab: damage the signal (noise, rotation, speed, lost sensor) and re-run all three models live.
- Import: bring your own CSV. The app validates columns, units and sampling rate, and refuses with a reason when it cannot run.
- History and model card: saved sessions, experiment export, intended use and limits.
Data and results (measured)
Data: HARTH (UCI #779, CC BY 4.0), 22 adults, back and thigh accelerometers at 50 Hz, free living, 9 activities, 118,495 two-second windows. Every test window comes from a person the model did not train on.
| Model | Pooled 5-fold CV macro-F1 | Mean of 5 folds (sd) | Pooled CV accuracy | 4 held-out subjects, macro-F1, mean of 3 seeds |
|---|---|---|---|---|
| Feature logistic regression | 0.810 | 0.810 (0.035) | 0.940 | 0.830 |
| 1D CNN | 0.792 | 0.815 (0.044) | 0.928 | 0.865 |
| 1D CNN + augmentation | 0.853 | 0.855 (0.034) | 0.954 | 0.889 |
What we found, including the bad news:
- The plain CNN is not better than logistic regression on pooled cross-validation. Augmentation is what makes the deep model clearly better.
- Shuffling, stairs up and stairs down are the weak classes (F1 0.44 to 0.86 across models, shuffling 0.49 to 0.54).
- Losing the thigh sensor wrecks every model (macro-F1 about 0.26 LR, 0.28 CNN, 0.51 CNN+aug). Losing the back sensor drops LR and CNN to 0.21 and 0.13, while CNN+aug keeps 0.78.
- Confidence stays high when the model is wrong: about 0.94 mean confidence with the thigh sensor lost for LR and CNN, at 0.61 to 0.68 accuracy. A confidence threshold alone does not catch a broken sensor.
How we built it
Python and PyTorch (CPU) for training and evaluation; the models are exported as weights and re-implemented in plain JavaScript. 28 parity and validation tests compare the browser outputs with PyTorch, and 8 headless-browser tests exercise the UI. Inference takes about 1.2 ms per window per model in the browser. Training scripts, results files and an interview manual are in the repository.
Limitations
Healthy adults, one sensor placement and device type. Transitions between activities are not scored (mixed-label windows were dropped). The four cycling codes are merged. Stress tests are synthetic damage, not real device faults. Training is CPU only, so a re-run will not match to the last digit. Not a medical device. Do not use it for diagnosis, fall detection, gait assessment or monitoring a person.
AI disclosure
This project was built with AI assistance. An AI assistant wrote the code, ran the training and evaluation, produced the screenshots, captions and documentation, and the narration audio was generated with a text-to-speech service. The entrant (M J Anthony) directed the work and set the requirement for real trained models with honest, measured results. All figures above come from the scripts and result files in the repository. Reused material: the HARTH dataset (Logacjov et al., Sensors 21(23):7853, 2021, CC BY 4.0), PyTorch, NumPy, pandas, puppeteer-core (tests) and ffmpeg (video).
Try it
- Live app: https://mjanthony819.github.io/motionproof/
- Source: https://github.com/mjanthony819/motionproof
- Demo video (1:49, narrated and captioned; recorded for the original submission, shows its earlier interface): https://youtu.be/v7CwSl5AgKc
