-
-
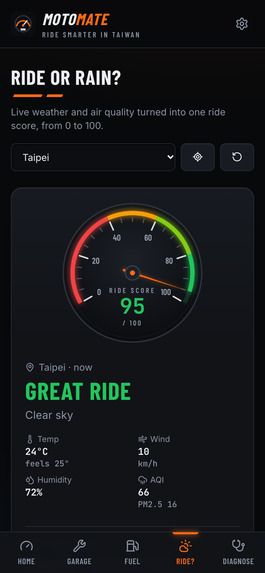
mobile
-
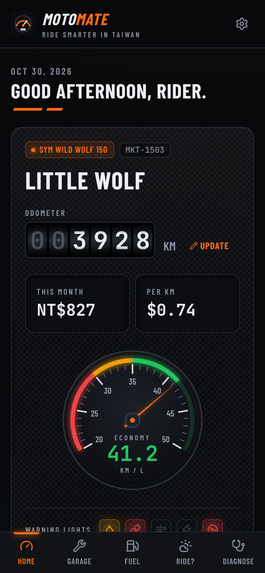
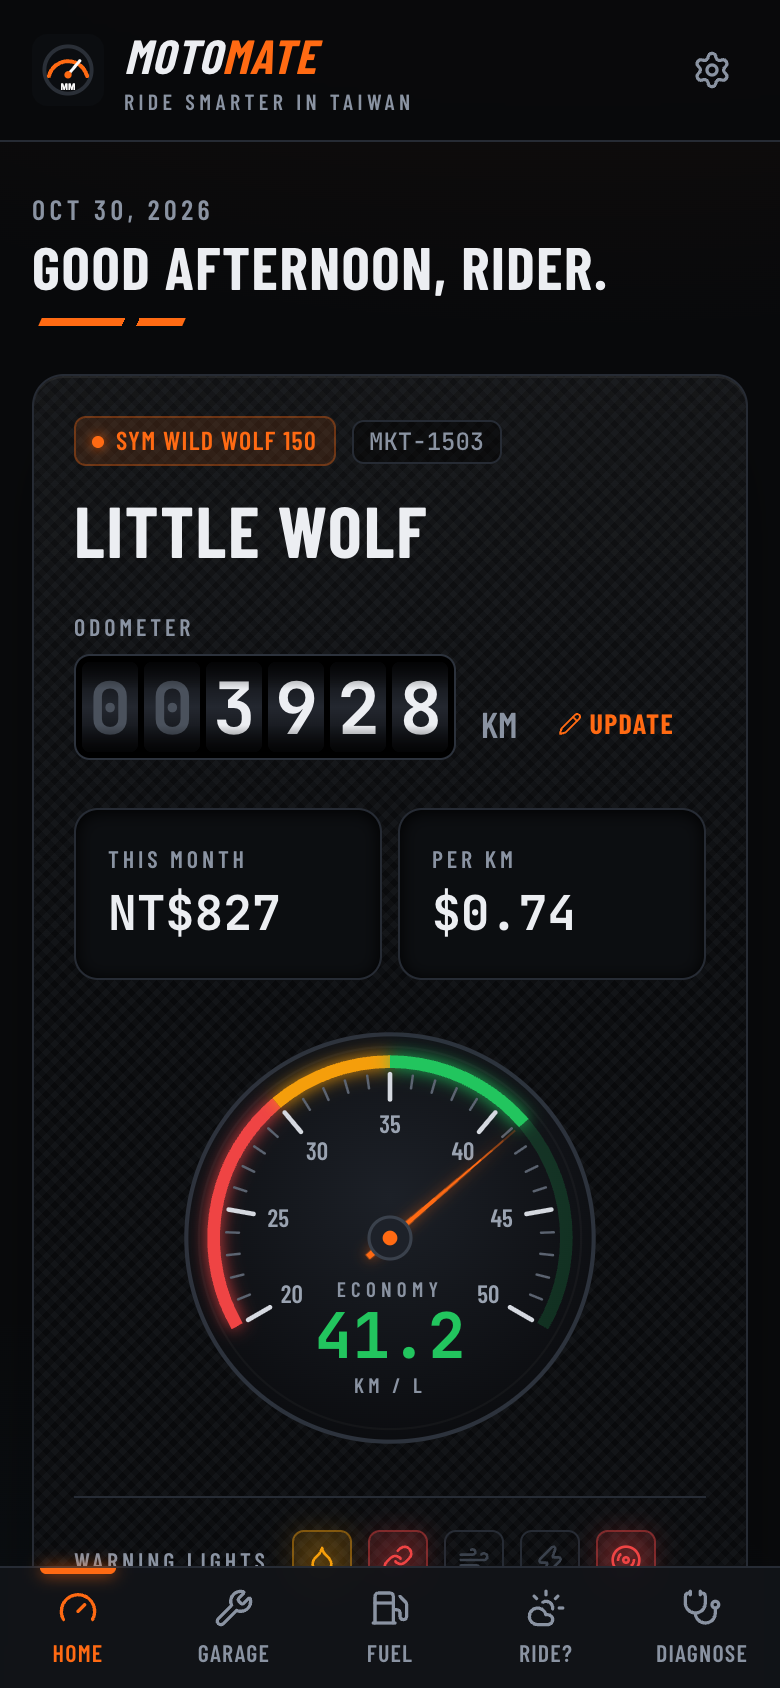
Mobile Dashboard
-
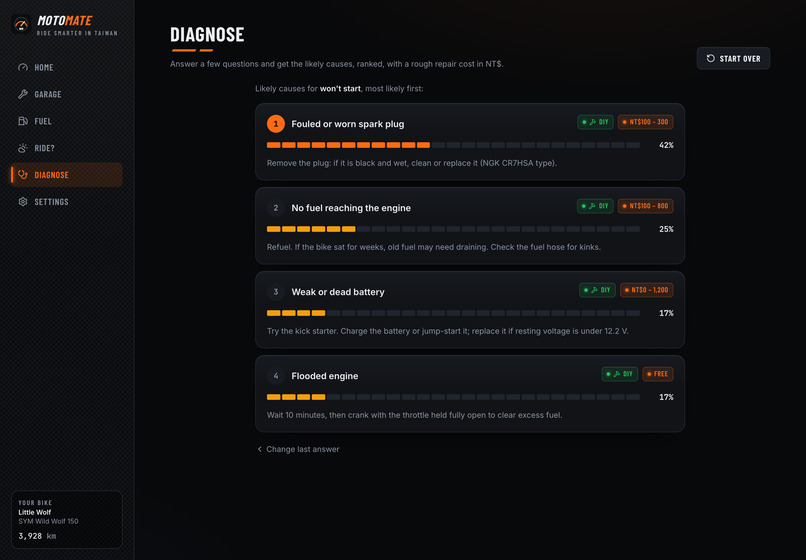
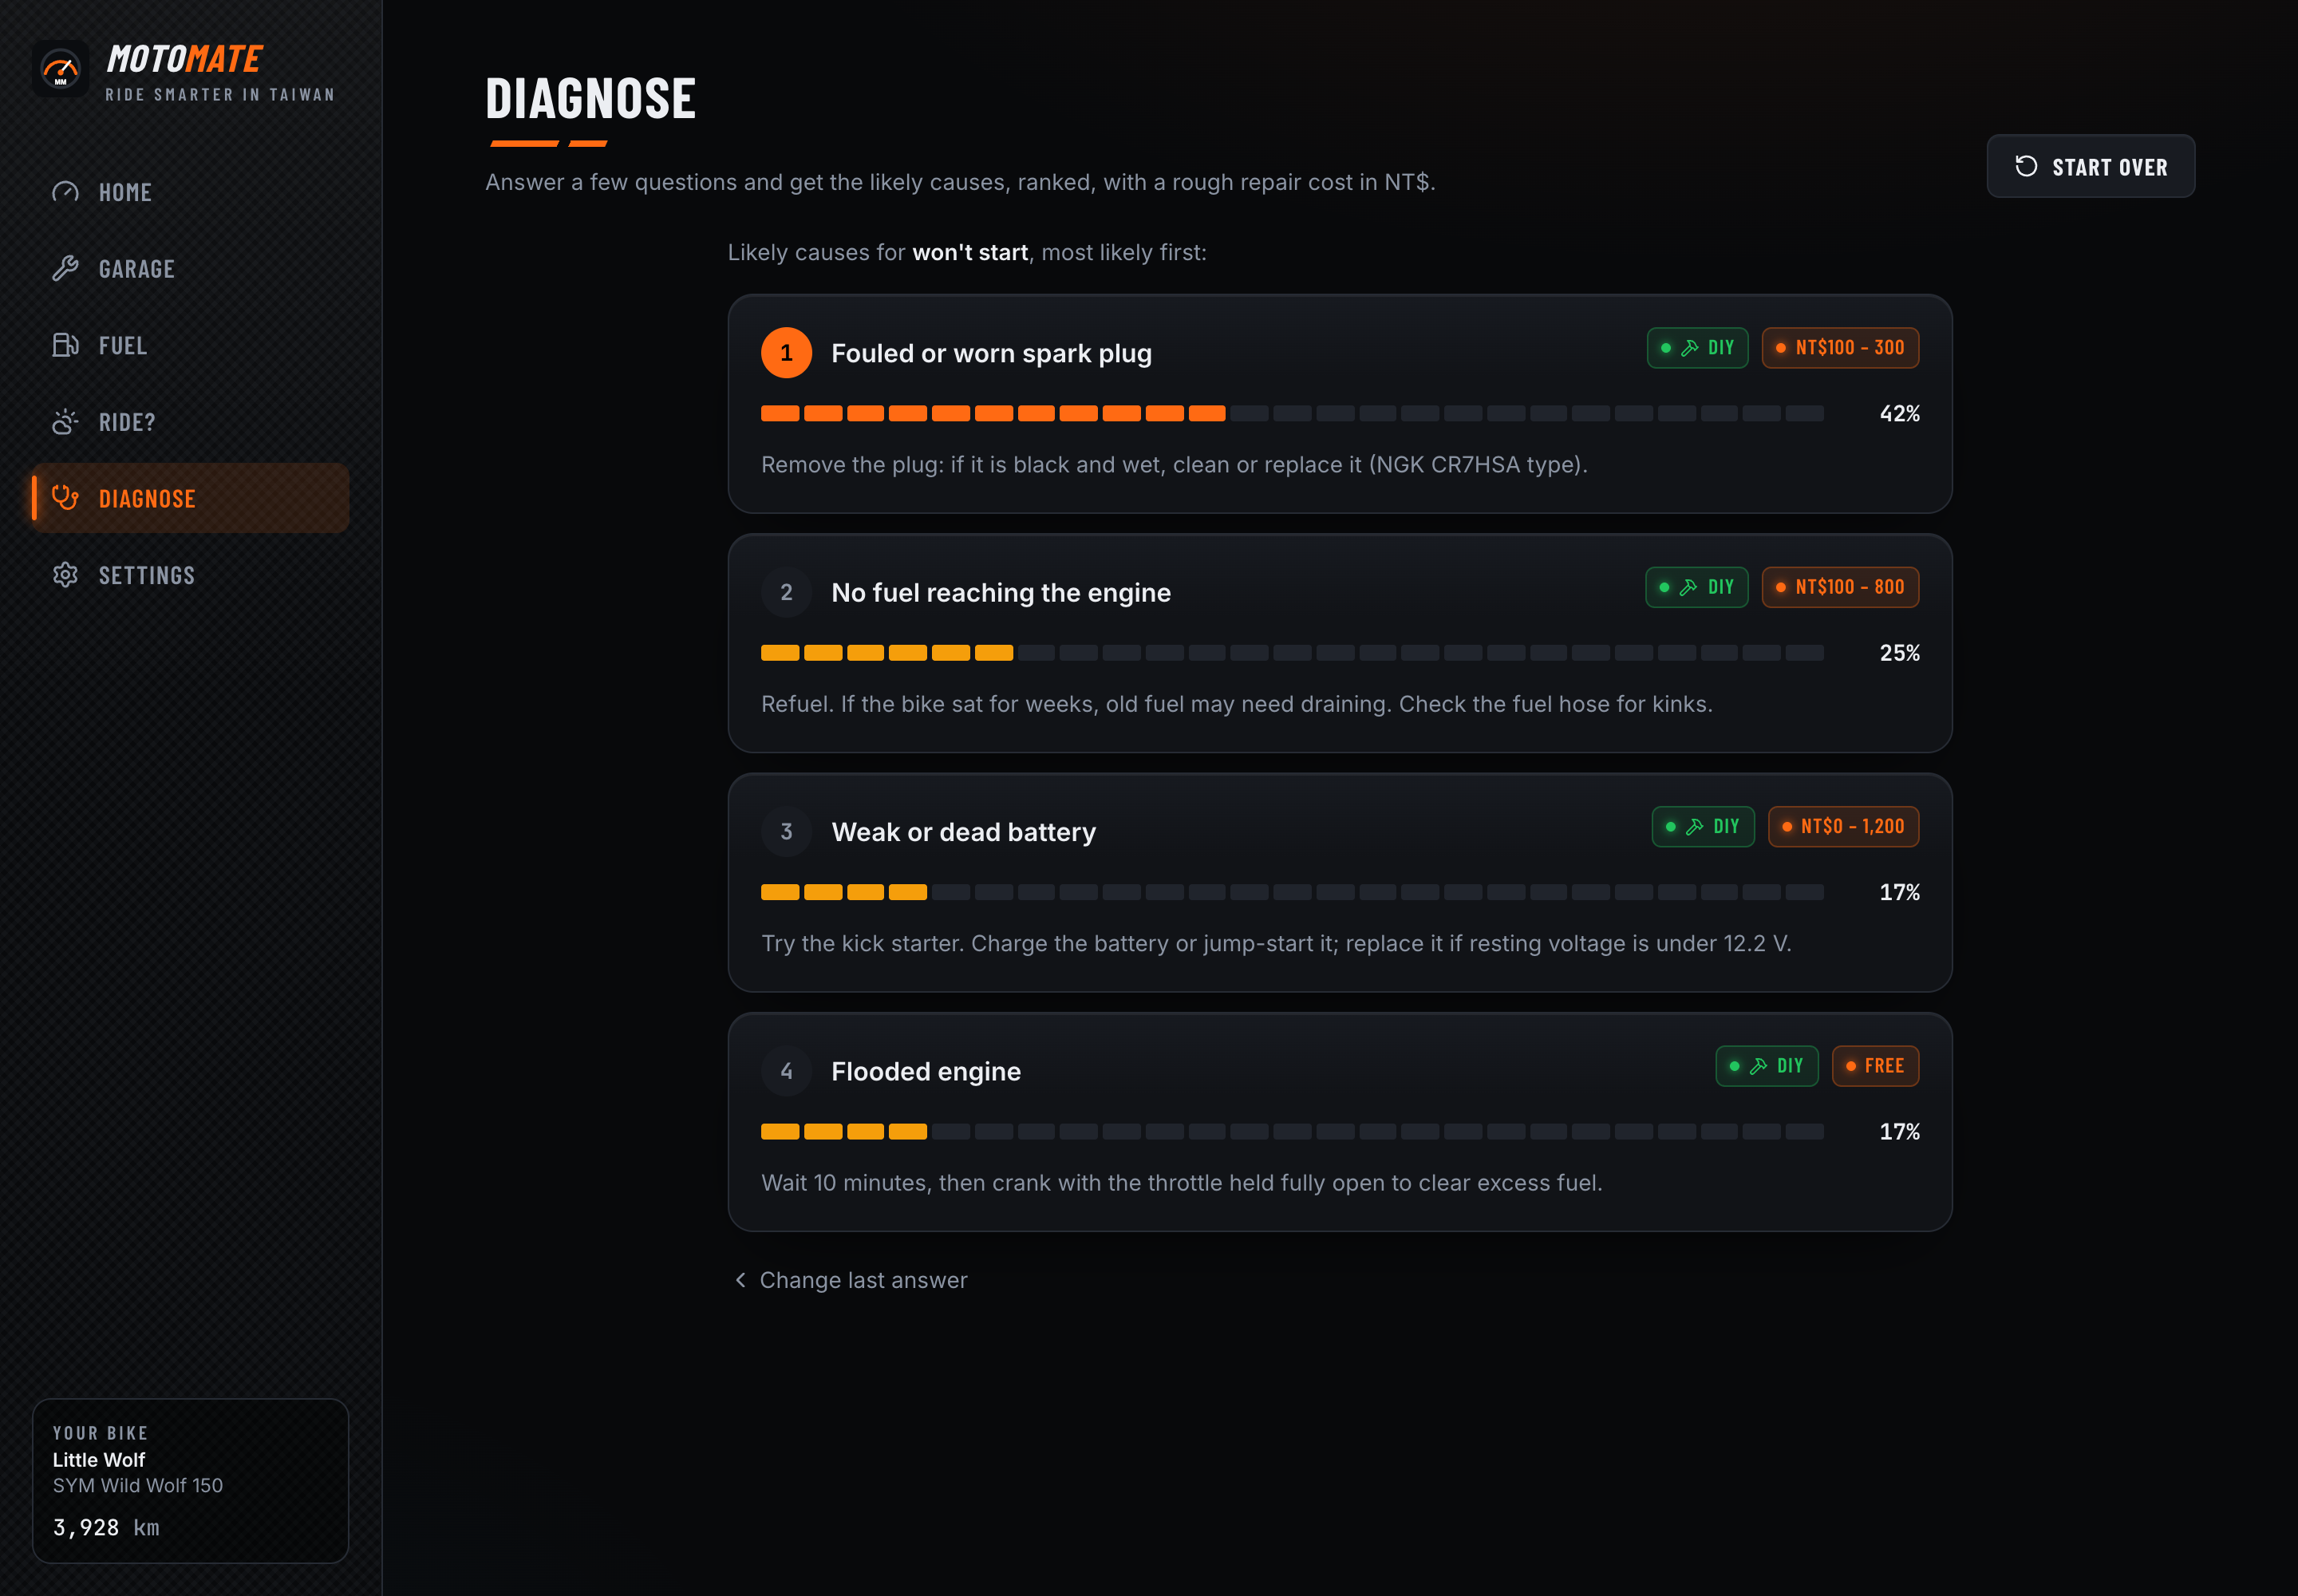
Diagnosis result
-
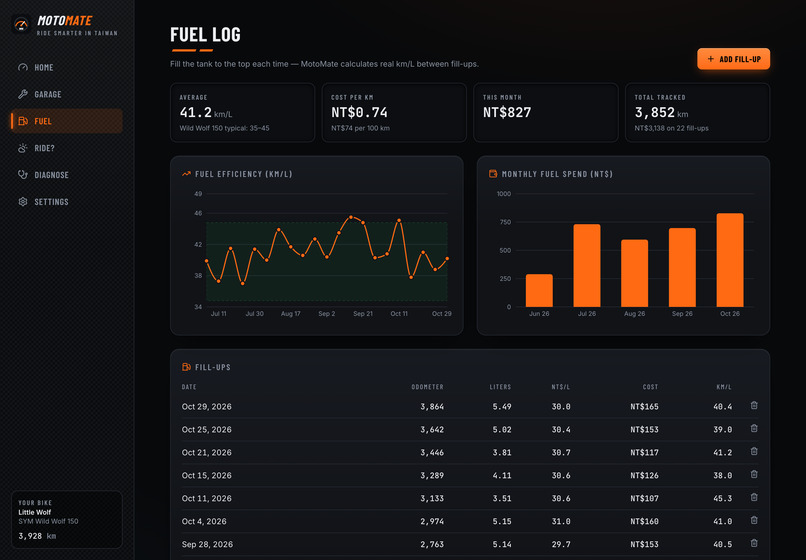
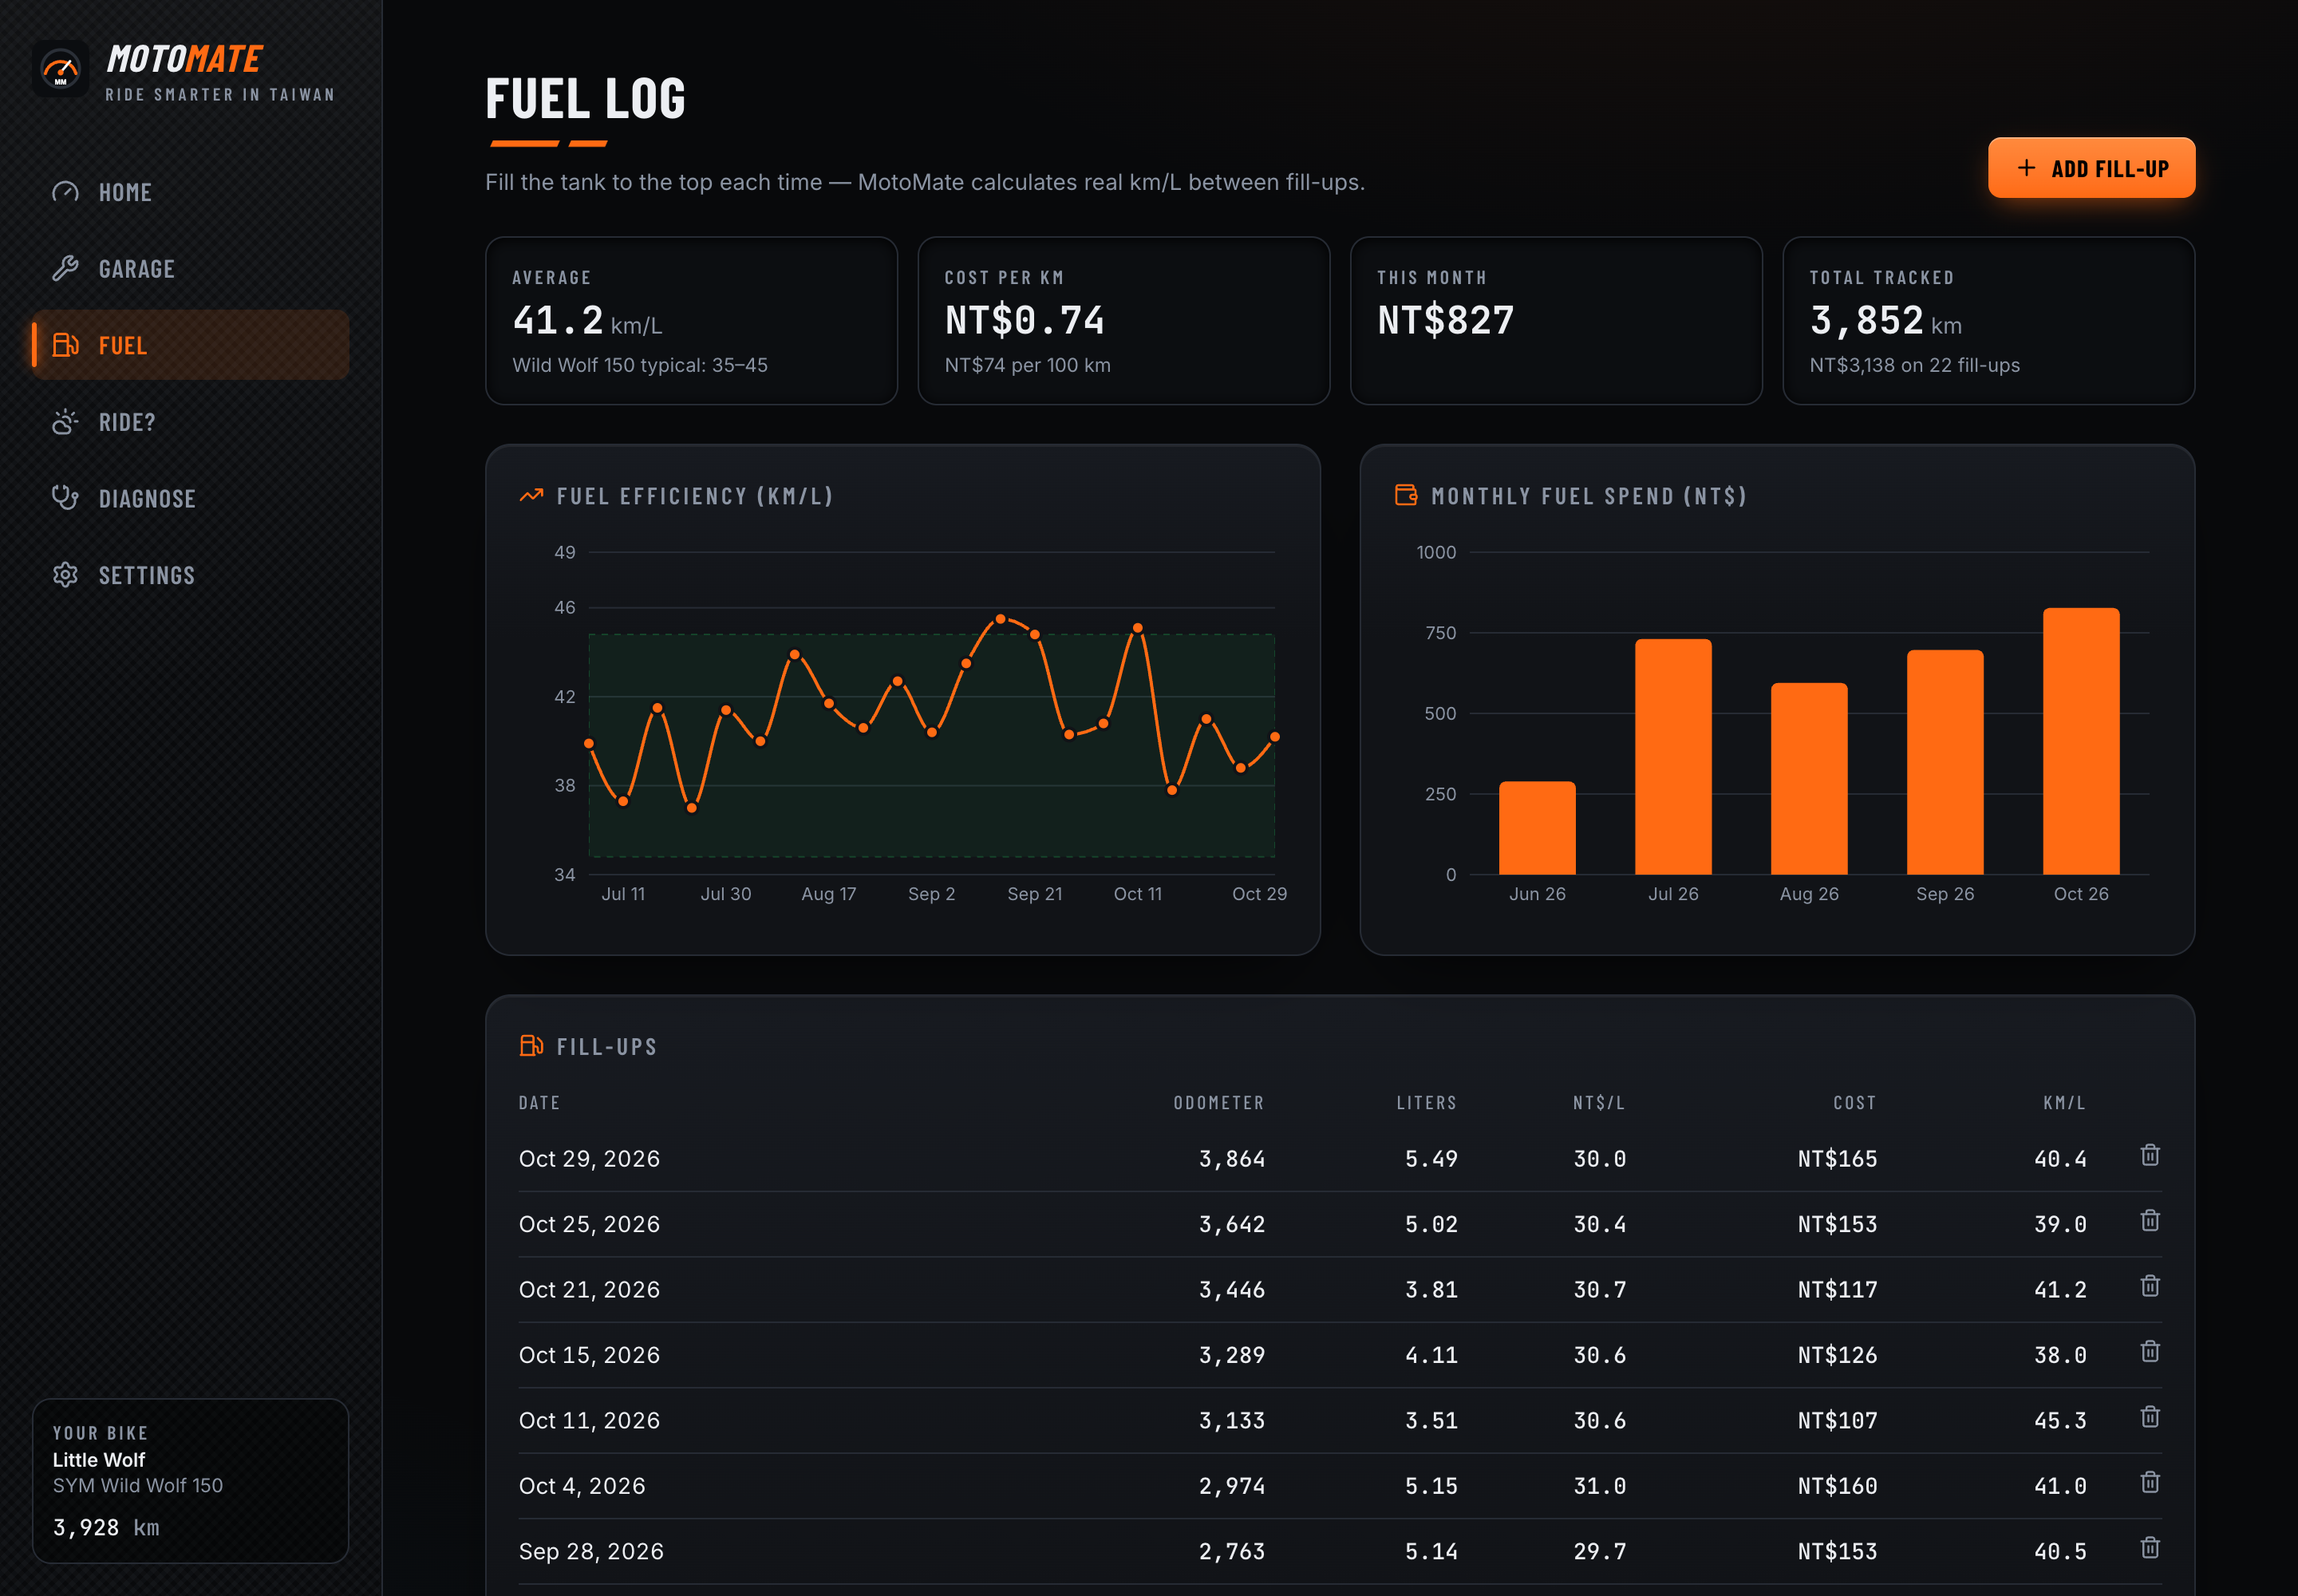
Fuel log
-
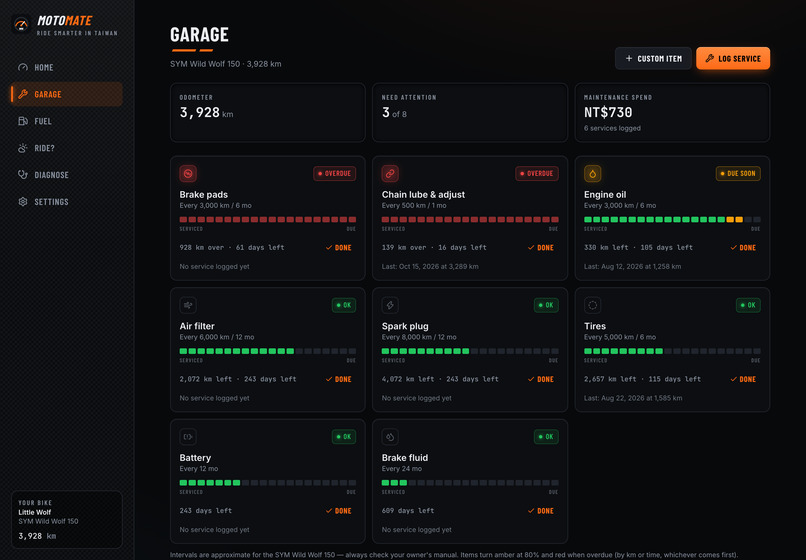
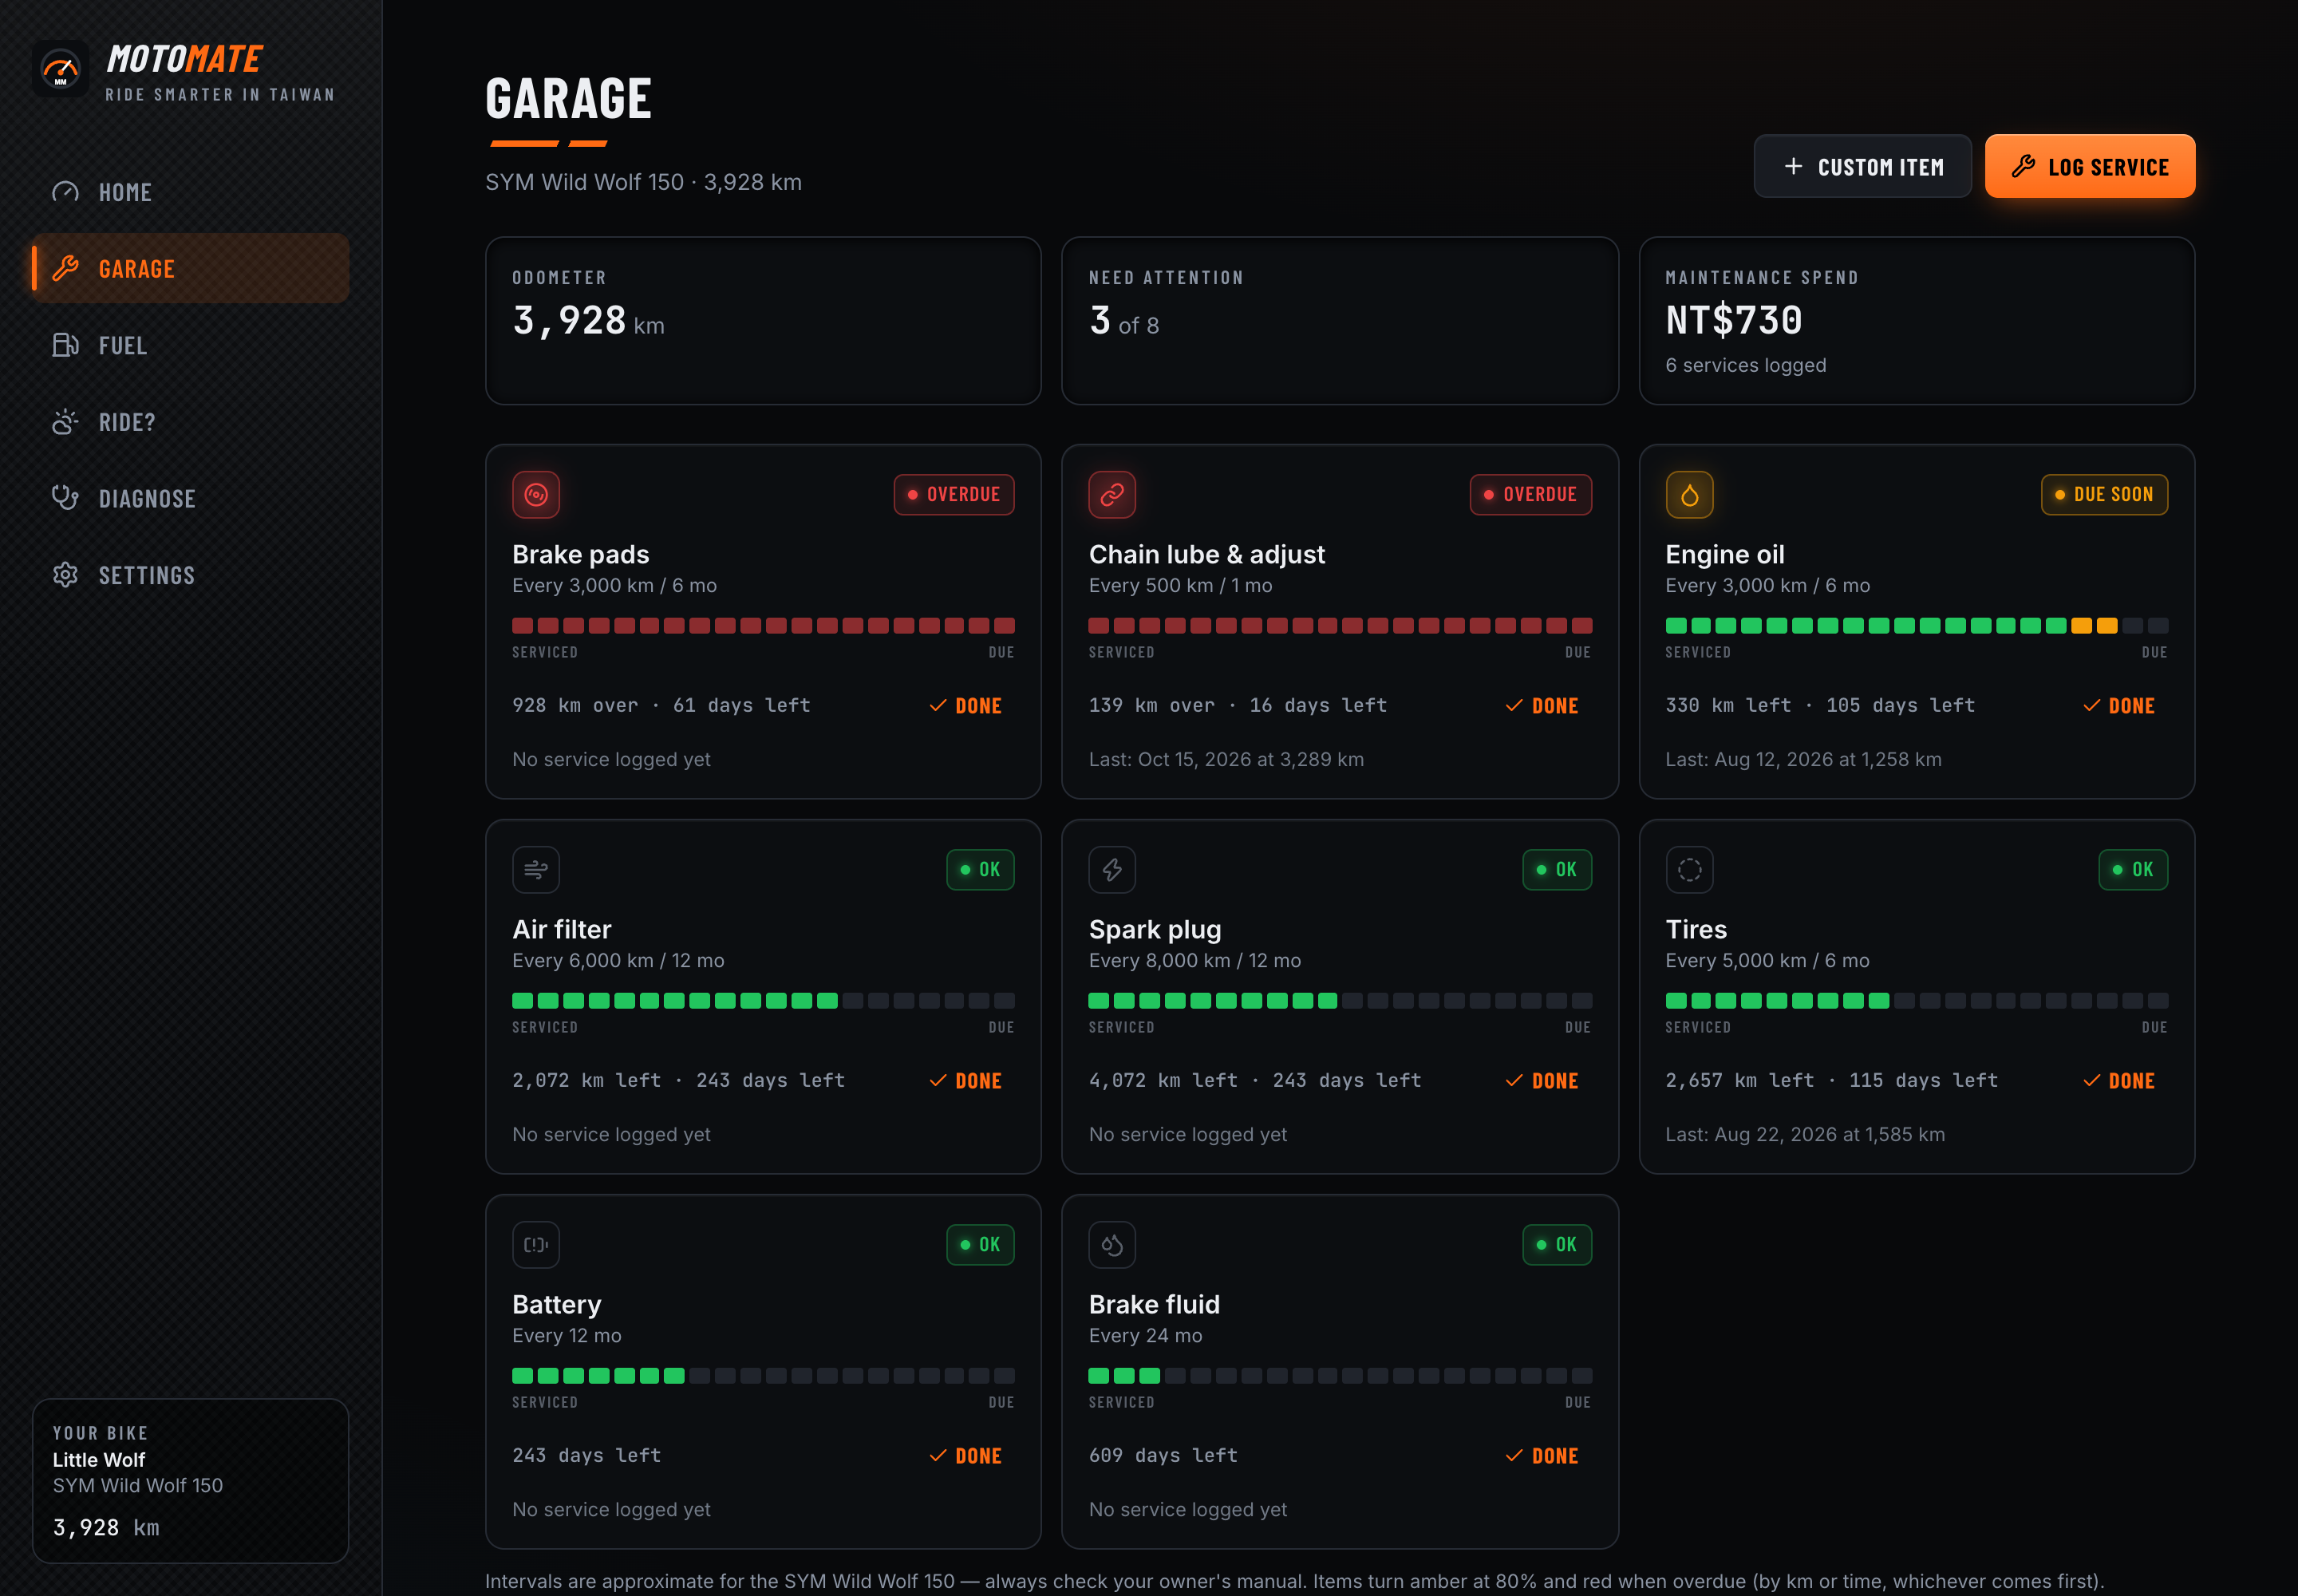
Garage
-
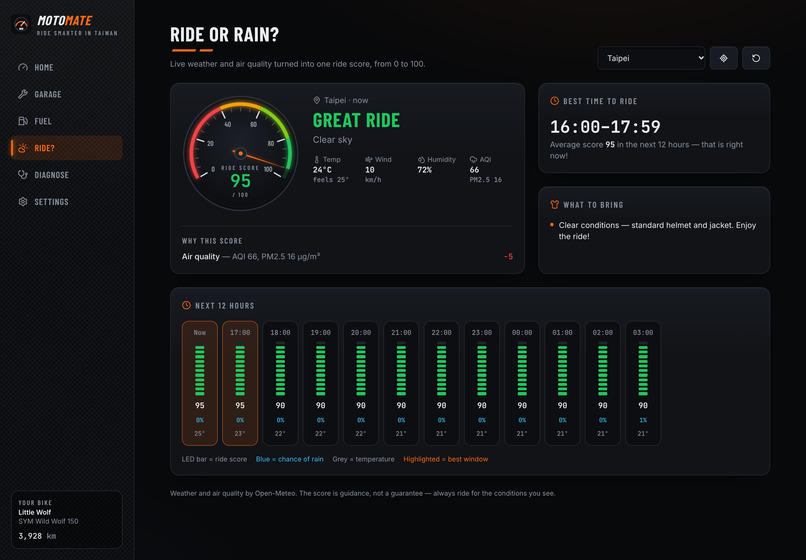
Ride
-
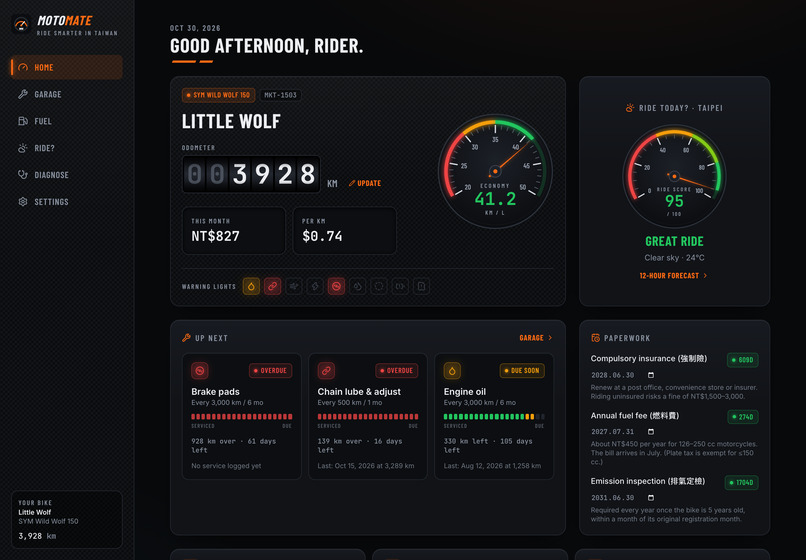
Dashboard
Inspiration
I study informatics in Taiwan and I just bought my first real motorcycle, a SYM Wild Wolf 150. Within the first week I had a pile of questions: When is the first oil change? How often should I lube the chain? Is my fuel economy normal? Is it going to rain on my way home? And what is that clicking noise?
Taiwan has over 14 million registered scooters and motorcycles, more than one for every two people. Yet the information riders need is scattered across owner's manuals, forums, weather apps and government websites. I wanted one app that answers all of those questions, and that feels like part of the bike.
What it does
MotoMate is a mobile-first web app designed like a motorcycle instrument cluster:
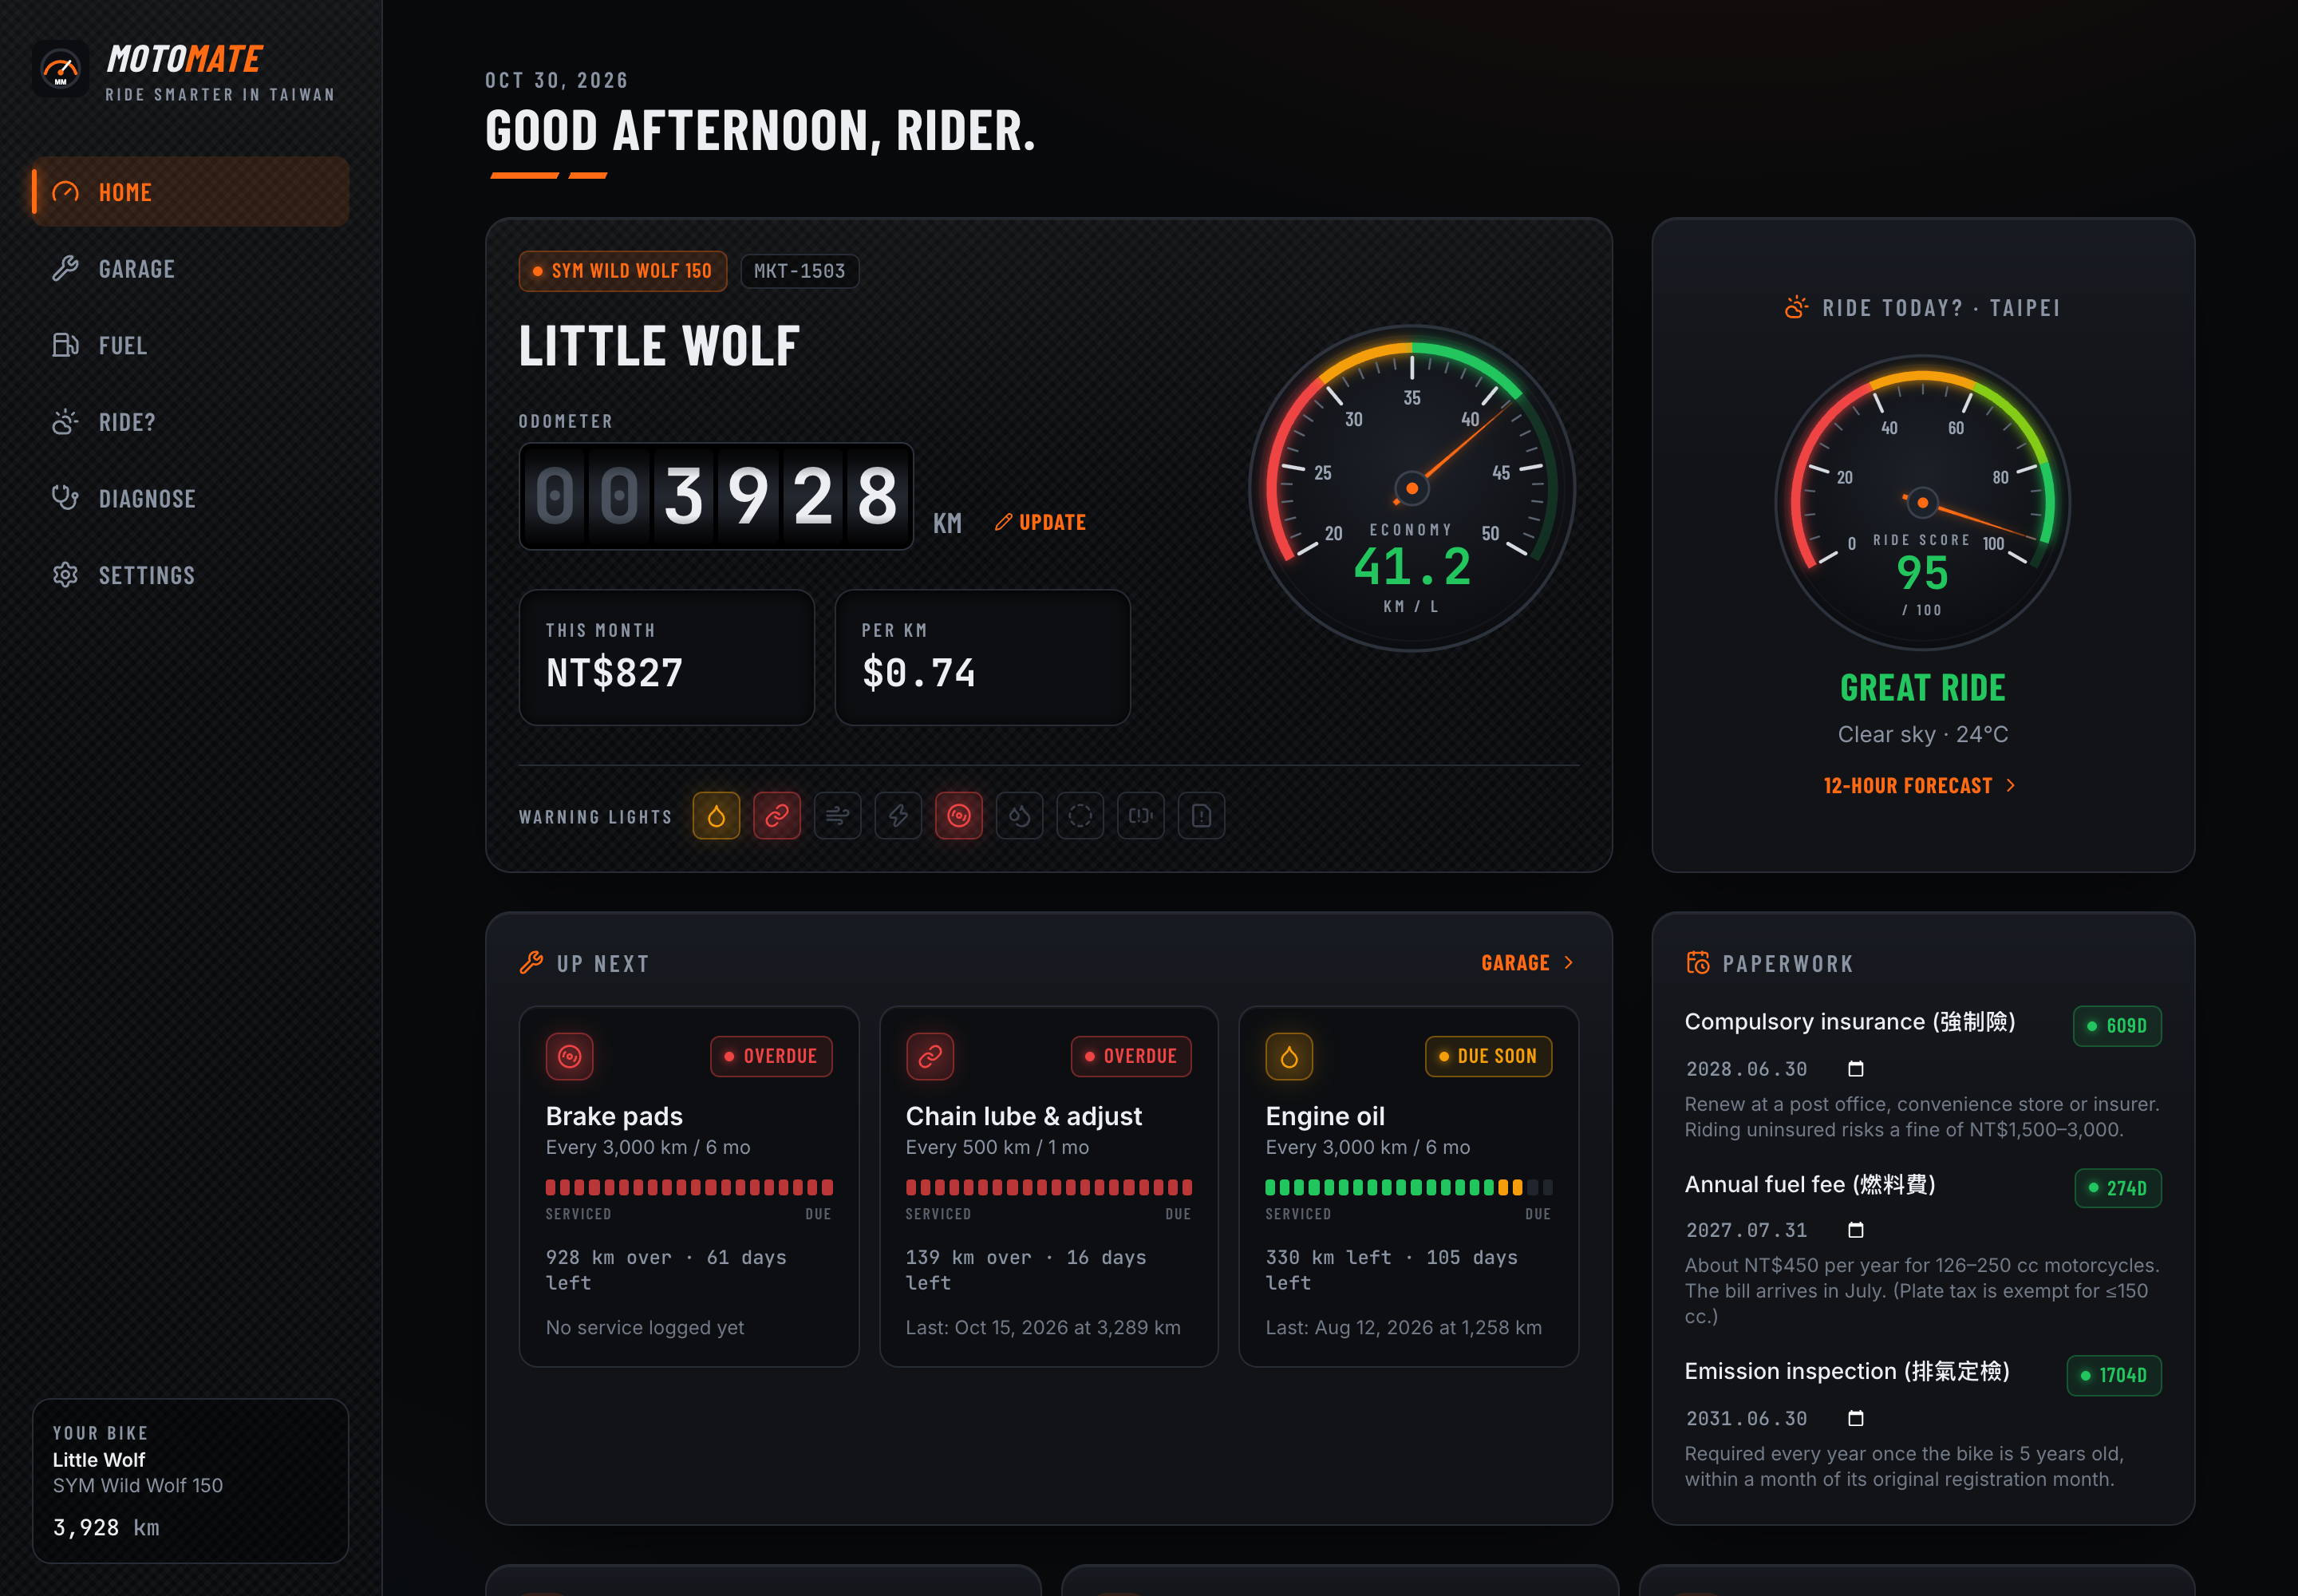
- Dashboard: a rolling odometer, a fuel-economy dial, today's ride score and warning lights that glow when oil, chain or brakes need attention. It also shows countdowns for Taiwan paperwork (強制險 compulsory insurance, 燃料費 fuel fee, 排氣定檢 emission inspection).
- Garage: a preset service schedule for the Wild Wolf 150. Each item is tracked by kilometers and time, with an LED wear bar that goes green → amber → red.
- Fuel log: real km/L, cost per km and monthly spending, with charts.
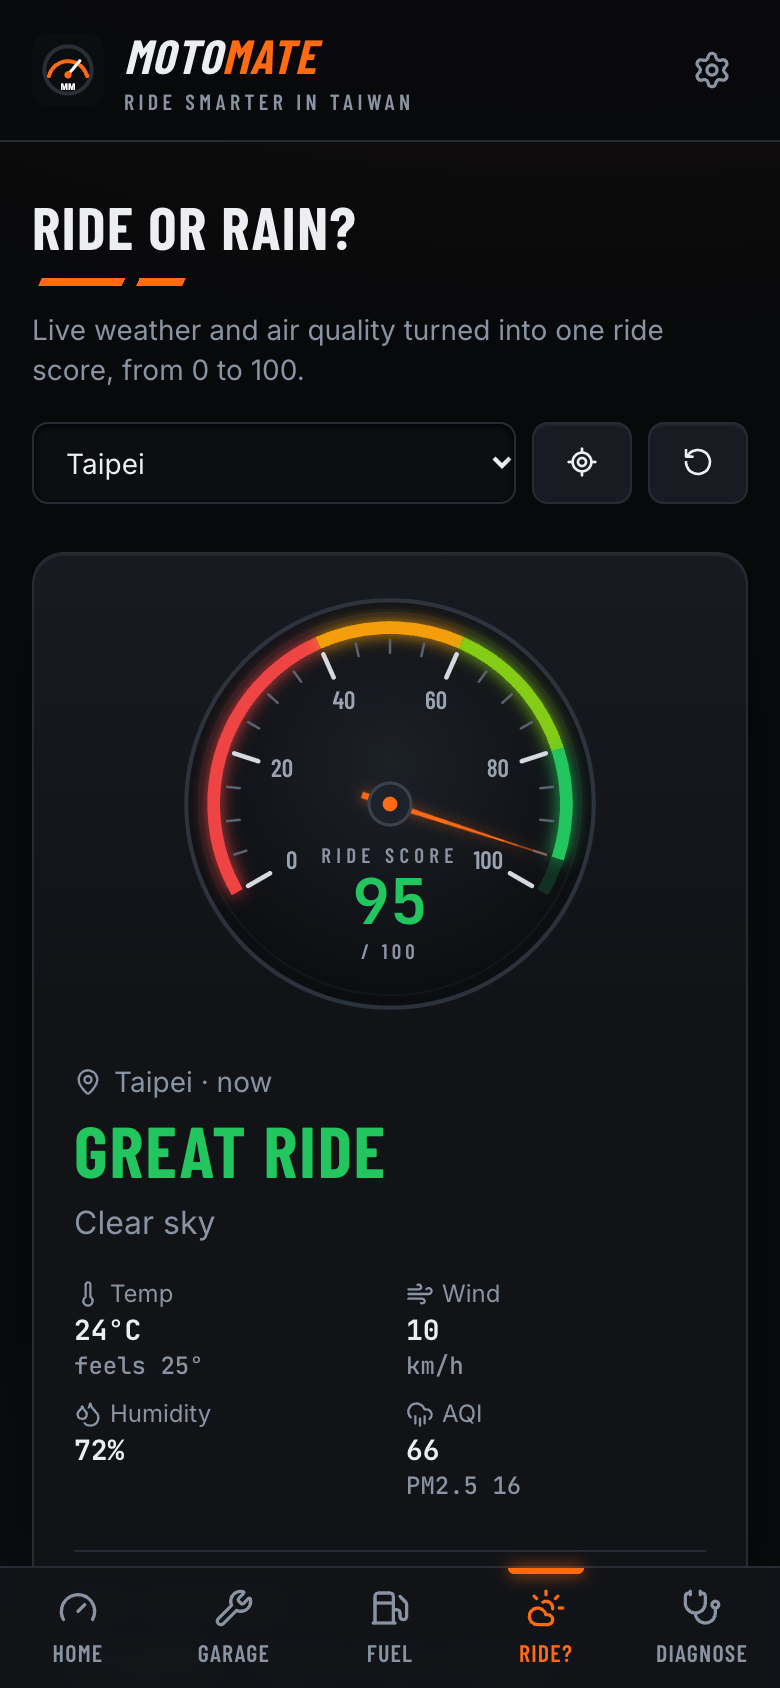
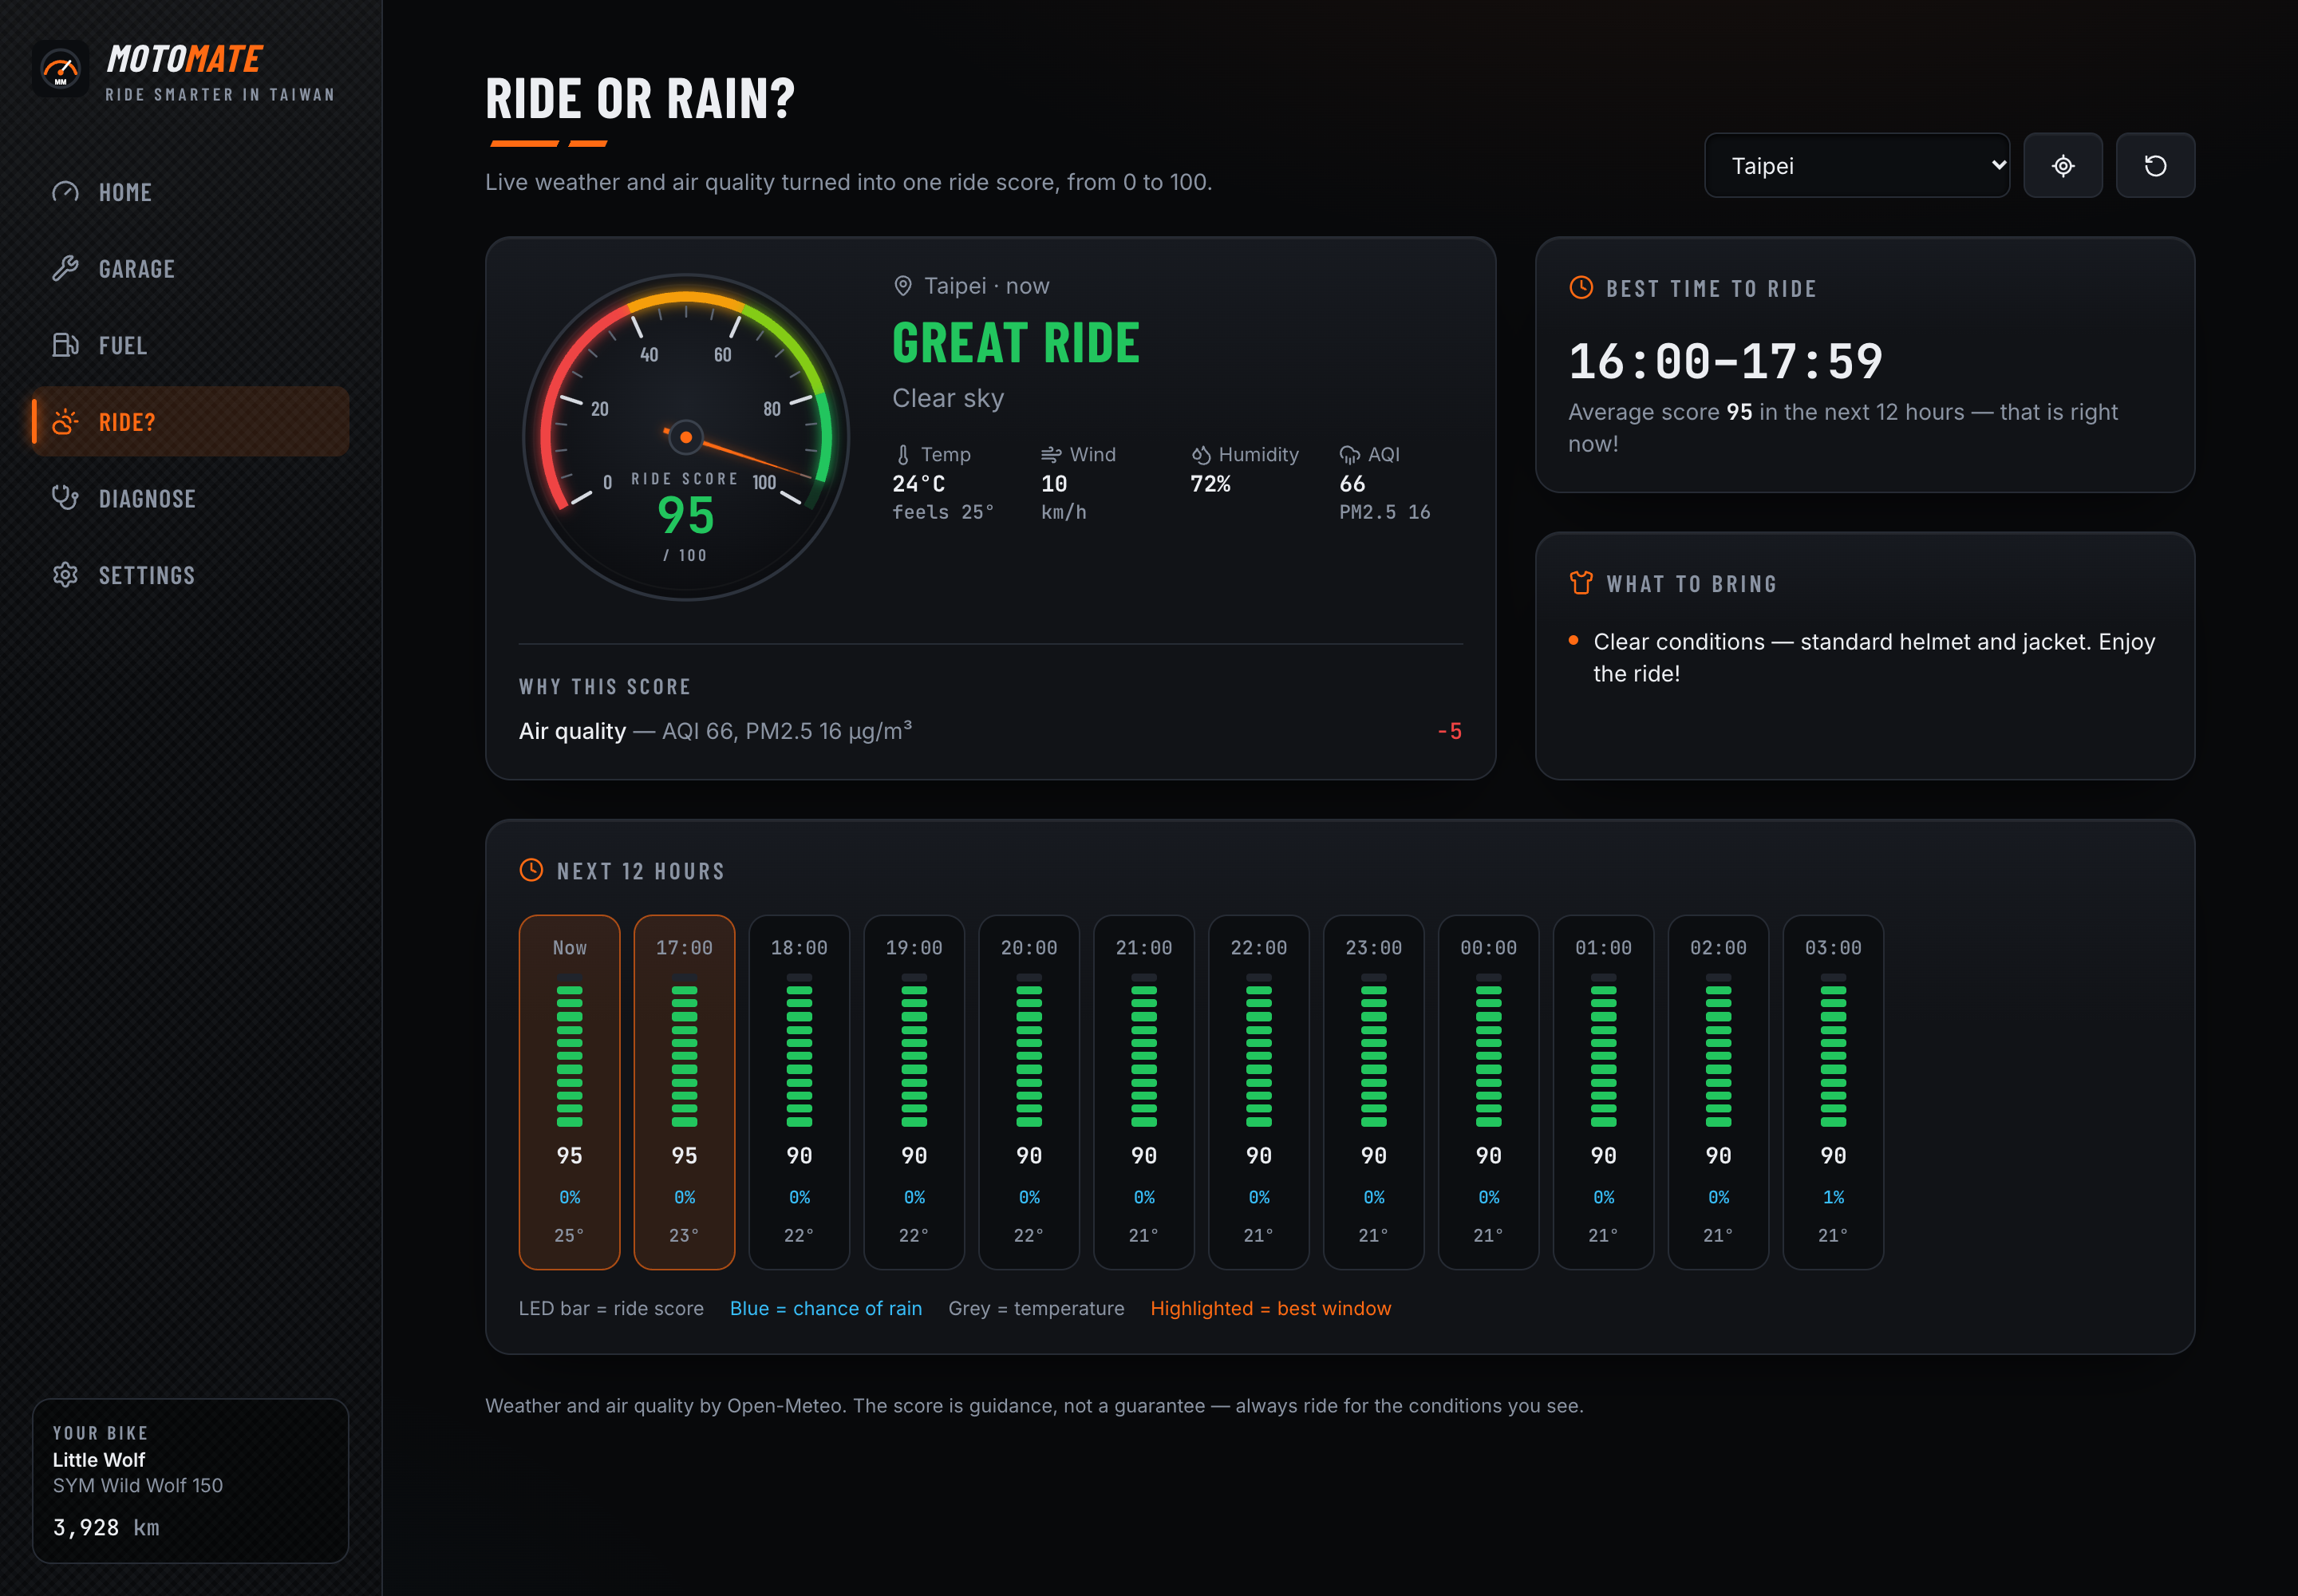
- Ride or Rain?: live weather and air quality turned into a 0–100 ride score that explains itself, plus the best 2-hour window to ride and what gear to bring.
- Diagnose: a rule-based expert system for 8 common problems. It gives ranked causes, DIY vs. shop advice, a rough repair cost in NT$ and safety warnings.
There's no account and no server, and all data stays private in the browser.
How I built it
- React + TypeScript + Vite, styled with Tailwind CSS. Recharts draws the fuel charts and Vitest unit-tests all the core logic. It's deployed on Vercel.
- Open-Meteo forecast and air-quality APIs give live hourly data. They're free and need no API key, so the demo never breaks.
- The gauges are hand-built SVG components: analog dials with colored zones and a needle that does an "ignition self-test" sweep on load, LED segment bars, and a mechanical drum odometer.
Ride score. It's a transparent penalty model. Every hour starts at 100 and loses points for each risk factor:
$$ \text{score} = \operatorname{clamp}\Big(100 - \sum_i p_i,\; 0,\; 100\Big) $$
Each penalty is capped so no single factor dominates. For example, rain chance $r$ (in %) costs $\min(0.4\,r,\ 40)$ points, gusts $g$ above 30 km/h cost $\min(0.8\,(g-30),\ 30)$, and AQI above 50 costs $\min(0.3\,(\text{AQI}-50),\ 25)$. A thunderstorm is a flat $-40$. The app lists every penalty under "Why this score", so the number is never a black box.
Fuel economy. It uses the full-tank method. Between two consecutive fill-ups $i-1$ and $i$:
$$ \text{km/L}i = \frac{d_i - d{i-1}}{L_i}, \qquad \text{cost/km} = \frac{\sum_i L_i \cdot P_i}{\sum_i (d_i - d_{i-1})} $$
Here $d$ is the odometer reading, $L$ the liters filled and $P$ the price per liter.
Diagnosis. Each possible cause $c$ starts with a base weight. Every answer adds to or subtracts from it, floored at zero, and the weights are normalized into confidence percentages:
$$ \text{confidence}(c) = \frac{w_c}{\sum_k w_k} \times 100\% $$
Maintenance. Each item tracks both distance and time, and whichever runs out first wins:
$$ \text{progress} = \max\left(\frac{\Delta \text{km}}{\text{interval}{\text{km}}},\ \frac{\Delta \text{days}}{\text{interval}{\text{days}}}\right) $$
An item turns amber at $0.8$ and red at $1.0$.
I used AI coding tools (Claude Code) to move fast, while I focused on the idea, the rider experience, the Taiwan-specific details and tuning the models.
Challenges I ran into
- Making the ride score feel right. Early versions were either too harsh (every cloudy hour said "Better not") or too forgiving. I tuned the weights so a typical humid Taipei afternoon scores "Good" while a thunderstorm always drops below 40.
- Distance and time intervals. A bike that sits in the rain still needs its chain lubed with zero kilometers ridden, so every item had to track both limits.
- Fuel math edge cases. The first fill-up has no distance before it, so efficiency can only be calculated between consecutive full-tank fill-ups.
- Making a web app feel like a real instrument cluster. Drawing the dial geometry (a 240° sweep, tick marks, zone arcs) in raw SVG, animating the needle smoothly, and keeping it readable on a 390 px phone screen took several iterations.
- Mobile layout. The 12-hour forecast strip pushed the whole page sideways on phones. Fixing CSS grid overflow taught me a lot about
minmax(0, 1fr).
What I learned
- How to turn messy real-world data (weather, air quality) into one simple, explainable number.
- That a well-designed rule-based system can be more reliable and transparent than a black-box AI for a narrow problem like diagnosis.
- SVG geometry and animation, React state with context + localStorage, data visualization, and deploying with Vercel.
- A lot about my own motorcycle!
What's next
- A Traditional Chinese (繁體中文) version for local riders
- AI photo diagnosis: snap a worn chain or tire and get advice
- GPS ride tracking to update the odometer automatically
- Multiple bikes and cloud sync, plus push notifications for service and paperwork
- Presets for more popular Taiwan bikes (Kymco, Yamaha, Gogoro…)
Built With
- claude
- open-meteo
- react
- recharts
- tailwind
- typescript
- vercel
- vite
- vitest

Log in or sign up for Devpost to join the conversation.