Mosaic - VALORANT Team Intelligence & Strategic Analysis
Inspiration
Professional VALORANT coaches face a critical problem: opponent preparation is time-intensive and unstructured. Before a match, coaches manually review VODs, track site preferences in spreadsheets, note agent compositions on whiteboards, and try to identify exploitable patterns across dozens of matches. This process takes 10+ hours per opponent and still misses subtle tendencies buried in the data.
We were inspired to build Mosaic - a platform that transforms raw match data into actionable counter-strategies. The name reflects our approach: like assembling a mosaic, we piece together thousands of individual rounds to reveal the complete picture of a team's strategic identity.
The key insight: teams develop predictable patterns (favorite site attacks, economy decisions, agent preferences) that can be detected algorithmically and exploited tactically. Mosaic makes this analysis instant instead of manual.
What it does
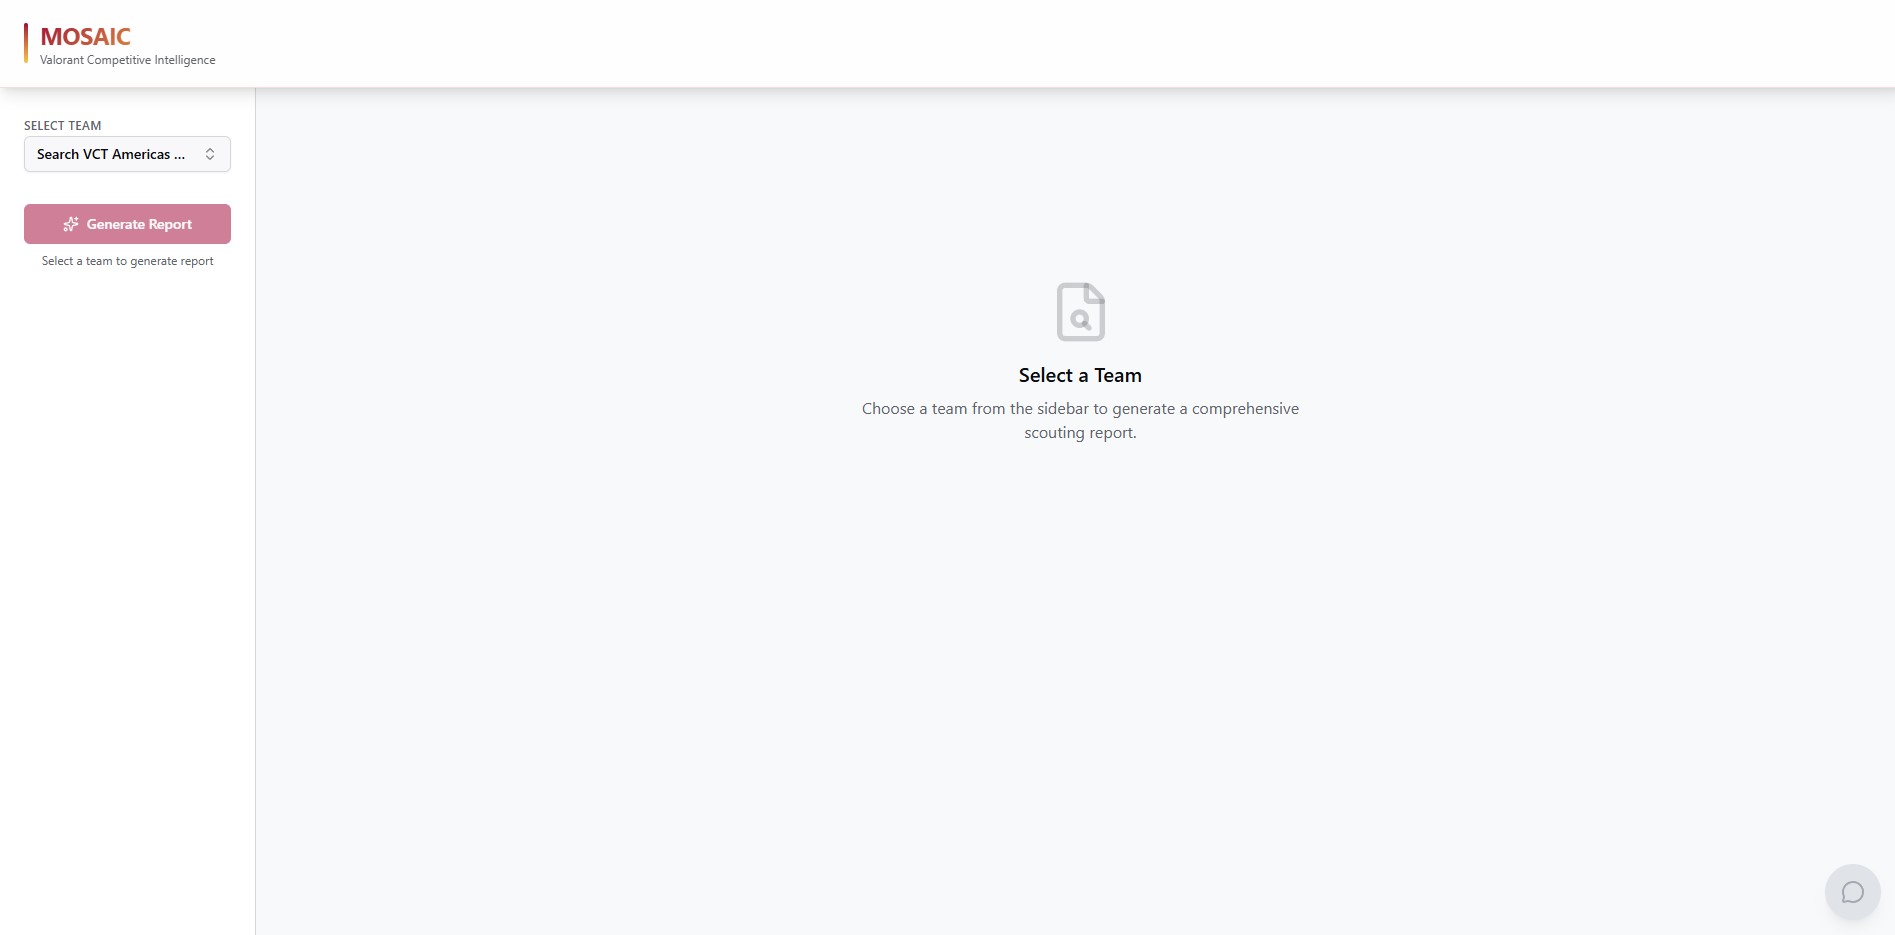
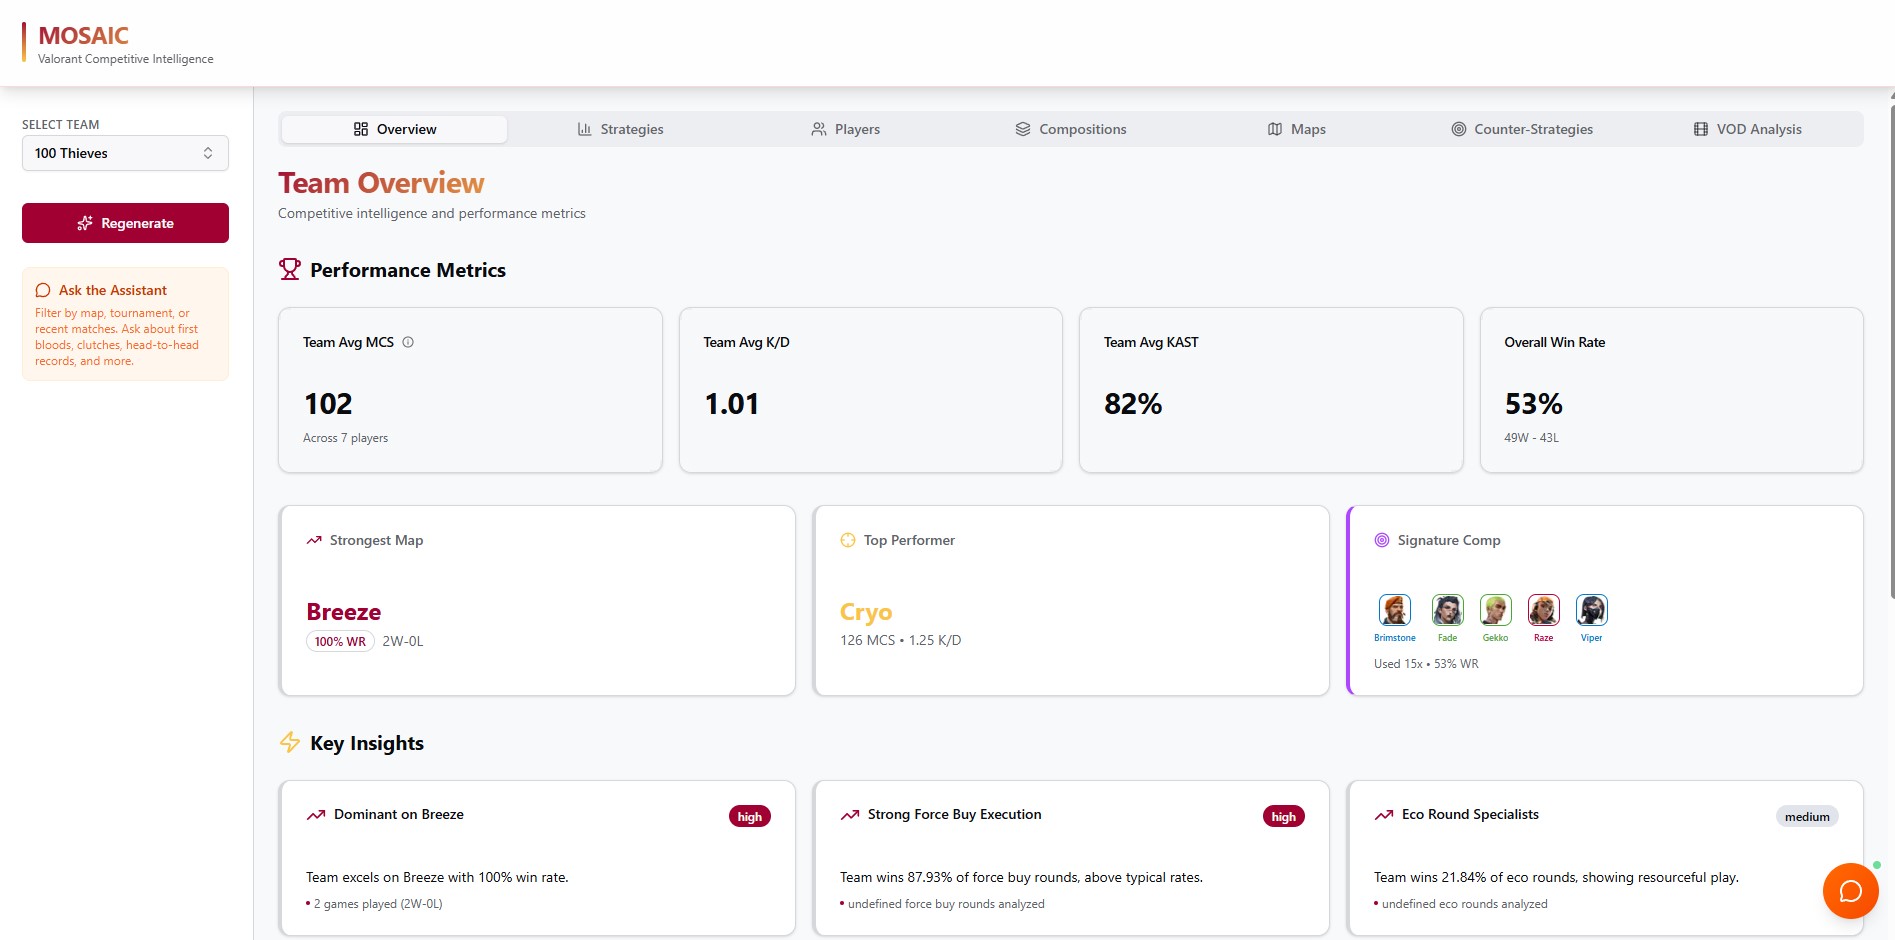
Mosaic is a specialized VALORANT analytics platform for deep strategic analysis of professional teams. It answers the critical question every coach asks before a match: "How do we beat this opponent?"
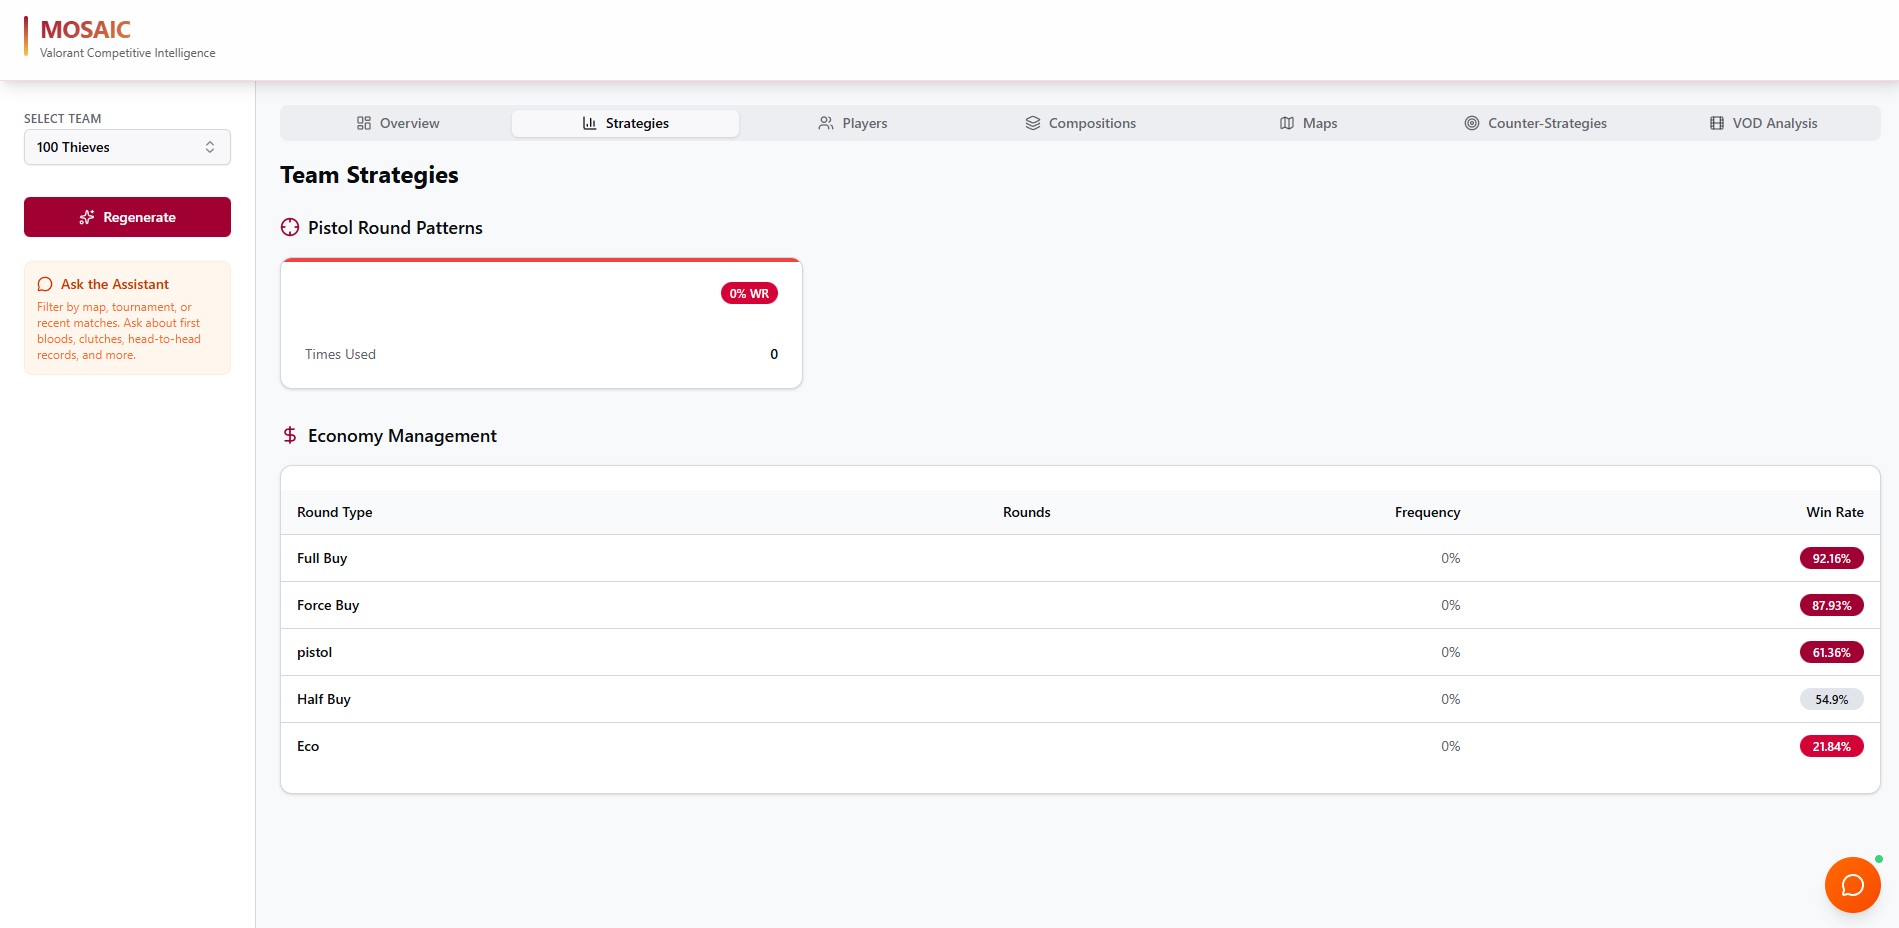
Team Strategy Patterns:
- Attack/Defense Tendencies: Which sites does this team attack most on Bind? Do they prefer A-site 60% of rounds or split evenly?
- Economy Decisions: How often do they force-buy after losing pistol? What's their eco conversion rate?
- Site Preferences Per Map: On Haven, they attack C-site 45% of the time with 65% win rate - stack defenders there
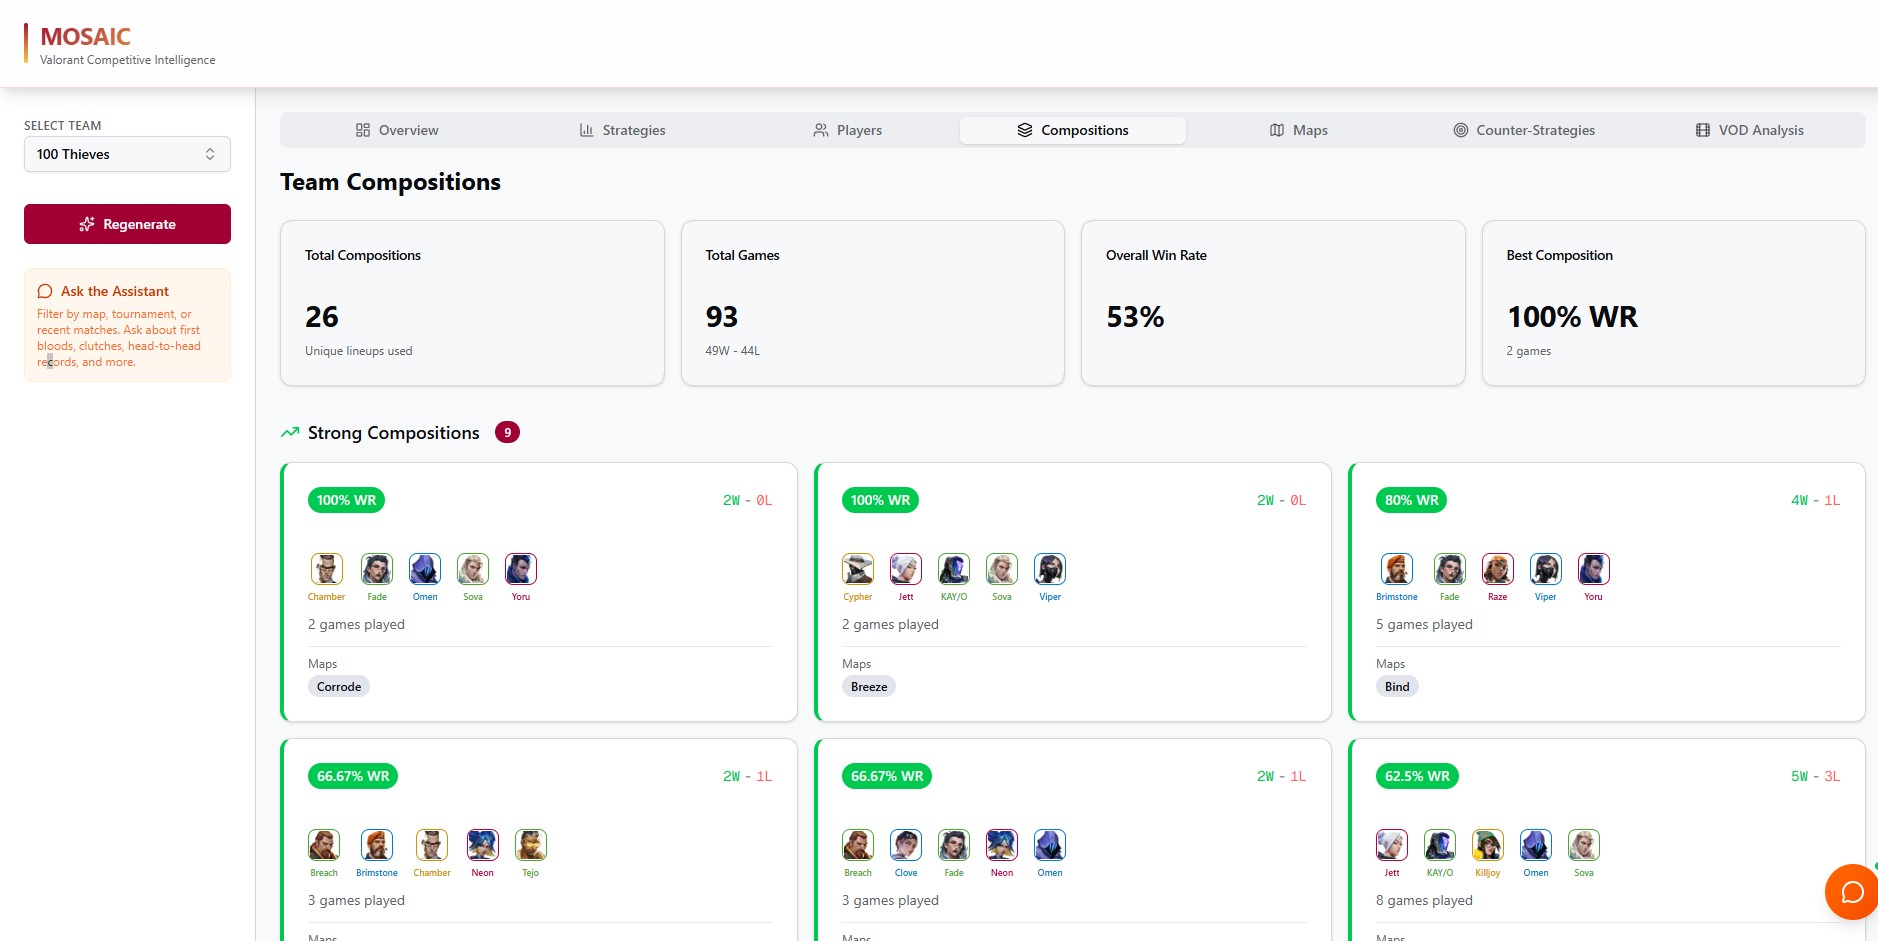
- Agent Composition Tracking: Meta adaptation, role distribution, composition win rates over time
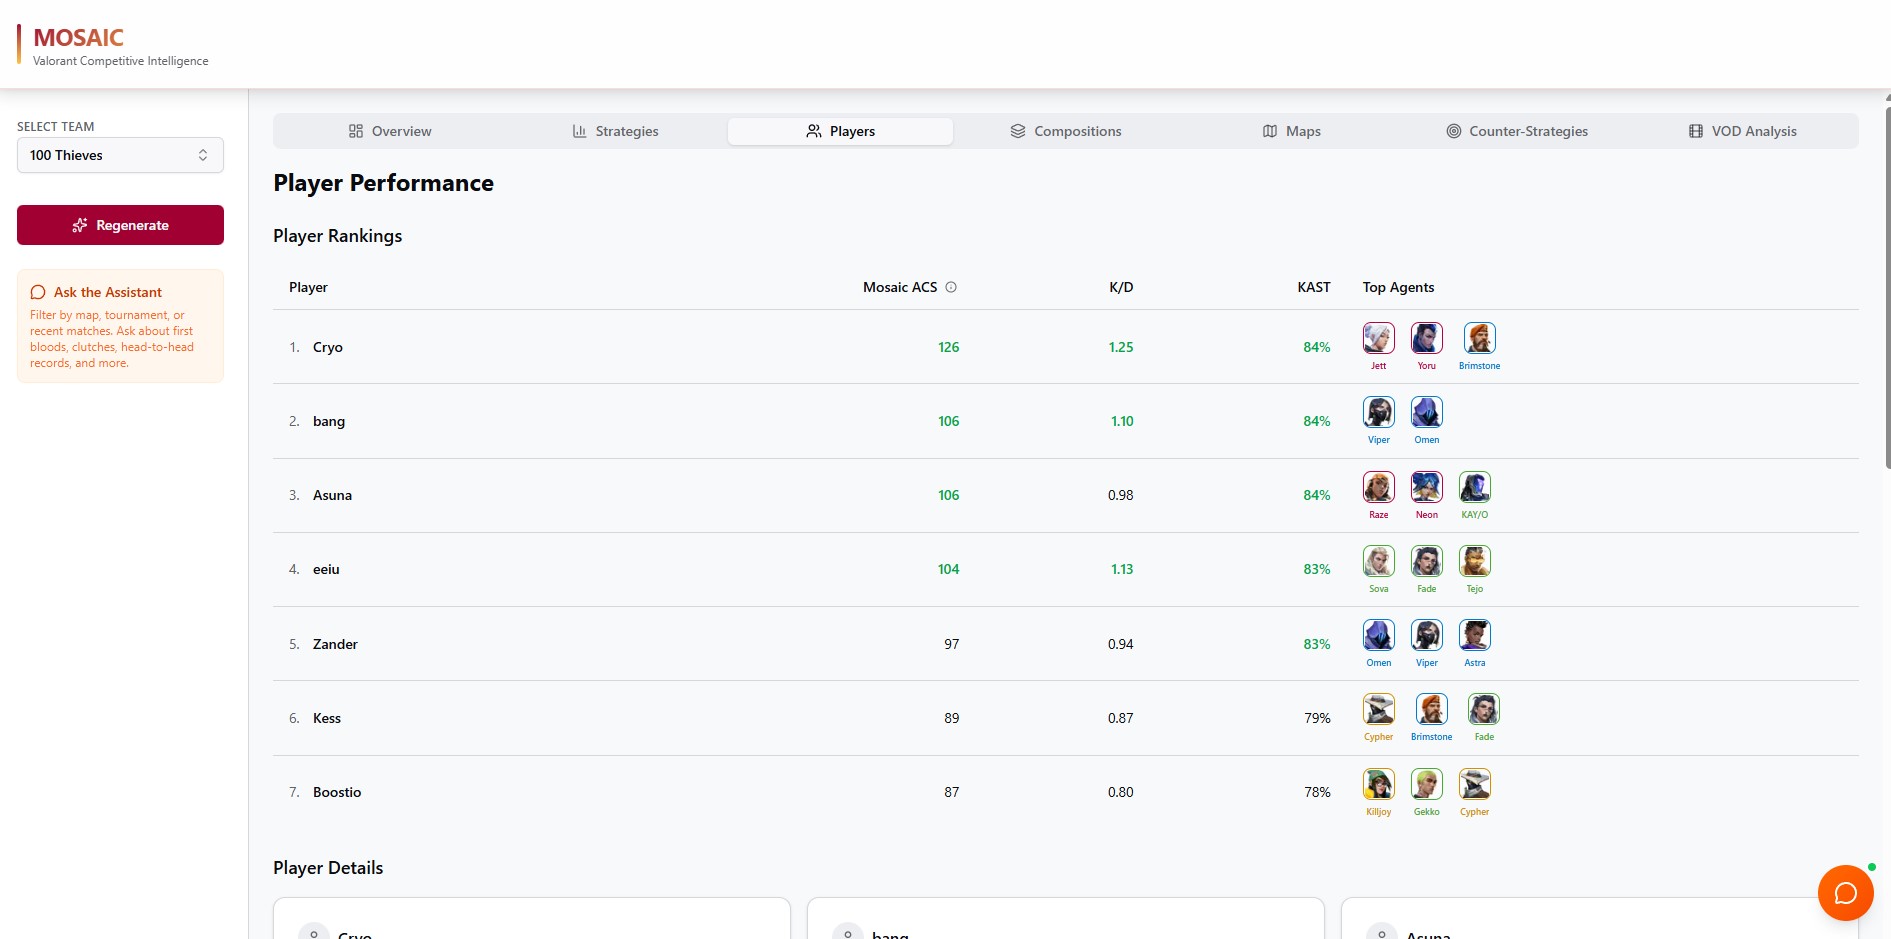
- Player Tendency Mapping: Individual player patterns, agent pools, clutch performance, opening duel stats
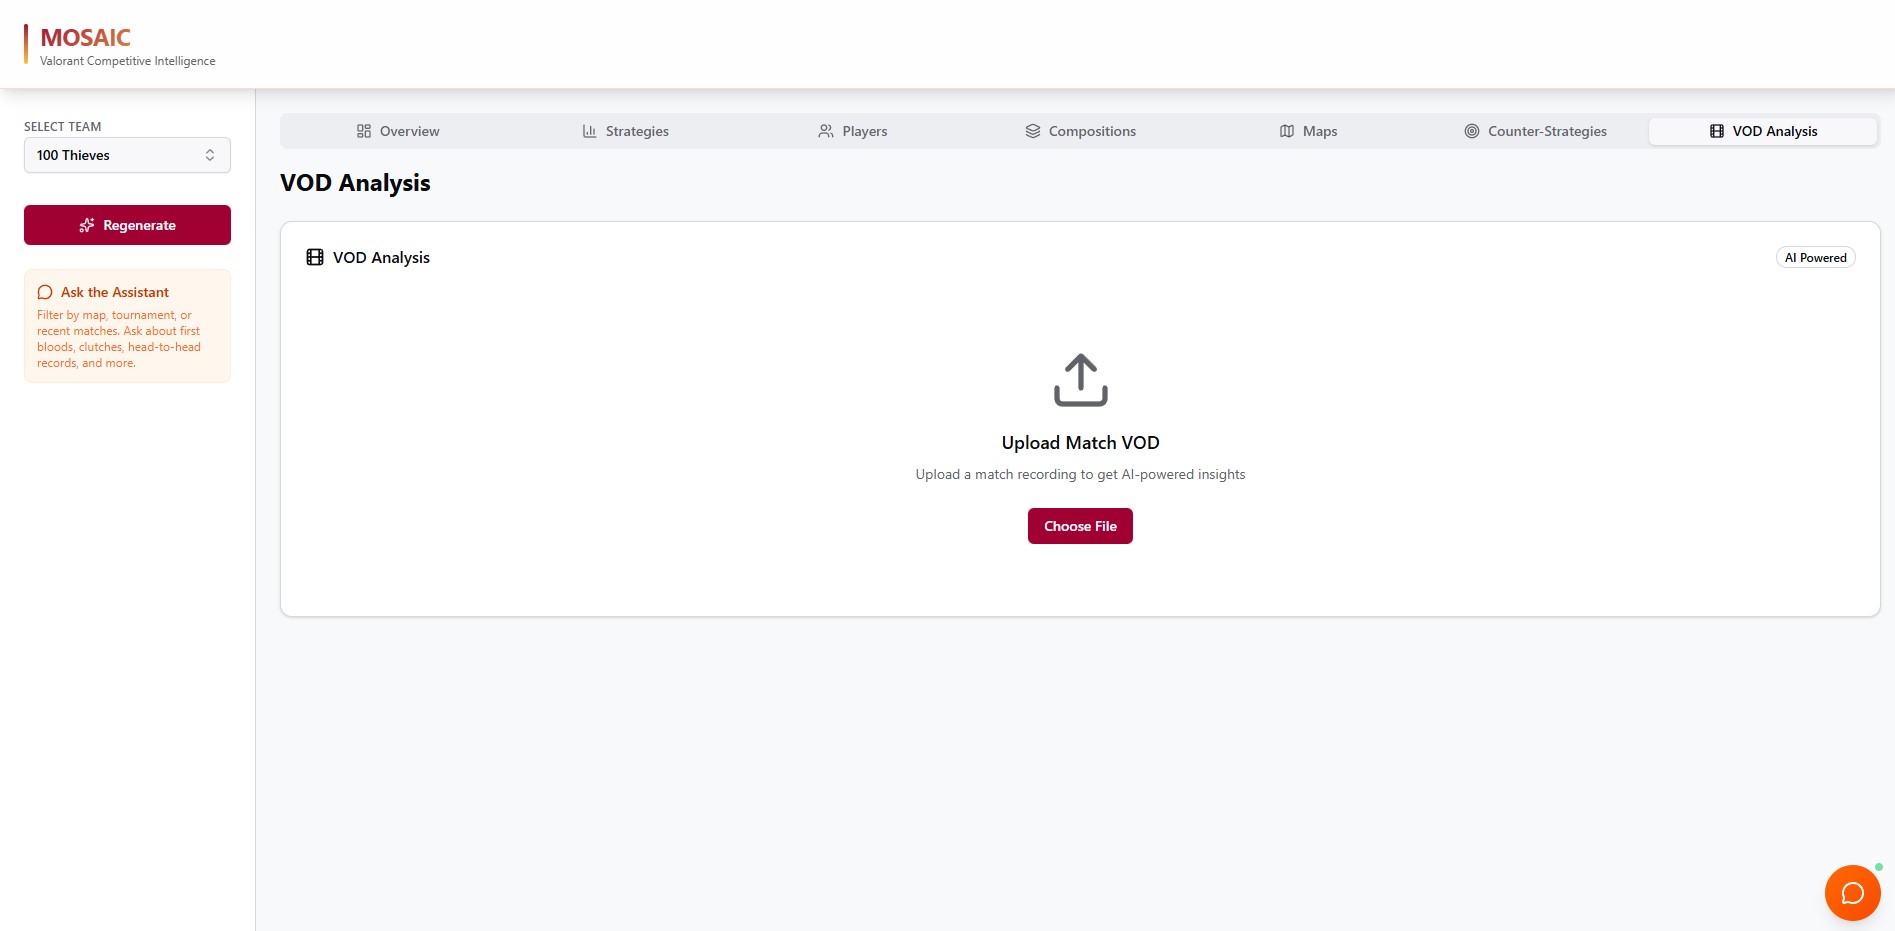
AI-Powered Counter-Strategy Generation:
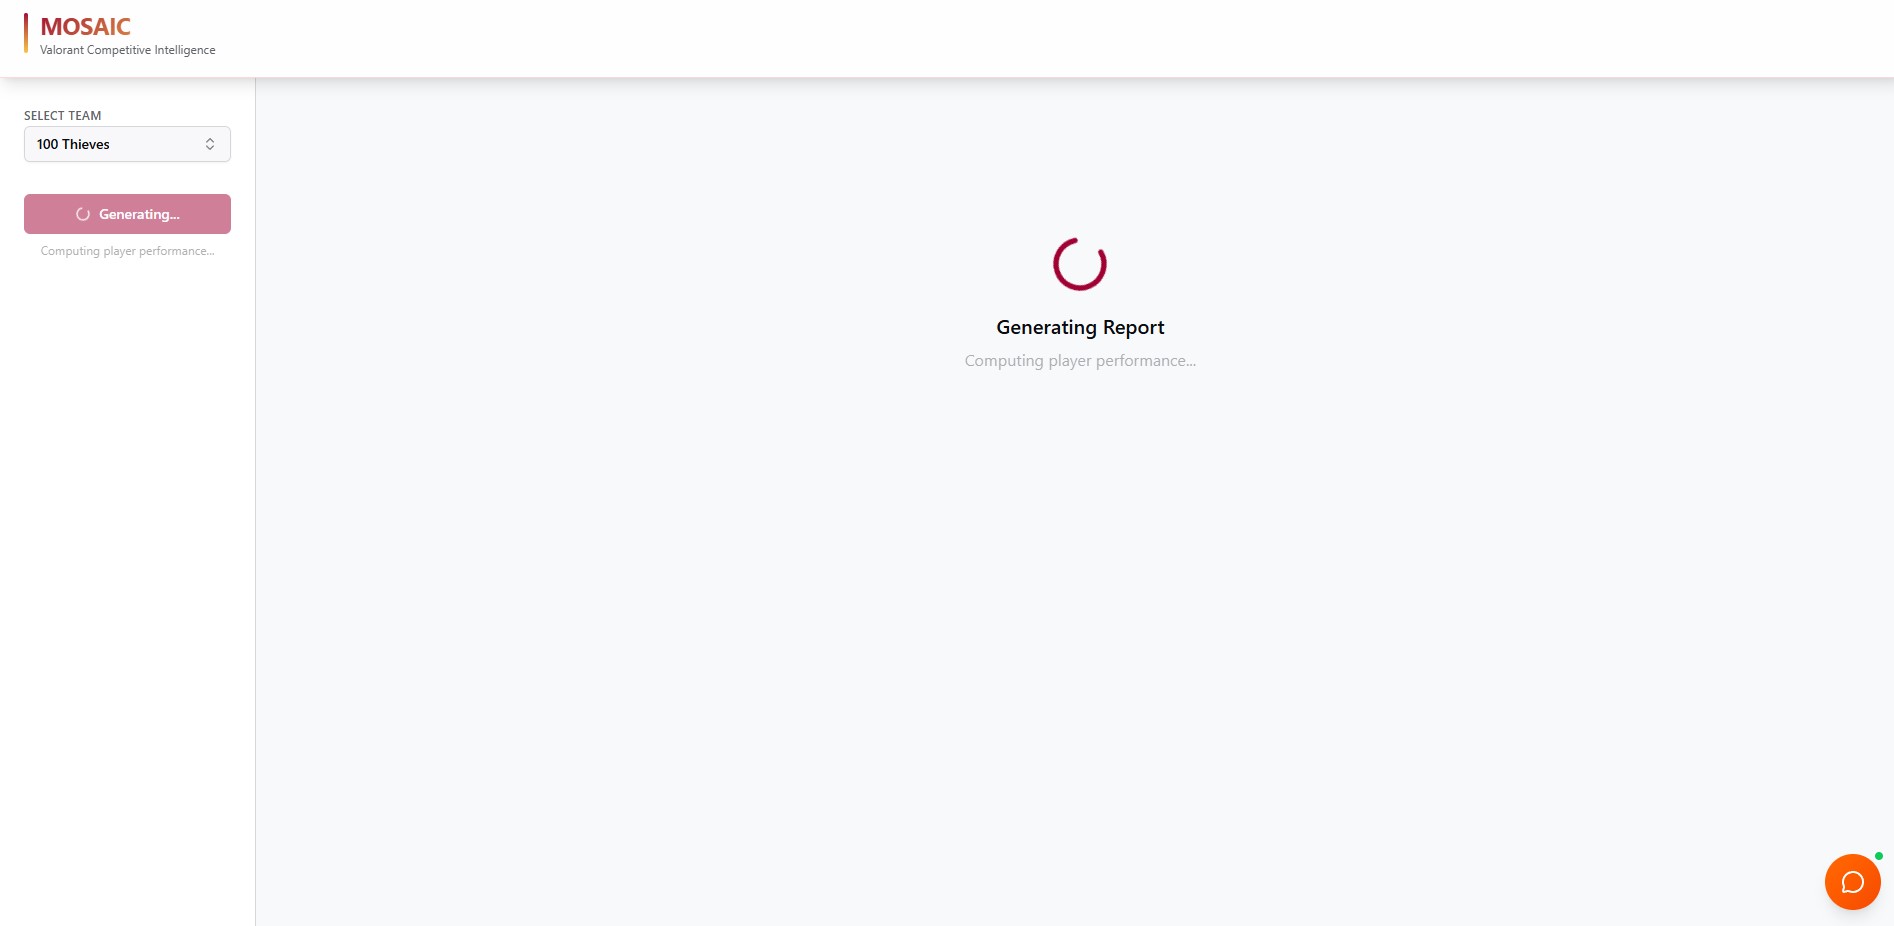
- Upload opponent team ID, select recent series to analyze
- AI identifies exploitable patterns: "Team X attacks A-site on Ascent 58% of rounds"
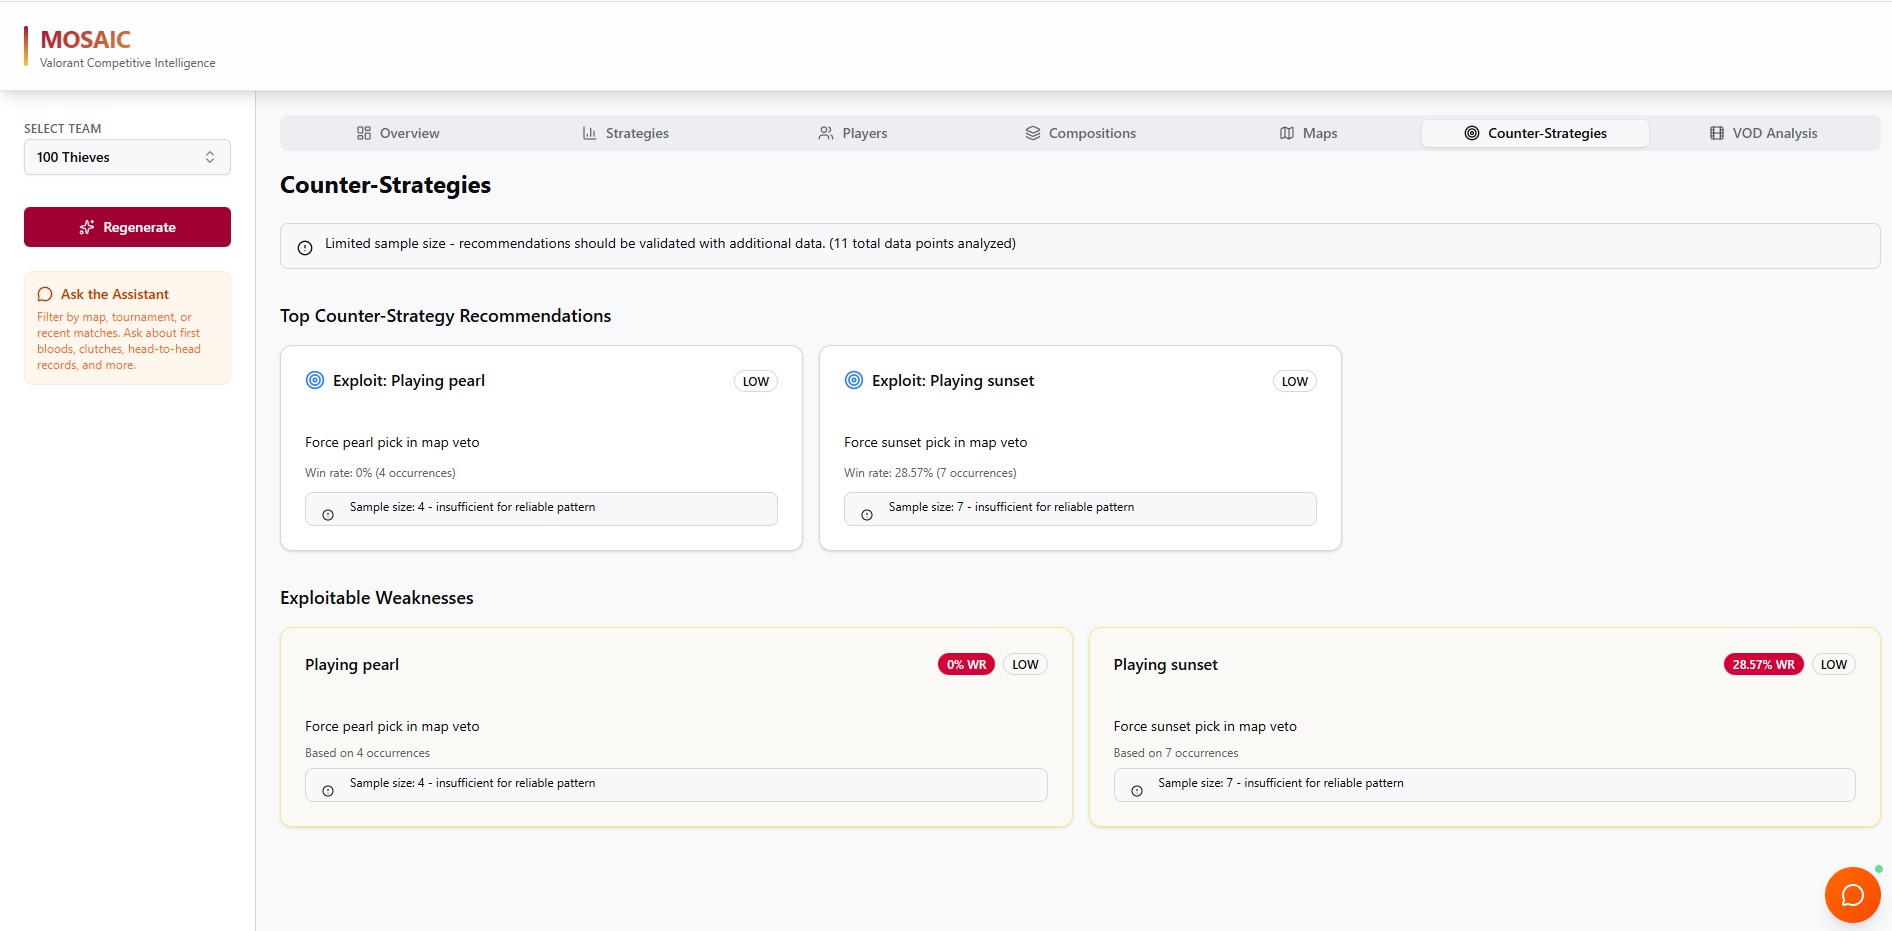
- Generates specific counter-recommendations: "Stack 3 defenders A early, rotate aggressively on B hit"
- Priority ranking (high/medium/low impact)
- Map-specific tactical adjustments
Materialized Views for Performance:
- 50+ pre-computed analytics views for instant dashboard loads
- Views include: team attack pistol patterns, defense pistol strategies, economy patterns, site preferences, agent meta
- Player performance views: K/D/A, first blood stats, clutch breakdowns, agent pool analysis
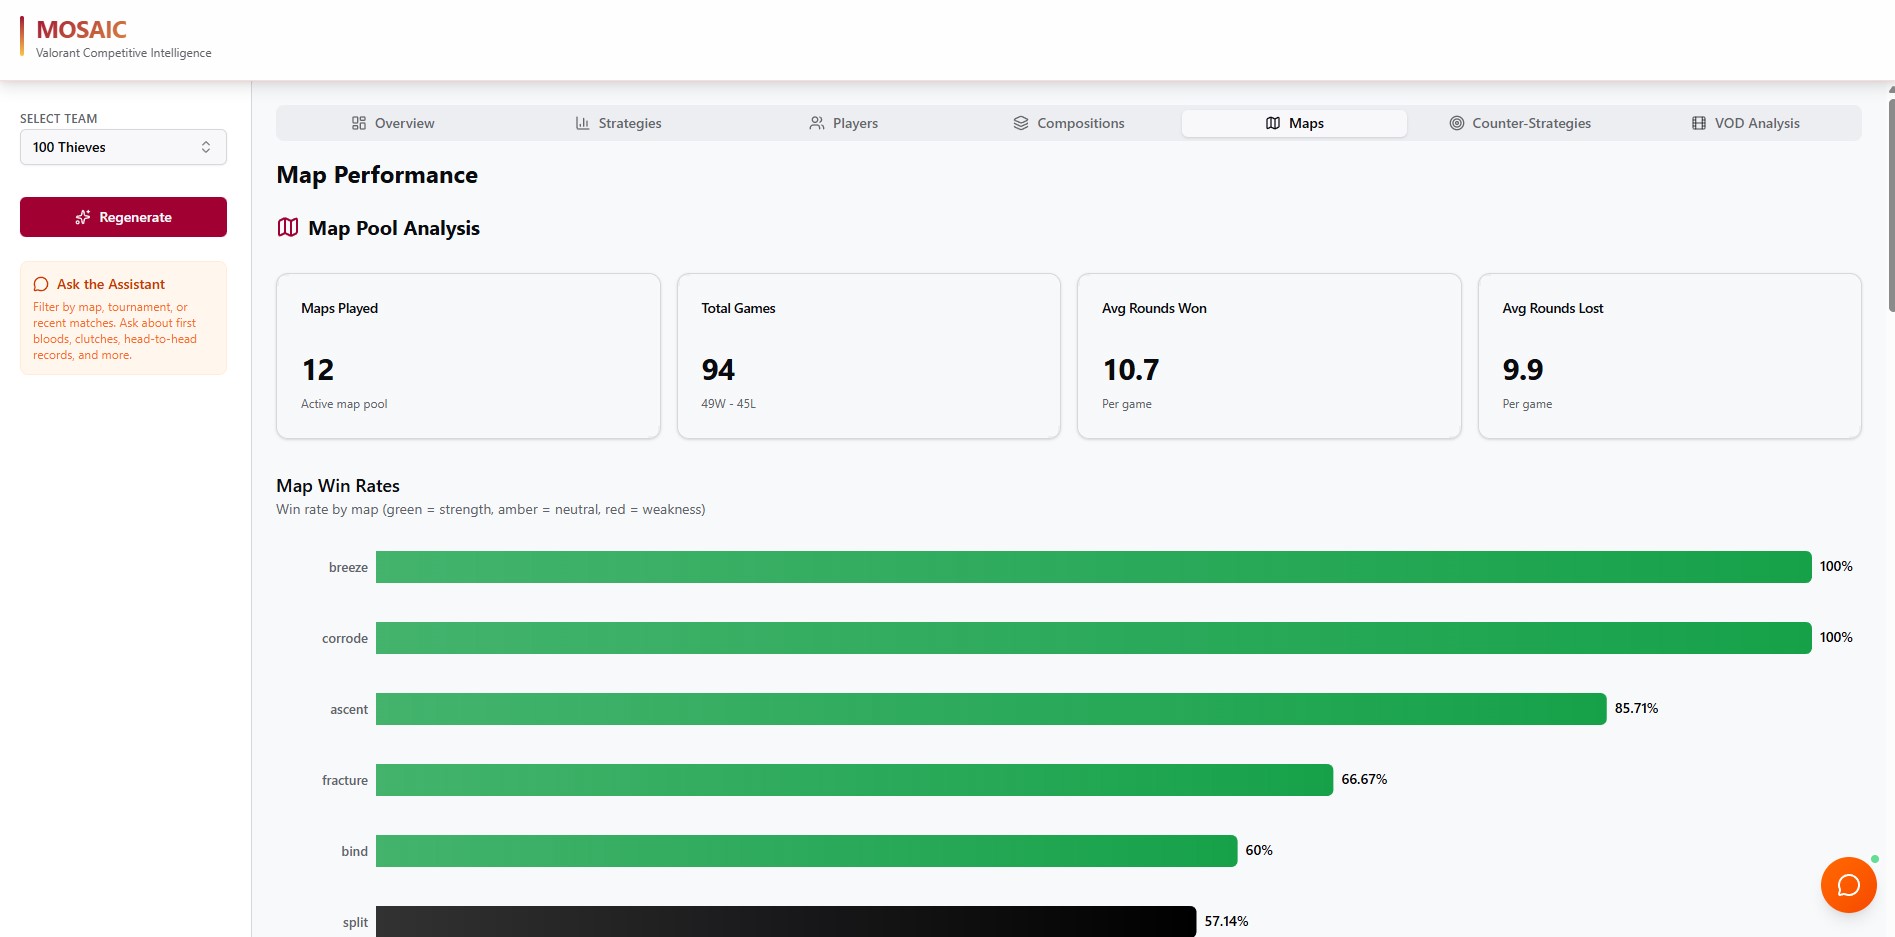
- Map analysis views: win rates, composition preferences, site-specific patterns, veto tendencies
- Sub-100ms load times for complex analytical queries despite processing 100,000+ round events
Multi-Series Analysis:
- Compare team performance across tournaments and time periods
- Track strategic evolution: "They started playing double controller on Breeze after losing to Team Y"
- Identify meta adaptation and composition shifts
Snapshot System:
- Save team strategic state at specific tournament dates
- Compare snapshots: "How has their Bind A-site attack changed since VCT Americas Week 1?"
- Track improvement or regression over time
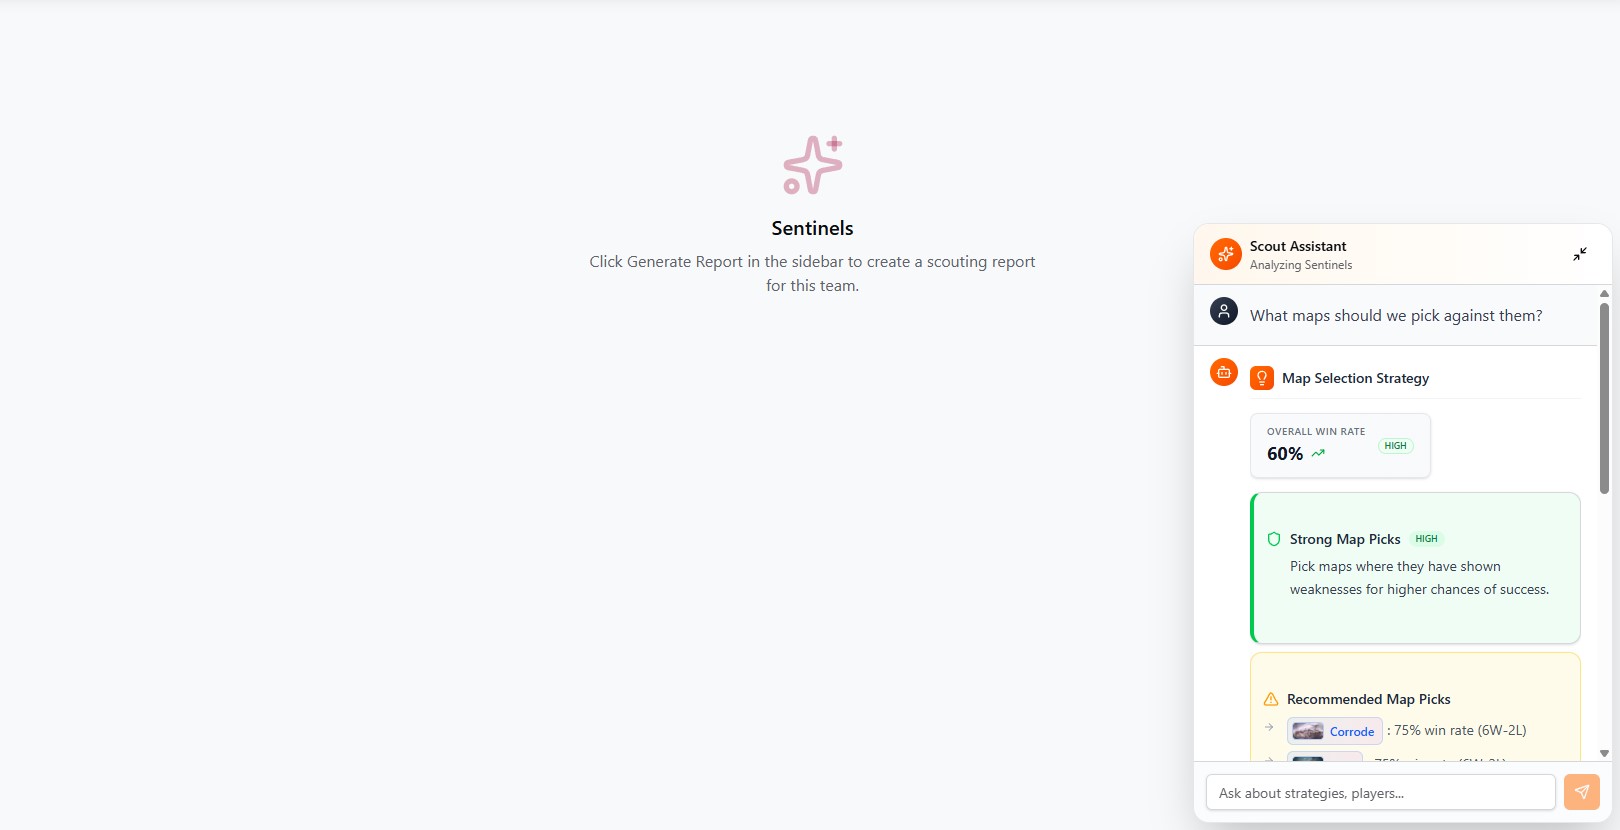
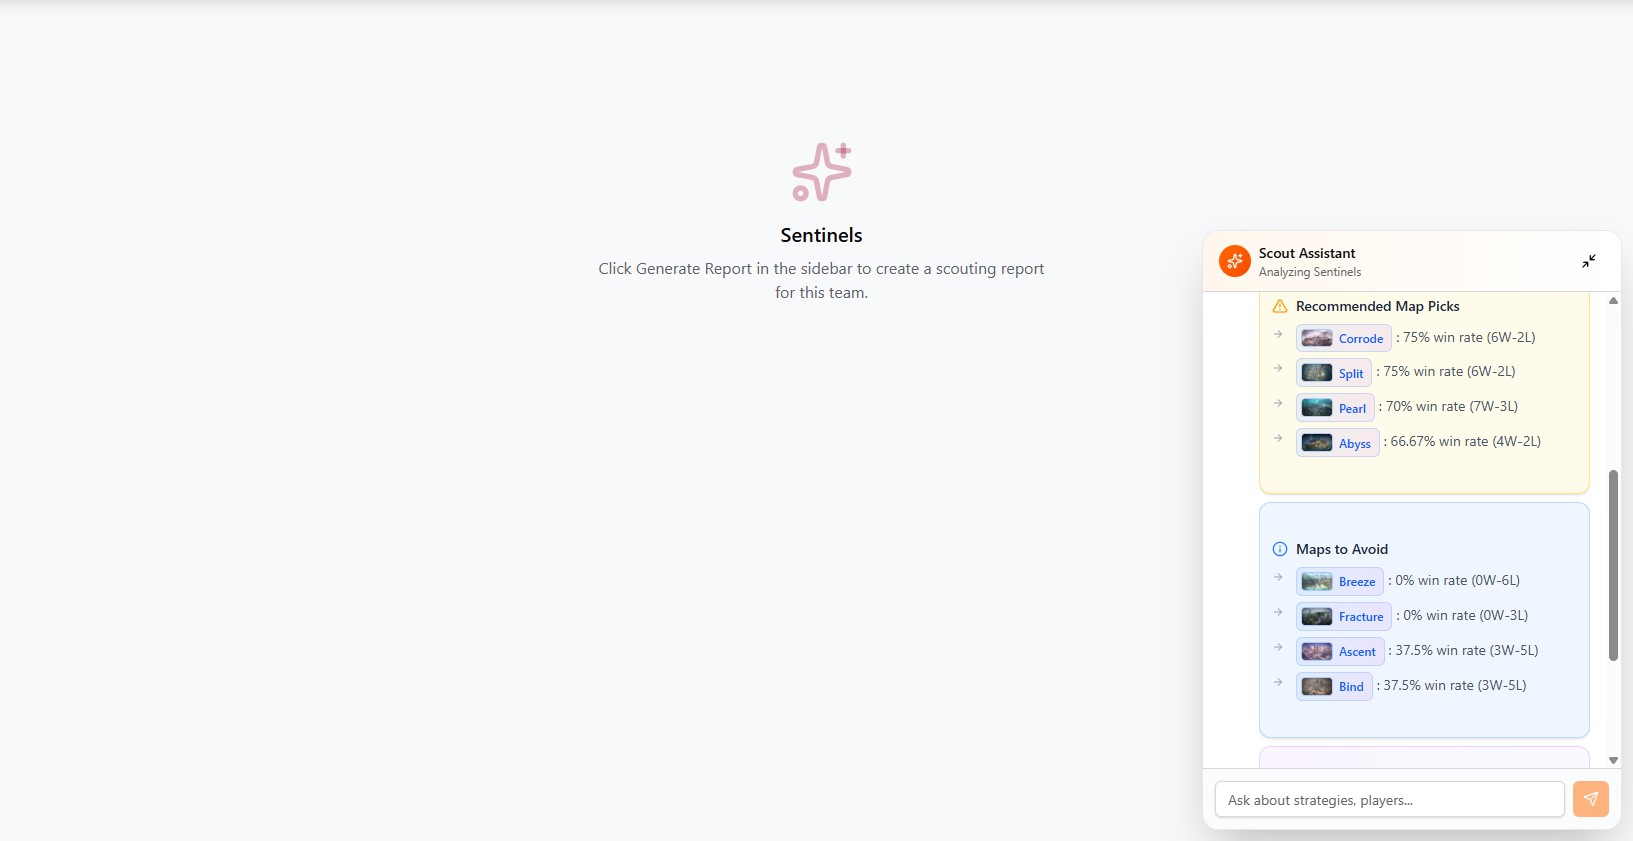
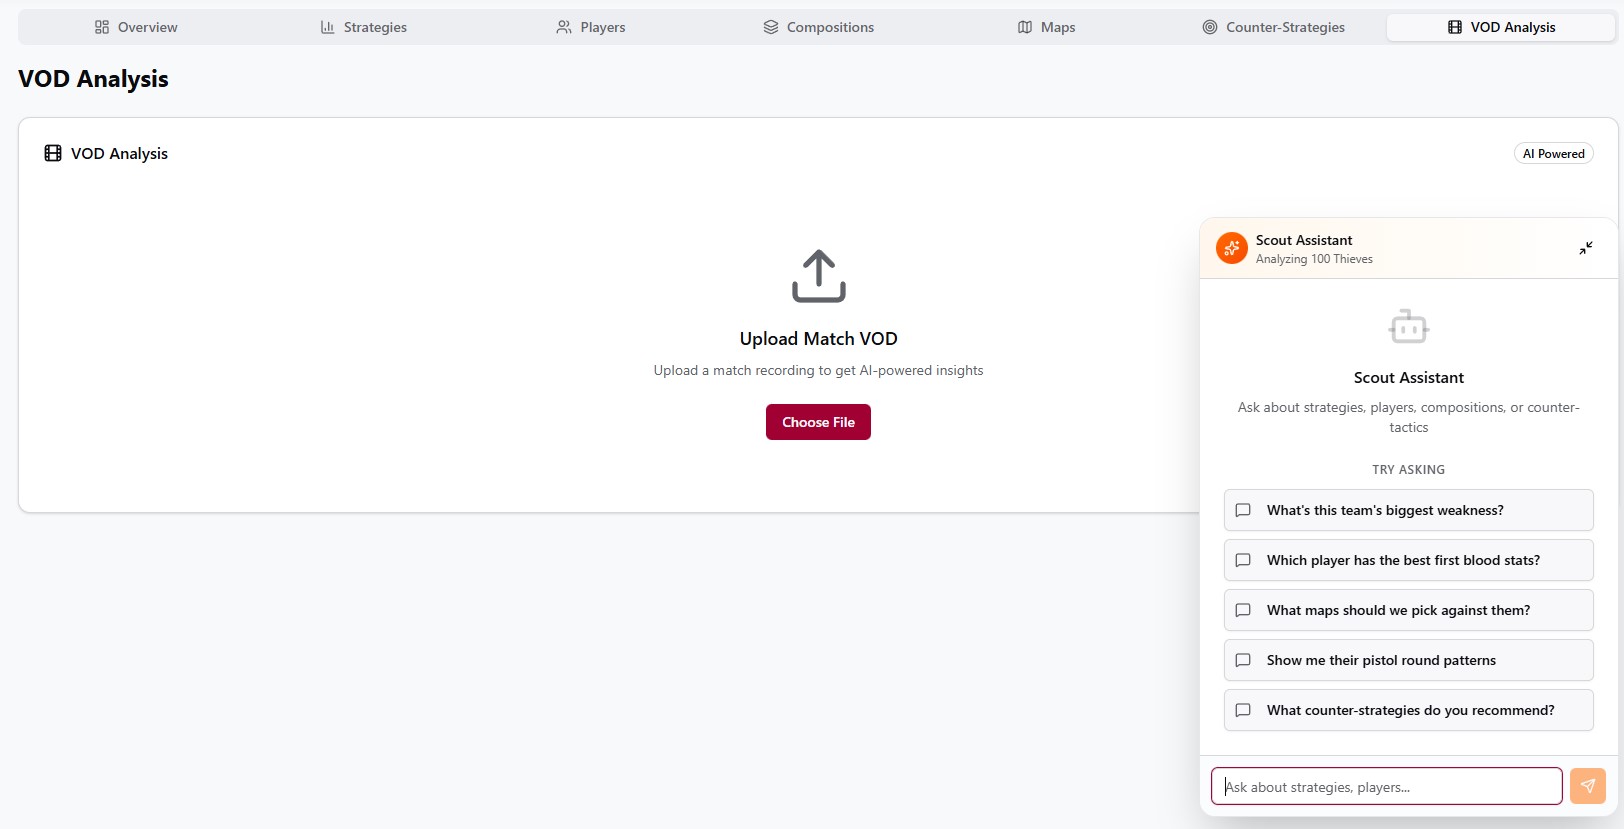
AI Chat Integration:
- Natural language queries with Claude Sonnet 4
- "What are Sentinels' site preferences on Bind?"
- "Generate counter-strategies for 100 Thieves based on their last 10 matches"
- "Show me TenZ's agent pool and clutch performance"
- AI has access to full team analytics, player data, historical matches, composition success rates
How we built it
Frontend Architecture:
- Next.js 16 with App Router for server-side rendering
- TypeScript 5.0 for type safety across complex VALORANT data models
- Tailwind CSS with custom VALORANT theme (red accents, tactical aesthetics)
- Radix UI + custom components for consistent interface
- React Query for server state management and optimistic updates
- Framer Motion for smooth page transitions
- Recharts + custom visualizations for site preference charts, economy graphs, agent pick rates
Database & ETL Pipeline:
- Supabase PostgreSQL as the foundational database
- Extract: Ingest VALORANT match data from Grid.gg API
- Transform: Calculate advanced metrics from raw round events
- Site attack rates, defense setup patterns
- Economy phase classification (pistol/eco/force/full buy)
- Clutch situation detection and success rates
- Agent composition frequency and win rates
- Opening duel statistics, first blood/death impact
- Load: Bulk insert with strategic indexes for query performance
Materialized View Architecture (The Secret Sauce):
- 50+ pre-computed analytics views replace expensive real-time aggregations
- Team Strategy Views: attack pistol patterns, defense pistol patterns, economy patterns by phase, site preferences per map, agent meta adaptation
- Player Performance Views: core stats (K/D/A, combat score), agent pool with comfort levels, first blood statistics, clutch situation breakdown, role flexibility analysis
- Map Analysis Views: team map win rates, composition preferences per map, site-specific attack/defense patterns, map pool veto analysis
- Composition Analysis Views: team compositions with frequency and win rates, composition performance by map, meta adaptation timeline, role distribution balance
Materialized View Refresh Strategy:
- Selective Refresh: Only refresh views affected by new matches (not all 50+)
- Concurrent Refresh: PostgreSQL's
REFRESH MATERIALIZED VIEW CONCURRENTLYprevents table locks - Incremental Processing: Only new series since last refresh are processed
- Auto-refresh Triggers:
- When 5+ new series ingested
- Every 24 hours
- Manual refresh by user
- Refresh function targets specific team:
refresh_team_views(team_id)only updates that team's views
Database Indexes:
- B-tree indexes for exact lookups: player_id, team_id, game_id, series_id
- Composite indexes for common patterns:
(team_a_id, team_b_id, start_time) - GiST indexes for agent name pattern matching
- Strategic indexing reduces query time from 2-3 seconds to sub-100ms
AI Integration:
- Claude Sonnet 4 via Anthropic SDK for counter-strategy generation
- Prompt engineering: structured input with team patterns, output with weaknesses + recommendations
- Pattern detection algorithm identifies: predictable site preferences (>50% one site), weak eco performance (<15% conversion), poor pistol execution (<40% win rate), frequent unfavorable clutches
- AI enhancement layer adds context, priority ranking, map-specific tactics
Analytics Engine Logic:
- Site Preference Calculation:
site_attack_rate = site_attacks / total_attacks * 100 - Economy Phase Classification:
pistol: round 1 or 13 eco: loadout < 5000 force: loadout 5000-15000 full_buy: loadout >= 15000 - Clutch Analysis: Classify 1v1, 1v2, 1v3, 1v4, 1v5 situations, track success rates, compare to benchmarks (1v1: 35-40% expected, 1v2: 15-20%, 1v3+: <10%)
- Map Pool Strength:
win_rate >= 60%: perma_ban (opponent always bans)
win_rate >= 50%: comfort_pick (team picks)
win_rate >= 40%: playable (situational)
win_rate < 40%: weak (team bans)
Development Tools:
- JetBrains WebStorm for TypeScript development
- Junie AI for code generation, materialized view optimization, complex query debugging
- Supabase CLI for database migrations and local development
- Vercel for edge deployment with CDN
Challenges we ran into
1. Materialized View Refresh Performance: With 50+ materialized views, refreshing everything after each new match took 15-20 seconds and locked tables (blocking user queries). We implemented selective refresh (only update views affected by the new team's data) and concurrent refresh (REFRESH MATERIALIZED VIEW CONCURRENTLY) to eliminate locks. Reduced refresh time to 2-3 seconds without blocking users.
2. Complex Pattern Detection Logic: Identifying exploitable patterns required domain expertise. "Predictable site preference" isn't just "attacks A-site most" - it's "attacks A-site >50% with sufficient sample size (20+ rounds) and confidence interval." We built statistical confidence calculations to avoid false patterns from small samples.
3. View Dependency Management: Materialized views depend on each other (e.g., mv_team_site_preferences depends on rounds table). Refreshing in wrong order causes errors. We implemented a dependency-aware refresh orchestrator that refreshes base views first, then derived views.
4. Economy Phase Edge Cases: VALORANT economy is complex. Round 1 is pistol, but what if it's overtime (round 25)? Force-buy threshold varies by team strategy. We built flexible classification logic with special cases for overtime, bonus rounds, and team-specific thresholds.
5. Database Query Optimization: Initial site preference queries scanned 50,000+ rounds and took 3+ seconds. We added composite indexes on (team_id, map_name, round_number) and moved calculations to PostgreSQL functions (RPC), reducing to <50ms.
6. AI Prompt Engineering: Early Claude prompts returned generic advice: "Play for picks, secure map control." We iterated on prompt structure to include specific data (58% A-site attack rate, 12% eco conversion) and demand actionable tactics ("Stack 3 A early rounds 1-5, rotate aggressively on B hit").
7. Incremental Data Processing: Re-processing all 100,000+ rounds on every import was wasteful. We added processed flag to series table and last_refresh_timestamp to views, enabling incremental ETL that only touches new data.
Accomplishments that we're proud of
1. Materialized View Architecture at Scale: We built a production-grade analytics system with 50+ materialized views, selective concurrent refresh, and dependency management. This isn't a hackathon shortcut - it's enterprise-level database engineering.
2. Sub-100ms Analytics Queries: Despite processing 100,000+ round events, dashboard loads are instant. Team site preferences, economy patterns, agent meta - all under 100ms. Users get immediate insights without waiting for complex aggregations.
3. AI Counter-Strategy Generation That Works: The AI doesn't just summarize stats - it identifies exploitable patterns and provides specific tactical counters. "Team X has 12% eco conversion - force more eco situations by winning pistol and denying save rounds." Coaches can actually use this.
4. Real Professional-Level Metrics: We're calculating metrics that matter to actual VALORANT coaches:
- Site preference rates with confidence intervals
- Economy phase win rates (eco/force/full buy)
- Clutch tendency (how often in unfavorable situations)
- Map pool depth scores for veto strategy
- Agent meta compliance tracking
5. Performance-Critical Design: Every architectural decision optimized for query speed - materialized views over real-time aggregation, strategic indexes, RPC functions for server-side calculation, connection pooling. The result: production-ready performance on modest hardware.
6. Clean, Maintainable SQL: Our 150+ RPC functions and 50+ materialized views are well-documented, logically organized, and easy to extend. Adding a new strategic view (e.g., "retake success rate") is straightforward thanks to consistent patterns.
7. Comprehensive Data Model: The schema handles the full complexity of VALORANT esports - tournaments with regions and stages, series with different formats (Bo1/Bo3/Bo5), games with map selection, rounds with economy states, player_round_stats with agent and performance data. It's complete.
What we learned
1. Materialized Views Are Game-Changing for Analytics: Real-time aggregations across 100K+ rows kill performance. Pre-computing and refreshing on data changes transforms user experience from 3-second waits to instant dashboards. The upfront complexity is worth it.
2. Concurrent Refresh Is Critical: Standard REFRESH MATERIALIZED VIEW locks the table - users can't query while refresh runs. CONCURRENT mode allows queries during refresh. This single keyword made the difference between unusable and production-ready.
3. Domain Expertise Matters for Pattern Detection: Algorithmic pattern detection only works if you understand the domain. "High eco conversion rate" is >25% in VALORANT because eco rounds are ~15-20% baseline. Generic thresholds produce false insights.
4. PostgreSQL RPC Functions > Application Logic: Moving calculations to the database (via RPC functions) is faster than fetching raw data and calculating in Node.js. PostgreSQL can aggregate, filter, and calculate server-side, returning only results. Network overhead eliminated.
5. Incremental Processing Is Essential at Scale: Batch re-processing 100K+ rounds on every import doesn't scale. Tracking processed flags and last_refresh_timestamp enables incremental updates - only process new data. Scales linearly instead of exponentially.
6. Index Strategy Requires Query Analysis: Blind indexing wastes space and slows inserts. We analyzed actual query patterns (filters on team_id + map_name, sorts on start_time) and built composite indexes matching those access patterns. Dramatic speedup.
7. AI Needs Structured Data + Context: Claude produces better insights when given structured input (JSON with specific numbers, percentages, sample sizes) versus narrative descriptions. And context matters - "Team has 58% A-site attack rate" is more actionable than "Team prefers A-site."
What's next for Mosaic
1. Live Match Tracking: Real-time strategic analysis during professional matches. Analysts see updating probabilities, strategic tendencies shift based on current round state, in-match adjustment recommendations.
2. Automated VOD Tagging: Computer vision pipeline detects key moments (pistol rounds, eco wins, clutches, retakes) and auto-tags VODs. Coaches find relevant footage instantly instead of scrubbing hours of video.
3. Predictive Modeling: Machine learning models predict match outcomes, recommend optimal map vetos, suggest agent compositions based on opponent tendencies. "Given their Bind A-site preference, our data suggests running double controller B-default."
4. Scrim Analytics: Extend beyond professional matches to team scrims. Amateur and semi-pro teams get same analytics infrastructure as top-tier orgs.
5. Cross-Team Benchmarking: "How does our team's economy management compare to top 10 teams in our region?" Comparative analytics identify strengths and improvement areas.
6. Player Development Tracking: Individual player improvement over time. Track agent pool expansion, clutch rate trends, opening duel progression. Identify which players are improving versus stagnating.
7. Tournament Meta Analysis: Aggregate data across entire tournaments to identify emerging meta trends. "Double controller comps increased 40% at VCT Masters, driven by Viper buffs in Patch 8.08."
8. API for Third-Party Tools: Open Mosaic's analytics engine via API. Tournament organizers, broadcast production, fantasy esports platforms can integrate strategic insights.
9. Mobile Coach Dashboard: Tablet-optimized interface for coaches to access insights during match prep sessions, team meetings, and event travel.
10. Custom Report Generation: Automated pre-match reports in PDF format. Email coaches a comprehensive opponent dossier 24 hours before match with all key insights, counter-strategies, and statistical breakdowns.
Mosaic transforms opponent preparation from 10+ hours of manual review to instant algorithmic analysis - giving professional VALORANT teams a data-driven competitive edge.
Built With
- claude
- cursor
- docker
- gridgg
- jetbrains
- junie
- react
- supabase
- typescript
- webstorm


Log in or sign up for Devpost to join the conversation.