-
-

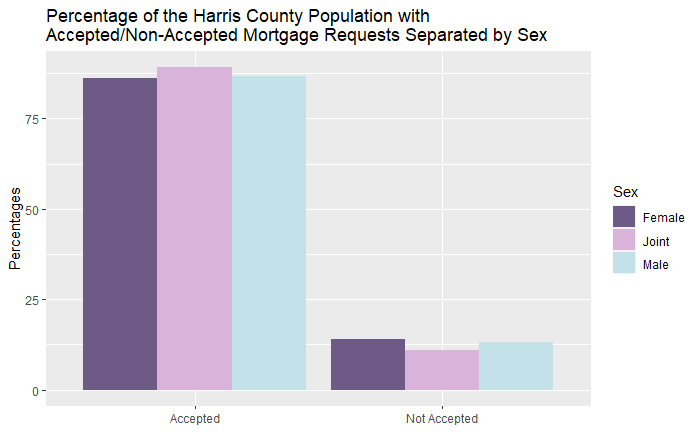
Percentage of the Harris County Population with Accepted/Non-Accepted Mortgage Requests Separated by Sex
-

Percentage of the Harris County Population with Accepted/Non-Accepted Mortgage Requests Separated by Race/Ethnicity
-

Percentage of the Harris County Population Not Accepted for Mortgage Requests with a Reason of Other Separated by Race/Ethnicity
-

Percentage of Each Denial Reason
-

Heat Map Distribution of Loan Rejection Rate Separated by Race/Ethnicity and Loan Rejection Reason over Total Population
-

Heat Map Distribution of Loan Rejection Rate Separated by Race/Ethnicity and Debt to Income Ratio over the Total Population


Introduction and Inspiration
Mortgages are agreements that provide loans for people to purchase homes. Through the purchase of homes, people can gain social status and stability. If there were discrimination present in the distribution of mortgage loans, an unfair advantage would be present in specific races. Historically, mortgages from banks were denied to groups of people on the basis of sexuality, race, ethnicity, gender, and other identities. Since the establishment of the Home Mortgage Disclosure Act in 1975, banks began to disclose lending practices. Specifically, this allowed the collection of data related to the identities of accepted and rejected applicants.
In correspondence with the Beginner’s Challenge of Rice Datathon 2022, we will investigate whether there still exists racial and ethnicity or gender discrimination using Harris County’s mortgage acceptance data. Socially, if there were implications of mortgage discrimination today, they would signify a general socially regressive distribution of property wealth based on racial groups. These implications inspired us to take on the Beginner’s Challenge in an exploration of the correlations between mortgage acceptances and identities.
Team Process
Our team was mostly split into two. Mary Mikos and Lizeth Mendoza focused on coming up with data relationships to visualize while Kelly Zeng and Didi Zhou worked on generating regressions and creating the data visualization. We had a cyclical flow of information where, as half of the team coded, the other half interpreted the graphs and planned future visualizations.
Challenges
Going into this project, our four team members had different skill sets. We wanted to find a way to allow everyone to contribute with their individual proficiencies. We decided to use the different platforms of RStudio and MATLAB to create different visualizations to be the most time efficient. It also allowed us to depend on one another if one of us could not figure something out in the language we were comfortable with.
When coding, we also ran into some bugs. We had to learn coding as the project moved along since our coding skills have not been shaped to their fullest. Sometimes that meant that there were some errors that we just could not decipher. Due to these errors, we decided to remove the visualizations of a few bar plots since we already had quite a few graphs that provided sufficient information. Also, we were not familiar with logistic regressions. However, we attempted our best at creating a logistic regression and using it for our data.
Lessons Learned
As a team, we learned how to develop a smooth flow of information between the two groups. Moreover, we developed a stronger understanding in data proportioning and visualizations. In terms of coding, we developed our familiarity with reading csv files and using the data to produce several graph formats. For developing the conceptual data breakdowns, we reinforced further understanding on interpreting graphs and identifying important factors and correlators.


Log in or sign up for Devpost to join the conversation.