-
-

Weather sentiment
-

Watson Tone Analyzer

Inspiration
In the era of big data, we can begin to stretch our boundaries about what exactly is weather data. Traditionally for the general public, weather focused around the concept of forecasts and atmosphere measures.
What about conversations about the weather? As micro-blogging, text mining, and natural language processing technologies emerge, one can analyze weather data from a different perspective.
What it does
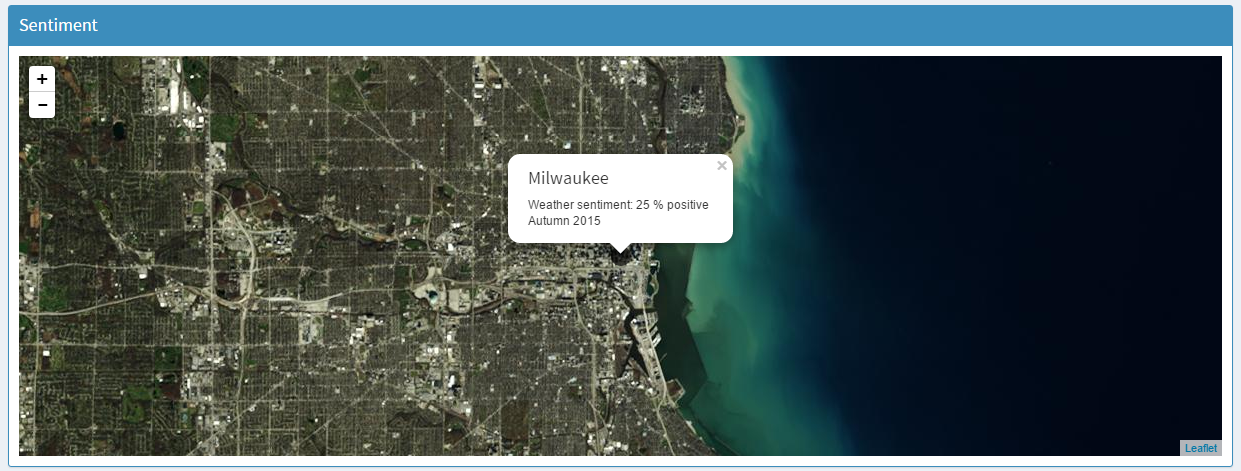
Moody Weather is a web app which analyzes the seasonal Twitter conversations for a select group of cities in the central part of the United States.
It includes the seasonal satellite imagery for the city, the public's weather sentiment score, and the emotional, social, analytic tone scores of the Twitter conversations about the weather.
How I built it
Moody Weather was built using four Bluemix services. I used Insights for Twitter to collect the weather data for tweets from the Central time zone. The weather data set included the decahose stream of all tweets where the keyword weather was mentioned. Spark was used to filter the Twitter data where there was actual location data and the value was not null to create the analysis data set. The third Bluemix service I used was dashDB. I loaded the analysis data into a dashDB table and used the dashDB analytics library to develop my app in R Studio. The final Bluemix service I used was Watson Tone Analyzer. I created a corpus of all tweets for each city and season and fed them to Watson Tone Analyzer. Watson analyzed the weather tweets and classified the context in terms of emotion, sociability, and analytic writing style.
In addition to the Bluemix services, I used the UrtheCast API to obtain the satellite imagery for the selected cities during the season when the weather tweet was created.
The app was created in R with R Studio. R packages include leaflet, httr, ggvis, dplyr, idmdbR, stringr, jsonlite, sqldf, tm, tidyr. The web UI app was built with R using the packages shiny and shinydashboard.
Challenges I ran into
As an R developer, the biggest challenge I faced was how to handle the data in Spark without the SparkR library. I contacted IBM Bluemix support and was informed the SparkR library was not available. Using a hacker mindset, I was able to create an analysis data set in Spark using the Scala notebook. Once I filtered the Twitter Insights data in Spark, I took the analysis data set and brought it into dashDB for app development using R Studio.
What I learned
This was an enjoyable hackathon because I learned many new technologies.
I became very comfortable with the Bluemix platform. I learned how to connect the various Bluemix services and build apps in the cloud. I was able to get more experience with Watson and learned how to connect it with R Studio which gives Watson technology the potential to do more analtyical mashups. I got some experience with Spark and interactive Jupyter notebooks. I learned how to build shiny apps with shinydashboard and I think I will be using the shinydashboard package often. Finally, I was introduced to Leaflet for interactive maps.
What's next?
I would like to create an interactive visualization to compare the Watson tone scores and Twitter sentiment scores over the seasons.
Built With
- apache-spark
- bluemix
- dashdb
- ibm-watson
- insights-for-twitter
- r
- r-studio
- shiny
- urthecast


Log in or sign up for Devpost to join the conversation.