Inspiration
- Created at HackUTD to help T-Mobile proactively understand customer sentiment and respond to service issues faster.
- MoodWave combines empathy with analytics to turn real-time emotions into actionable insights.
What it does
Data Simulation
• Generates fake but realistic social media posts and customer call emotions. • Can later be replaced with live data from APIs like Twitter, Reddit, or Hume AI.Sentiment Classification
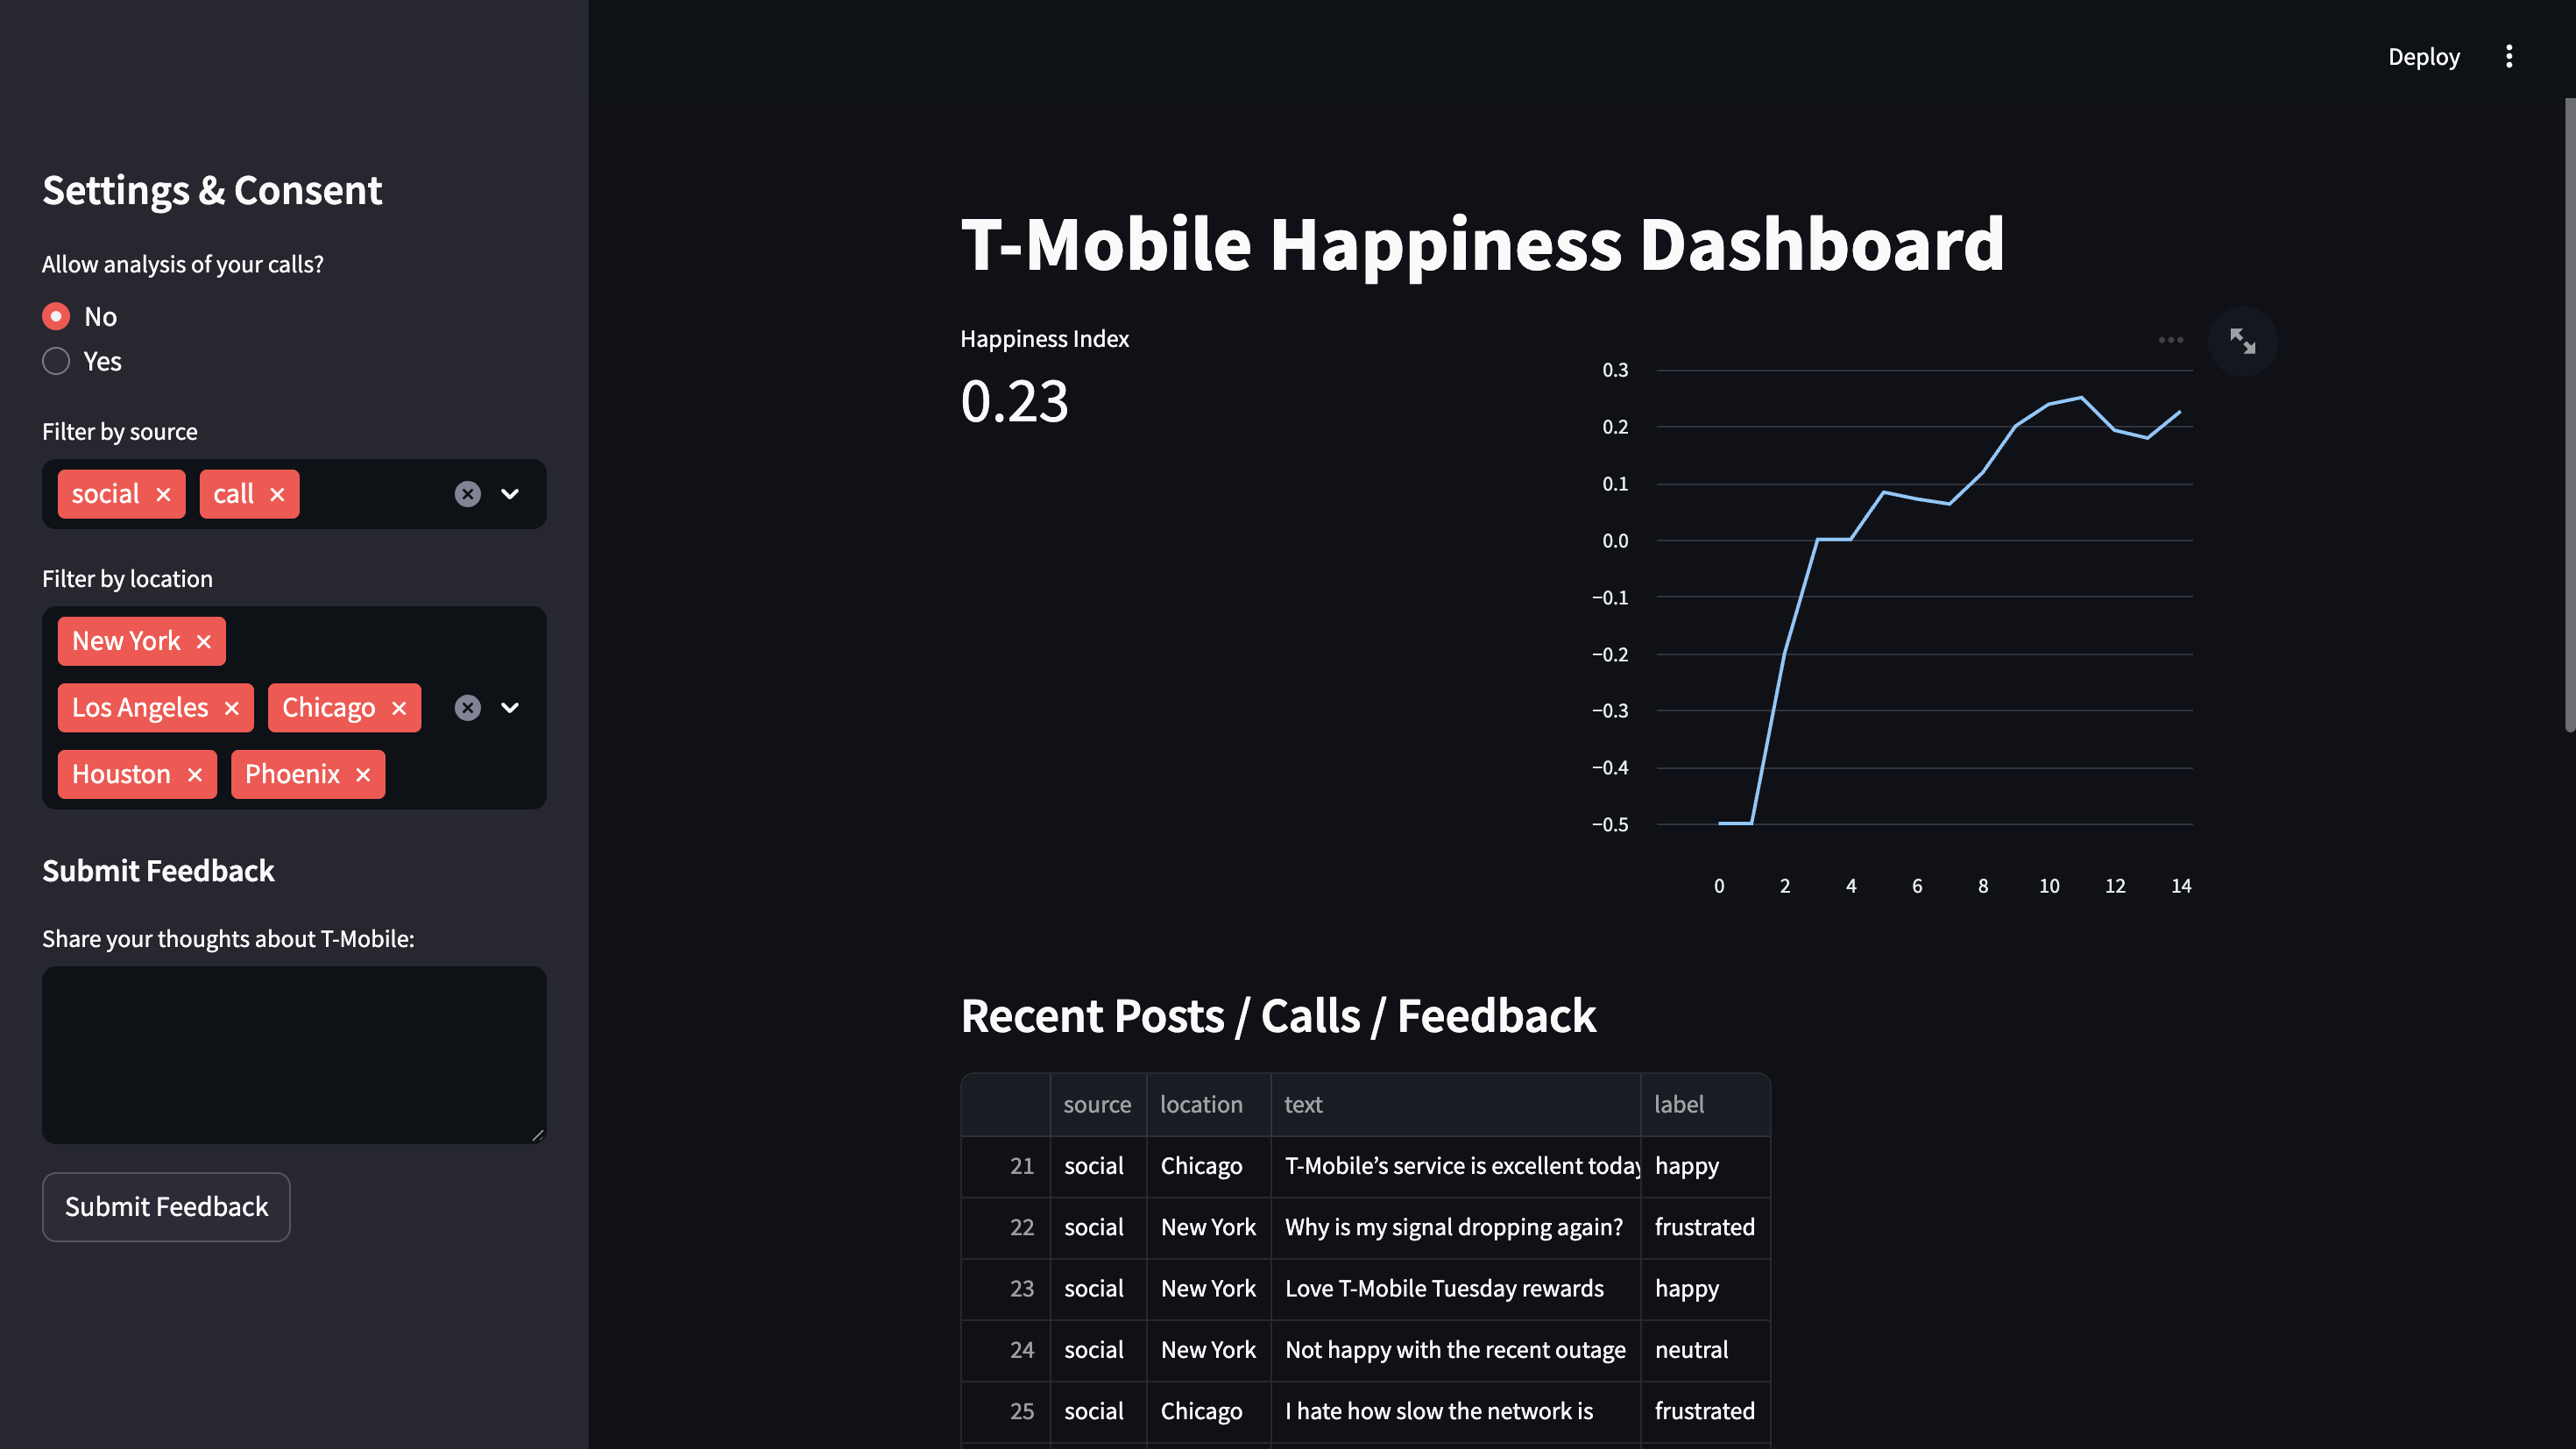
• Uses a lightweight, keyword-based sentiment analysis to label messages as happy, frustrated, or neutral.Happiness Index
Formula: H = (# happy − # frustrated) / total messages
• Values range from −1 (very negative) to +1 (very positive).Visualization
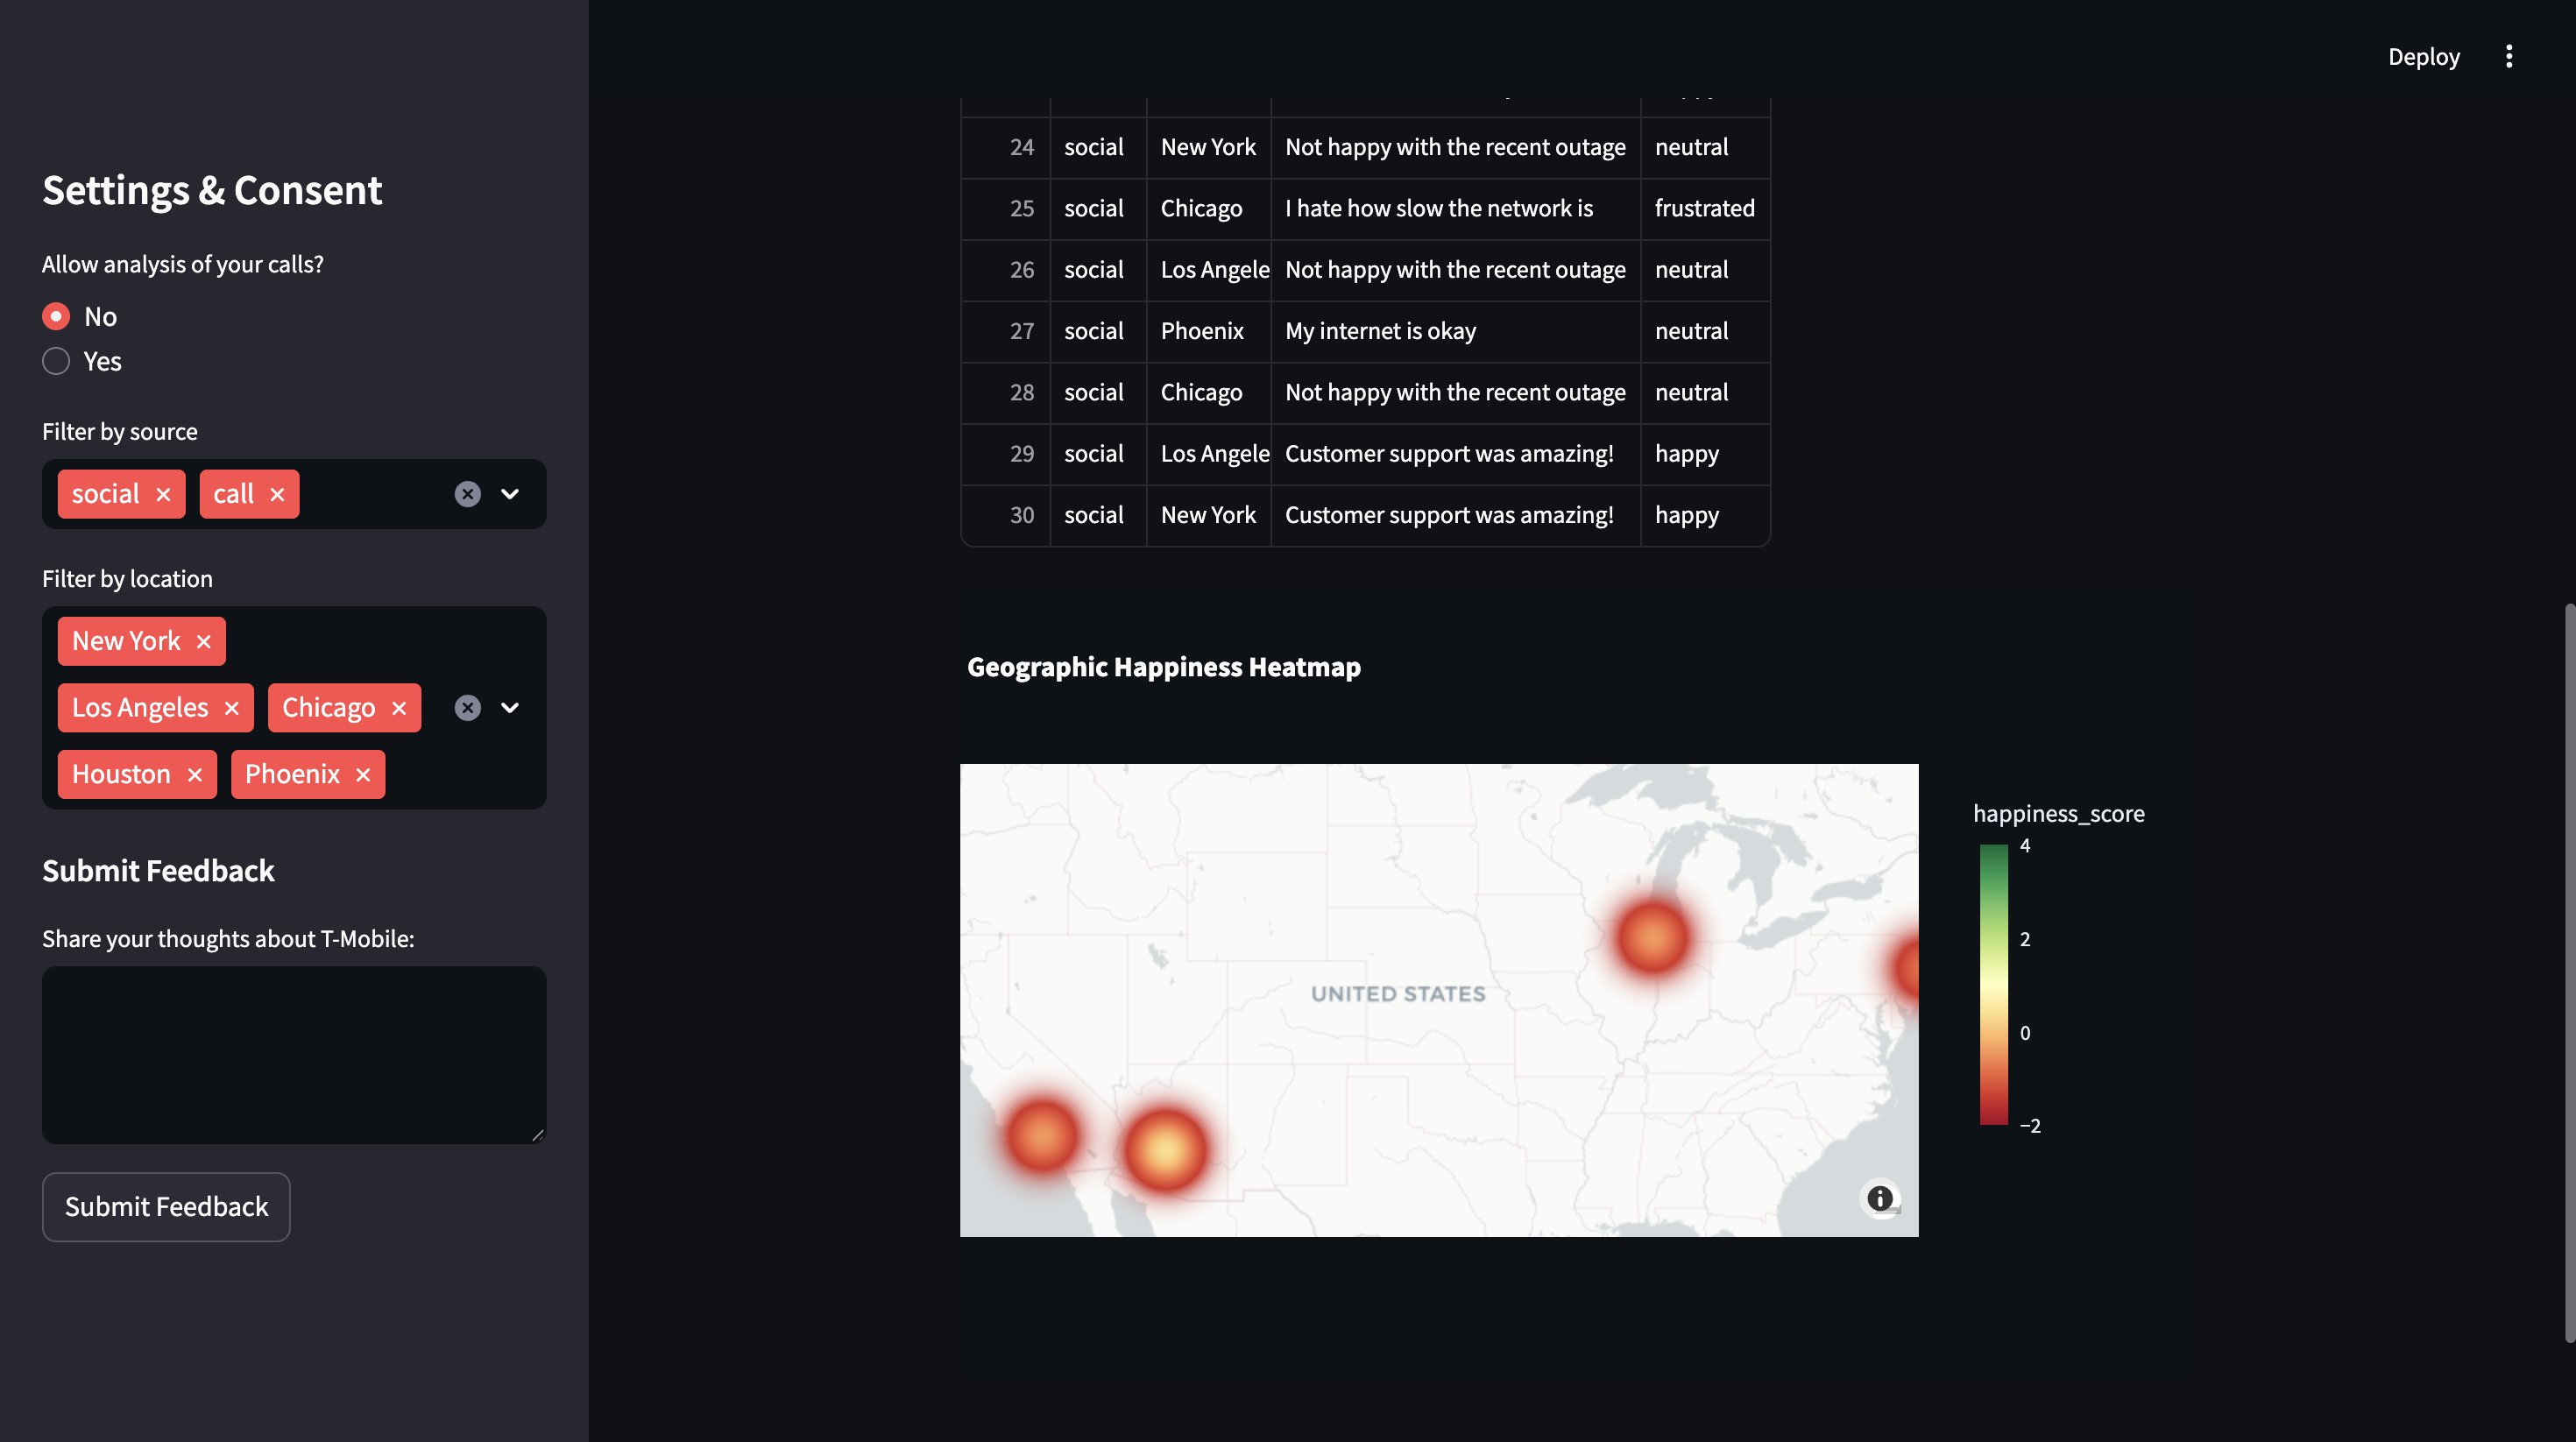
• Trendline — Displays the Happiness Index over time. • Geographic Heatmap — Highlights sentiment intensity by city. • Alert System — Detects sudden drops and triggers warnings for T-Mobile teams.
How I built it
MoodWave was built using Python and Streamlit for an interactive, real-time dashboard. I simulated customer data from social media posts, app feedback, and call transcripts, then analyzed each message with a sentiment analysis model to classify emotions as happy, neutral, or frustrated. The results are visualized live with Plotly showing:
- A Happiness Index that updates every few seconds
- A trendline tracking sentiment changes over time
- A geographic heatmap of customer mood across U.S. cities Finally, an anomaly detection system triggers alerts when overall happiness suddenly drops, helping T-Mobile respond proactively.
Challenges I ran into
One major challenge was accessing real-world data. I planned to use the Hume AI API for emotion detection from voice and facial cues, but I couldn’t obtain an API key in time due to limited developer access. Similarly, getting Twitter Developer and Reddit API credentials proved difficult; both require approval processes that take several days. Because of this, I pivoted to using simulated social media and feedback data, ensuring the dashboard logic, sentiment analysis pipeline, and real-time updates still worked as intended. This allowed me to demonstrate MoodWave’s full functionality even without live APIs.
Accomplishments that I'm proud of
- Built a fully functional real-time dashboard that visualizes customer happiness with live updates.
- Designed a Customer Happiness Index that combines sentiment, geography, and time trends.
- Integrated emotion classification and anomaly detection to identify sudden drops in satisfaction. 4.Created a clean, interactive UI using Streamlit and Plotly, all within a tight timeframe.
- Overcame API limitations by developing a robust simulation pipeline, keeping the project realistic and testable.
What I learned
- Learned how to build interactive web apps with Streamlit, including real-time charts and live updates.
- Gained experience working with APIs, understanding how to authenticate, fetch, and visualize live data.
- Improved my ability to structure a project using Markdown for clear documentation and presentation.
What's next for MoodWave
- Integrate Hume AI for real-time emotion detection from customer calls
- Connect Twitter/Reddit APIs to analyze live customer sentiment
- Add T-Mobile internal network outage feeds for correlation with mood shifts
- Implement a notification system to alert support teams automatically


Log in or sign up for Devpost to join the conversation.