Inspiration
Mental health is something many people struggle with, but tracking it consistently is often difficult. Most tools are either too complex, too time-consuming, or require constant input that people eventually stop using. I wanted to build something extremely simple—open it, log how you feel in a few seconds, and move on—while still gaining meaningful insights over time.
The idea came from a simple belief: data is more powerful than guesswork. Instead of wondering why mood changes happen or whether things are improving, MoodMap helps users actually see patterns in their emotional wellbeing over time.
What it does
MoodMap is a local-first mental wellbeing tracker that lets users log and understand their emotional patterns in a simple and private way.
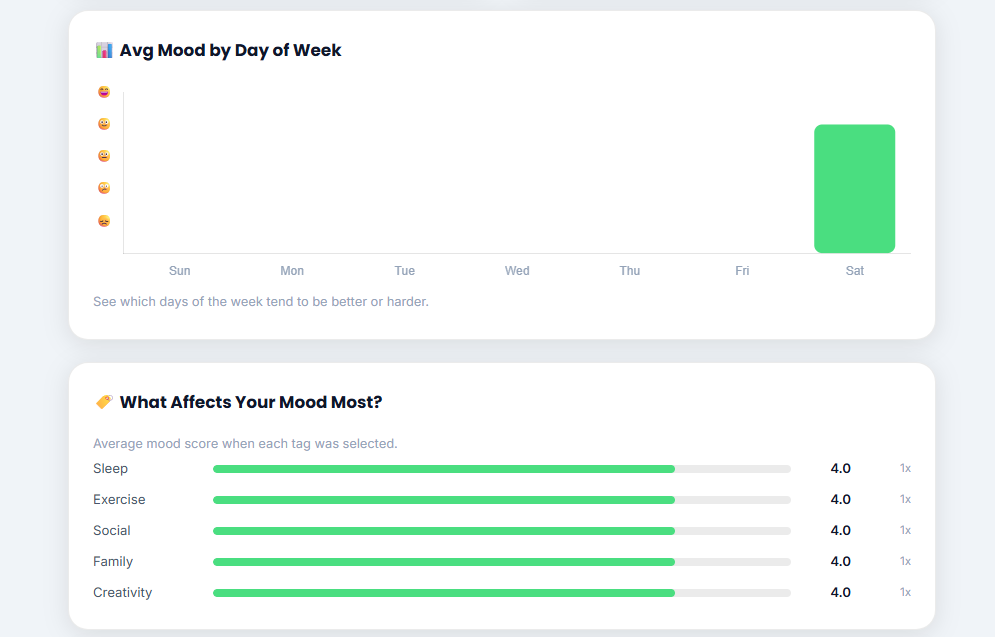
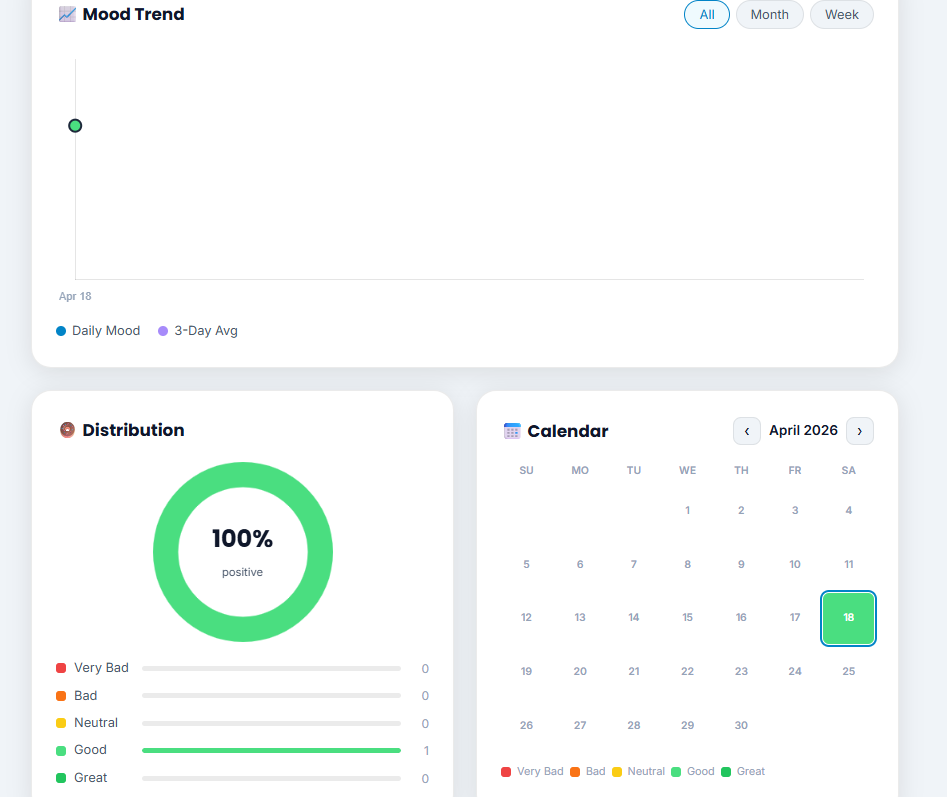
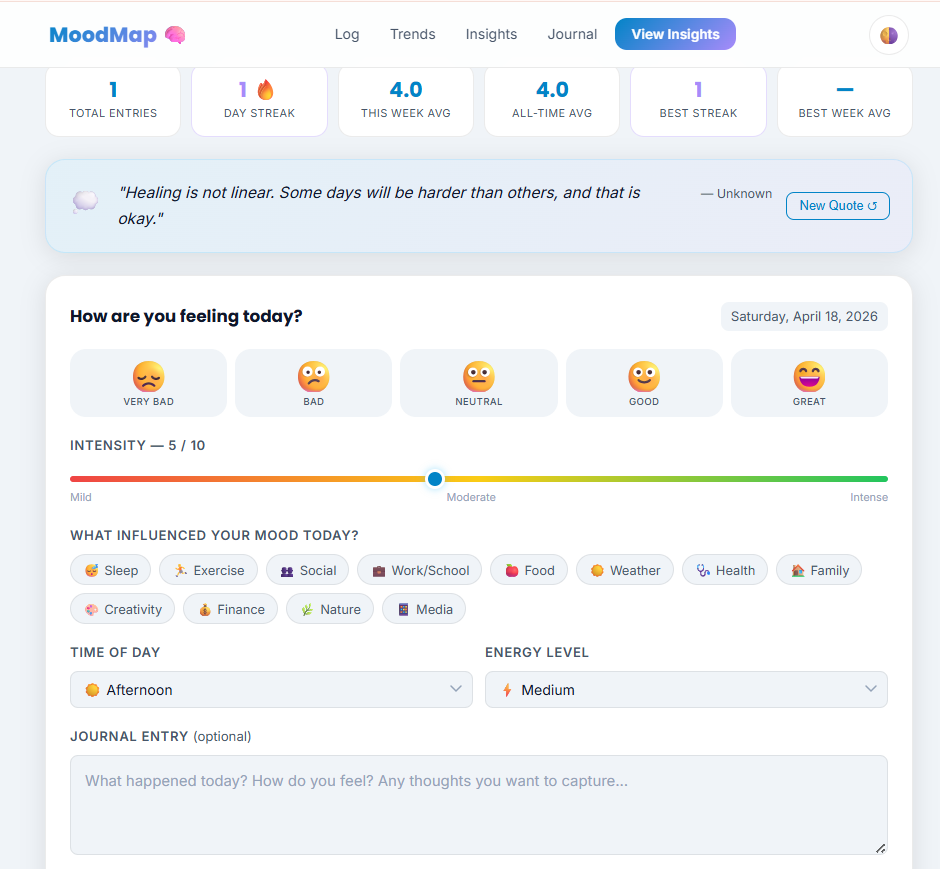
Users can quickly record their daily mood using an emoji-based scale, along with optional tags like sleep, exercise, or social activity that may have influenced how they feel. Over time, the app turns this data into clear visual insights, showing mood trends, averages, and changes across days of the week.
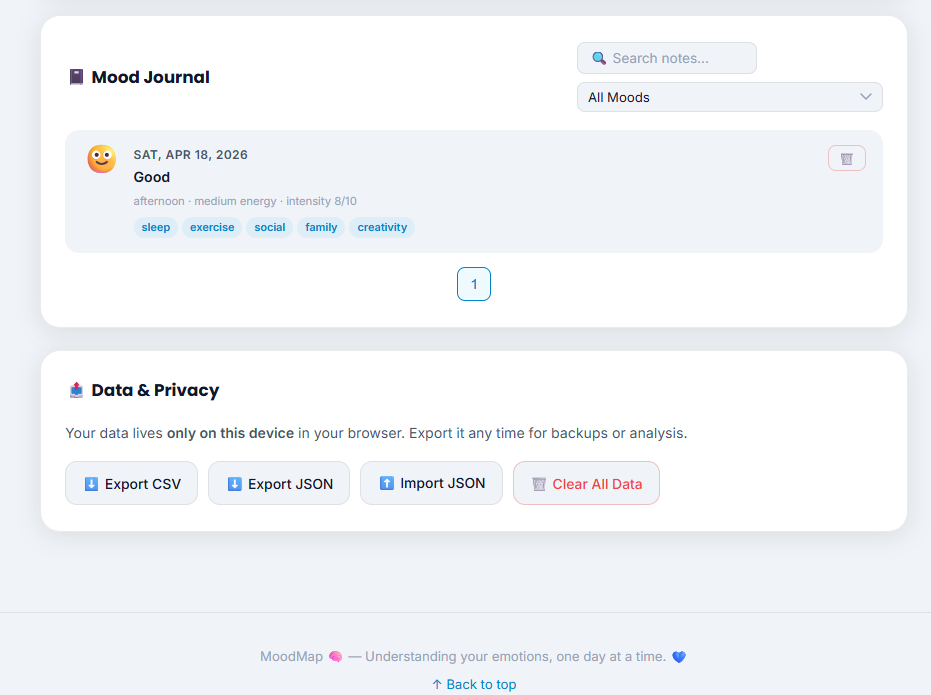
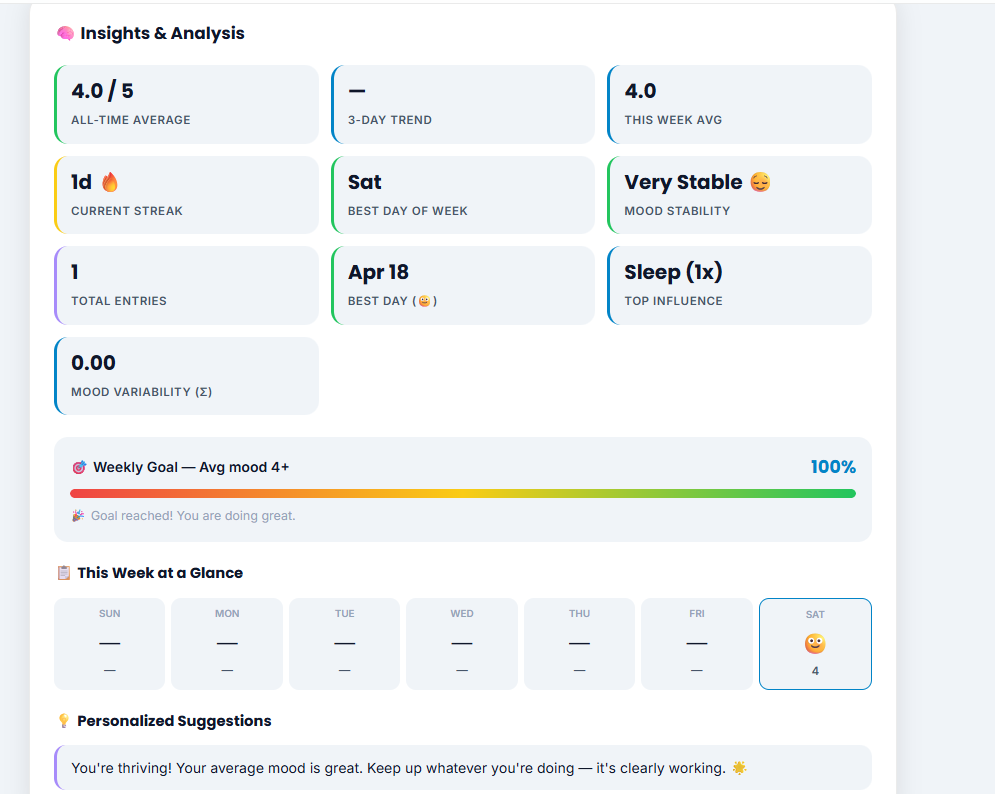
It also identifies patterns such as streaks of good or low moods, overall mood variability, and long-term trends. Users can view their personal mood history as a journal and export all their data as CSV or JSON for full ownership and portability.
Everything runs locally in the browser, meaning there are no accounts, no servers, and full privacy by design.
How I built it
I built MoodMap using only frontend technologies—no frameworks and no backend.
HTML was used for structure, CSS for styling and responsive design (including dark mode), and JavaScript for all logic, state management, and data persistence. For visualization, I used Chart.js to create interactive mood trend graphs.
All user data is stored using localStorage, making the app fast, lightweight, and completely local-first.
To generate insights, I implemented simple analytics such as averages, streak tracking, and trend detection. One key metric used in the app is mood variability, calculated using standard deviation:
$$ \sigma = \sqrt{\frac{1}{N}\sum_{i=1}^{N}(x_i - \bar{x})^2} $$
Challenges I faced
One of the biggest challenges was handling date-based logic correctly, especially when calculating streaks and weekly patterns. Even small mistakes in date handling could break trend analysis, so this required careful debugging.
Another challenge was designing a UI that stays clean and simple while still showing meaningful insights. I had to avoid overwhelming the user while still making the data useful and easy to understand.
Keeping charts dynamically updated as new mood entries were added was also tricky. Ensuring that localStorage remained consistent across sessions required extra attention as well.
What I learned
This project taught me how to build a complete application using only frontend technologies. I learned how to turn raw user input into meaningful insights and how important UI/UX design is in mental health tools.
I also gained a deeper understanding of local-first design and how it improves privacy, performance, and user trust by removing the need for accounts or external servers.
What’s next
In the future, I want to expand MoodMap with daily reminders, more advanced insight generation, and habit or goal tracking features. I’m also considering adding optional cloud sync for users who want access across devices while still keeping local-first as the default experience.
Built With
- chart.js
- css3
- html5
- javascript
- localstorage
- pwa
- responsive


Log in or sign up for Devpost to join the conversation.