-
-
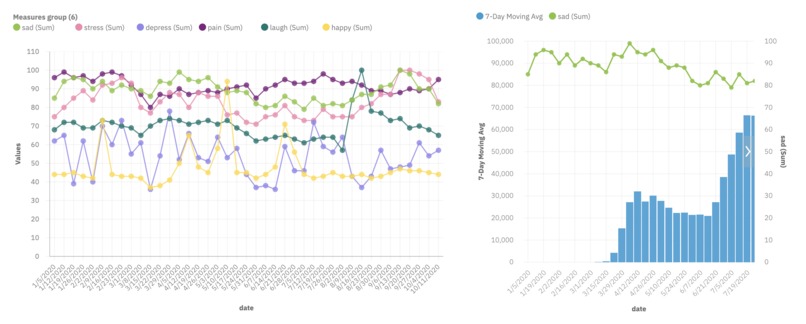
Data visualization using IBM Watson and IBM Cloud Pak
-
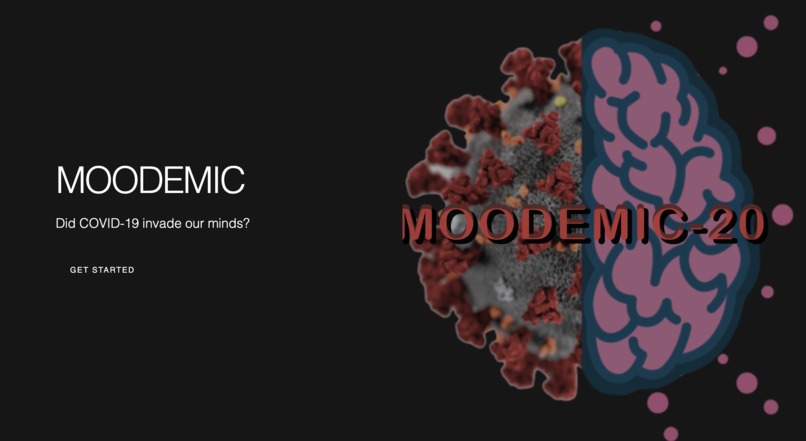
Web starting UI of MOODEMIC


Inspiration
COVID-19 has invaded the Earth. COVID-19 has immensely impacted the society not only physically but mentally. This is commonly referred to as "Corona Blue". While practicing quarantine and social distancing, people started to be mentally isolated, which caused depression, anxiety, and various mental disorders. Our team decided to develop a program that shows the correlation between people's mood changes and COVID-19 cases.
What it does
Our program, MOODEMIC-20, is an analytical platform that compares data from CDC and Google Trend to demonstrate the positive correlation between search terms related to mood swings and weekly COVID-19 positive cases across the US. We used the IBM Watson Studio technique and IBM Cloud Pak for data visualization. Input data were parsed based on articles and public data published on US CDC, Google Trend, and psychology scholarly journals. We then integrated this data visualization in web development to create an agile user interface for viewing the correlation.
How we built it
We first collected data in .csv format and parsed this into JSON format using the IBM Watson and IBM Cloud Pak (IBM API) technology. This enabled the visualization of graphs that best reflect the correlation between mood switches and the COVID-19 pandemic. The axes of the graphs were weekly date and number of positive cases/prevalence of the search terms. The data were pre-processed to match these standards using the IBM technologies, changing the data types using machine learning. The visualized graphs were exported as JSON files and then integrated into our web platform built with JS, node.JS, HTML5, CSS, and chart.js. VSC software was used to build the UI of the web and Figma software was used to create graphical representations.
Challenges we ran into
Collecting data with proven authentication and accuracy was a big challenge we encountered at the beginning of our project. For example, there were numerous data sets related to COVID-19 in the field but they were slightly different from one another. It was hard for us to find the data-set that best aligned with the goal of our project. We decided to use the COVID-19 data-set from CDC.gov based on the CDC's credibility and ethos. For diagnosing the increasing depression rate within the society, we decided to use search history data archived in the biggest search engine in the world, Google. Data achieved from Google's search terms could most accurately represent the society's up to date changing moods affected by COVID-19.
Accomplishments that we're proud of
This was our team's first time utilizing IBM's public API. Within the limited time of the hackathon, we were able to explore and adapt to IBM's Watson and Cloud Pak technology. We could also extend our knowledge to visualizing the wanted local data using this technique.
What we learned
Our team learned to efficiently connect the third-party sources (such as API) to local data and codes in order to get an output we wanted. We went through the step of collecting, processing, and visualizing data while making such a connection.
What's next for MOODEMIC-20
We will automate the process of collecting data from public APIs to provide real-time analysis and visualization. We will also utilize deep learning experiments and AutoAI learning experiments features of IBM Watson studio to provide expected mental related data.


 Yie")
 Yie")
Log in or sign up for Devpost to join the conversation.