-
-
Home Page
-

ema Survey
-
Tracker
Inspiration
Core Idea - Ecological Momentary Assessment (EMA) is a new trend in clinical psychology – instead of collecting conscious responses, some researchers would like to study people’s unconscious thoughts that could play a significant role in shaping maladaptive or adaptive behaviors and leading to different mental health stages. Therefore, we want to build a mobile app that can collect users’ momentary feelings (based on the PANAS – Positive and Negative Affect Schedule questionnaire) at random times throughout the day by sending notification reminders, enabling users to become aware of any consistent, overwhelming feelings and learn to better embrace and manage their emotions. This application can also contribute towards research by creating a database (with user permission) for EMA PANAS data from a large and consistent user population, saving researchers the time and trouble of having to recruit new participants for every study, which is not only costly but also introduces the risk of sampling bias. The whole idea of collecting momentary thoughts is manifested in our questionnaire page.
App Design
Our current app design has four main interfaces: a home screen, a questionnaire page, a calendar feature to store past data and track user progress, and a tips page to provide more helpful resources.
Referring to apps such as Forest and Plant Nanny, the team is inspired to create an animation that visualizes different stages and track progress to better motivate usage of the app. Inspired by the popular movie Inside Out 2 for this year (2024), we want an icon that has various fluctuating ‘states’ to symbolize our app, and the weather is a good fit while weather conditions also match the idea of how emotions work around our behaviors as an environmental factor. Thus, we chose a cloud as our animation figure and designed the interface of our main screen to resemble a weather forecast app.
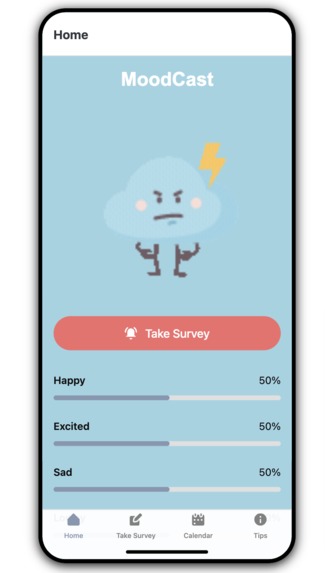
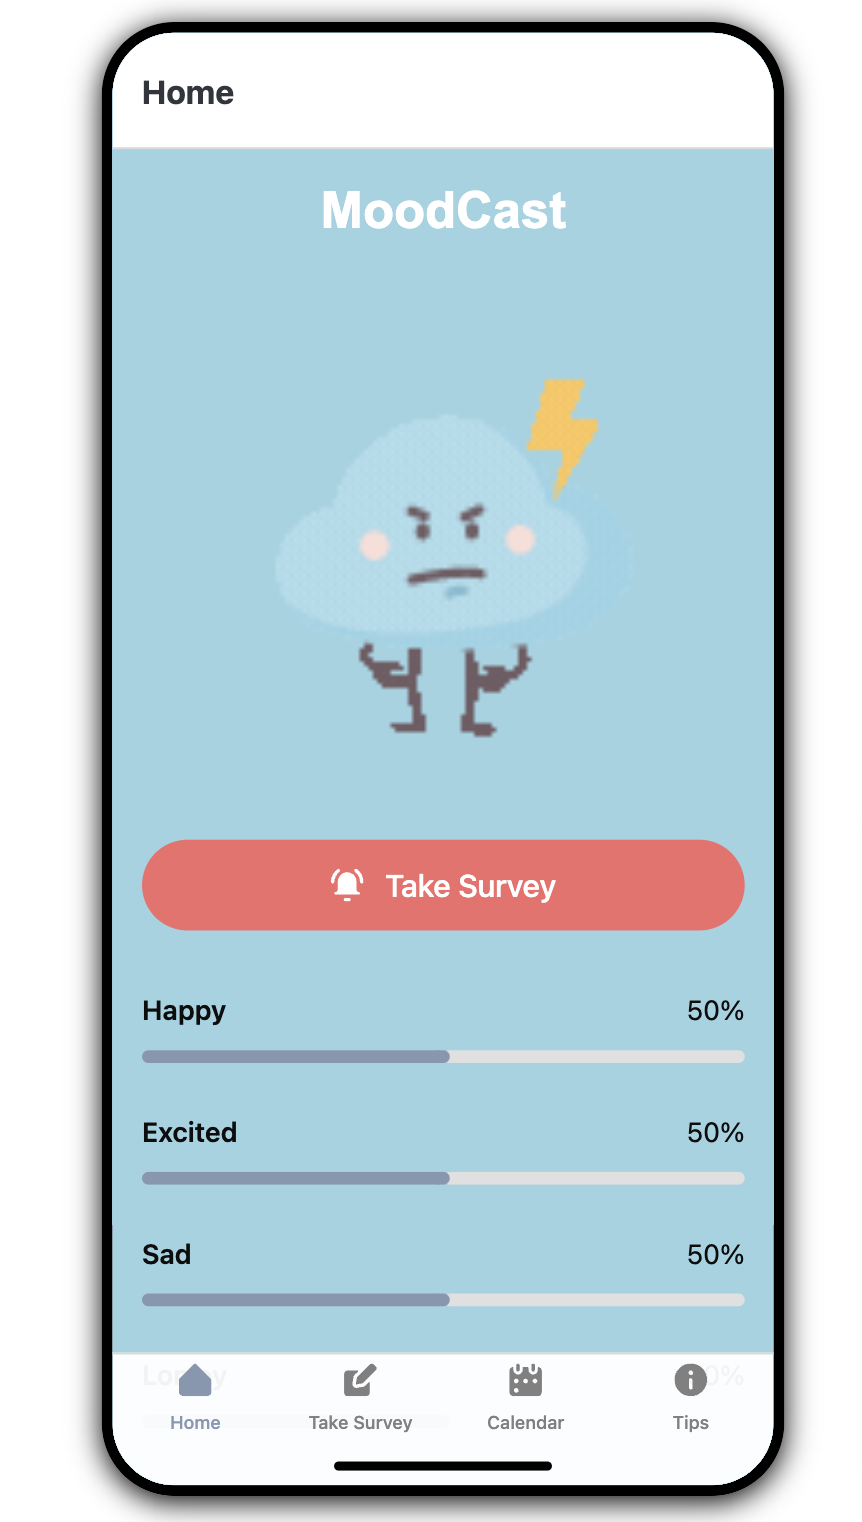
Home Screen Page
The app opens to first display our “Home” screen, with our app name “MoodCast” and cloud animation figure in the upper half of the screen. While only one animation is currently supported, we want the cloud figure to display different weather conditions based on the user’s feelings in their last survey response, thus making the app more personalized and interactive. The bottom half of our user interface also displays detailed statistics of the user’s emotions over a time period (such as the last seven days) as a percentage of each of the eight emotions recorded in the survey, ordered from highest to lowest, enabling users to view at a glance the general trend of their emotions recently in a simple and appealing summary. Furthermore, a red “Take Survey” button in the middle of the home screen redirects users to the questionnaire page when clicked, which not only streamlines the usability of our app but also reminds users to take the survey and update their current emotions status. Then a green “Done” button will tell the user that they have already completed the survey for the current time session to avoid redundant responses.
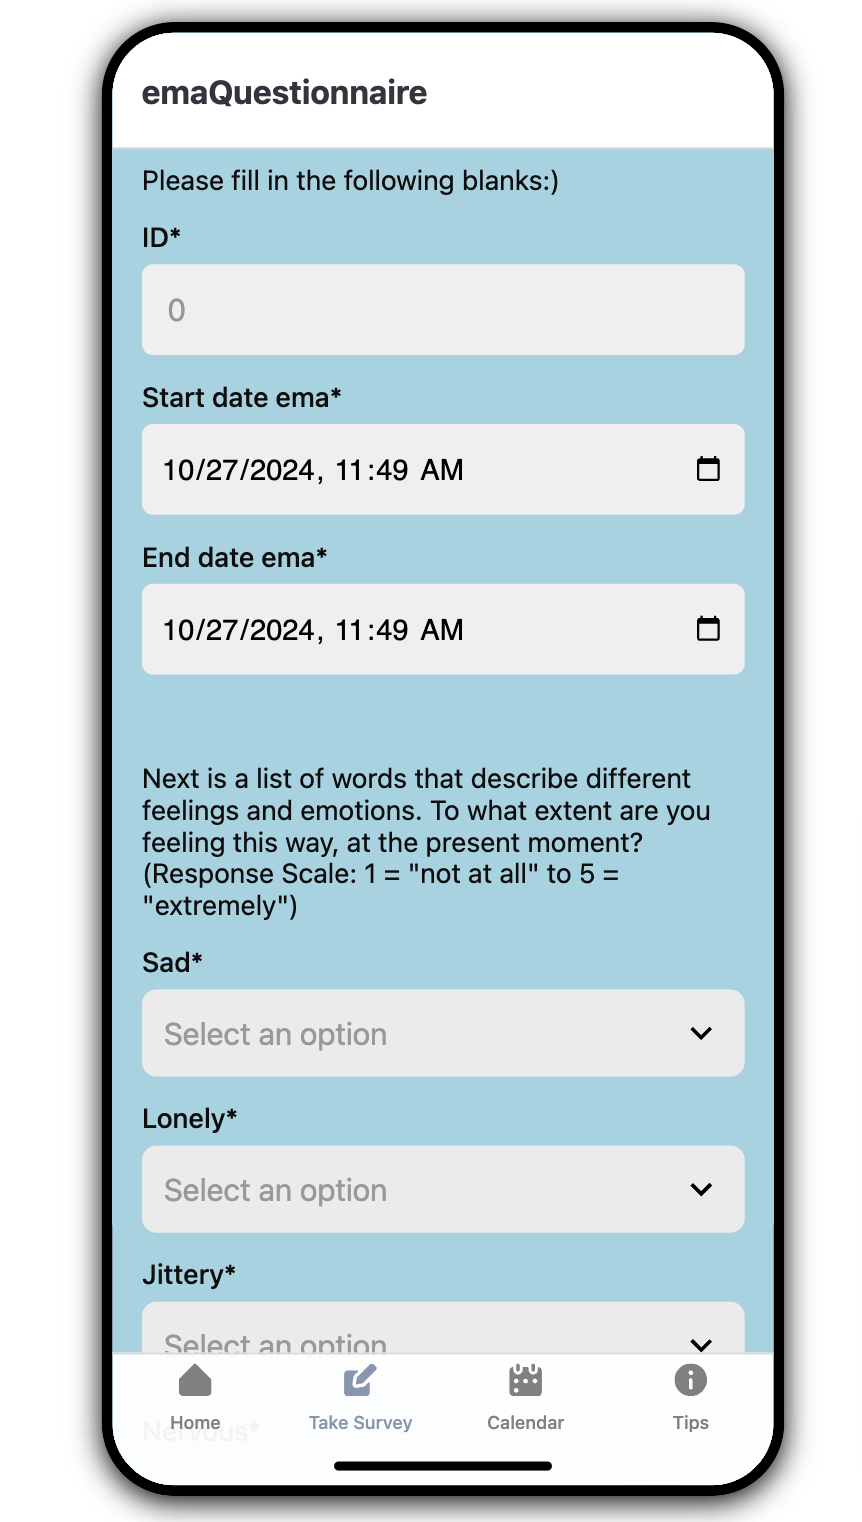
Questionnaire Page
Next, the questionnaire page, titled “Take Test” in the tab bar, is where users will answer questions to fill out the EMA PANAS survey. The survey is composed of eight Likert-style items asking users to rate how well their current feelings can be described by different emotions from a dropdown scale of 1 (not at all) to 5 (extremely). It also asks for users to confirm their User ID, as well as the date and time of when they’re completing the questionnaire to enable data collection and facilitate future reference. In the future, we hope to automize the collection of these data by having default values retrieved from the user’s login information and the system time of the user’s device. We also want to have a reminder system that sends out notifications to ‘nudge’ users to take the survey, further encouraging user engagement and enhancing data validity by sampling at random times throughout the day (i.e. not influenced by the tendency of some users to answer the survey when they are in a specific mood only, thus biasing results). While our current program focuses more on designing framework and enhancing usability instead of coding, BeReal is the app that exemplifies our idea of sending out random notifications for users’ check-in.
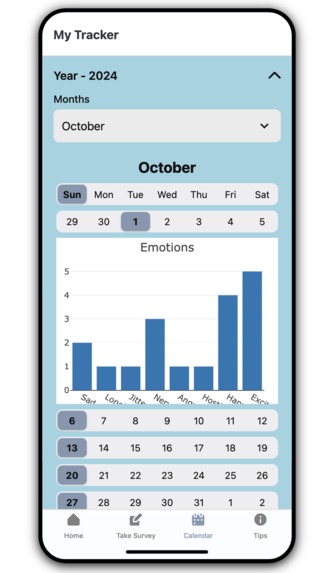
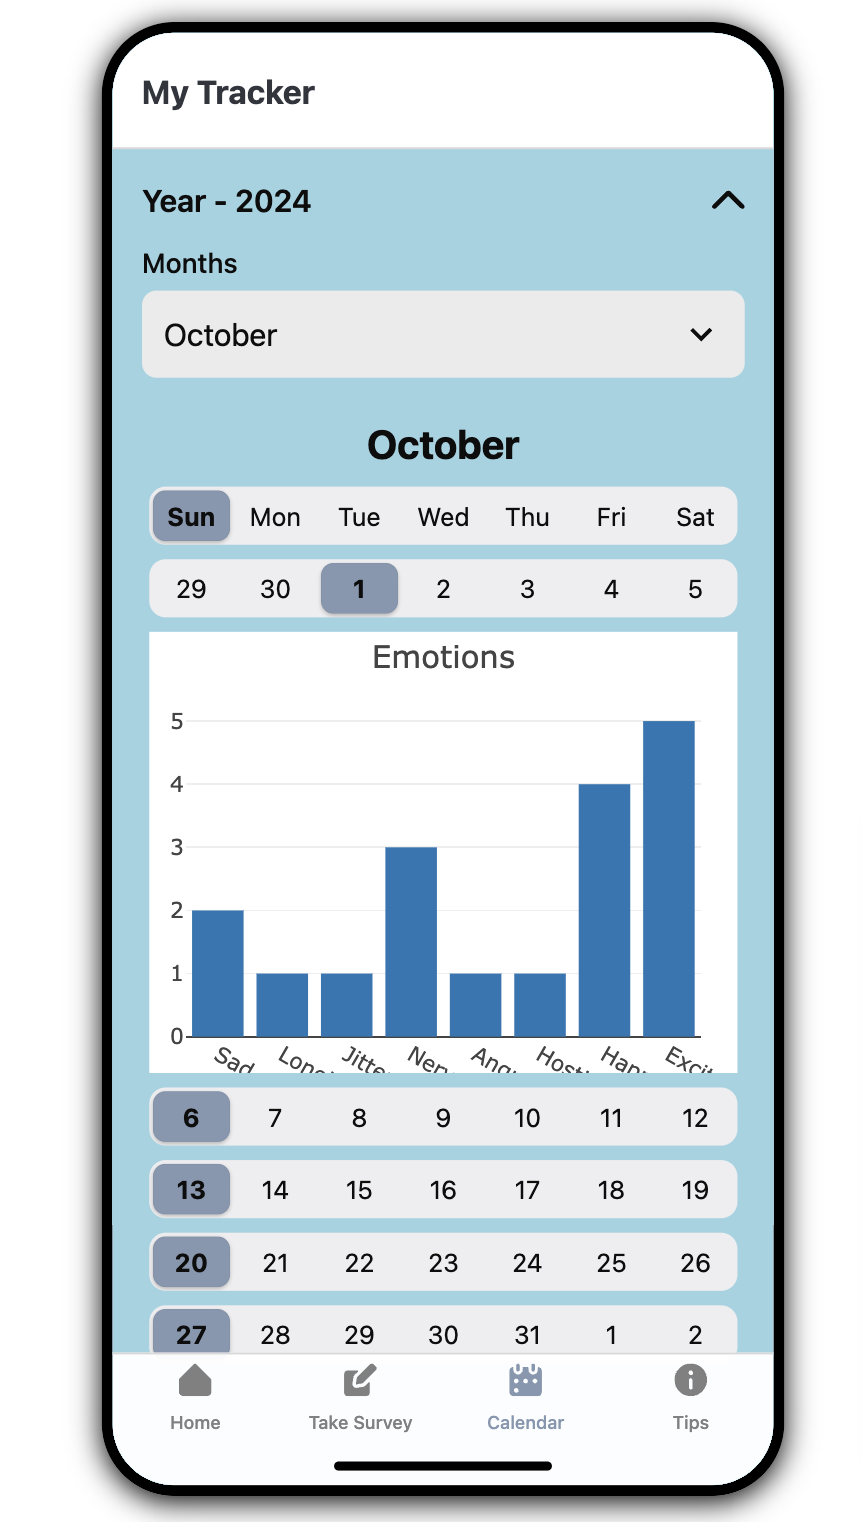
Calendar Page
We also add a “Calendar” interface for users to review their past responses and statistics, just like reading a personalized ‘mood diary’. The top header specifies the current year “2024” and a dropdown below it from “January” through “December” allows users to select the month they want to view. After they’ve made a selection, a corresponding calendar for all the days in that month appears on the screen, and users can click on each date to view their past statistics for that day as a “pop-up” display. In the future, we also want to display summary statistics for a time period of the user’s choice (e.g. mean values for each emotion across a period of time) and graphs tracking changes in their emotions over time. One challenge we encountered when implementing the Calendar feature is that Retool, the platform we’re using to build our app, doesn’t have a calendar component for mobile apps ready for use. We also tried building a calendar in HTML and JavaScript, but that also didn’t render properly because Retool doesn’t seem to support custom or inline CSS for mobile app development. As a workaround, we used horizontal tab components to mimic the appearance of a calendar for each month and linked each tab to show a “pop-up” display for the data of that date. For now, we’ve only made the complete interface for October 1st and 2nd as example demonstrations, but calendar displays for other months and dates should look similar.
Tips Page
Last but not least, we incorporated a “Tips” tab with information on advice to improve one’s mental well-being based on different conditions, and also resources on where to seek professional help.
Future Implications
Momentary mood tracking is the core idea for the our app, but we are looking forward to expanding the questionnaires into other well-being fields. For example, one of our teammates is currently studying ADHD in her research, and studies have found that ADHD symptoms are associated with avoidance and inattention in the moment (Knouse et al., 2023). Therefore, we can combine questionnaires examining momentary avoidance and inattention into our app in the future that allows not only ADHD users but also people who are not diagnosed but are suspicious of having ADHD keep track of their symptoms. Any other mental health related momentary features, such as automatic negative thoughts that are associated with depression, are considerd in future development of our app. Our ultimate goal is to give users insight on their well-being through visualization that only requires several 10-seconds snap shot on their current feelings and thoughts across the day.
References
Knouse, L.E., Ziegler, M., Lavine, I., Zhang, J., Cheng, Y. & Ul Ain, H. (2023). Avoidant automatic thoughts are associated with task avoidance and inattention in the moment. Cognitive Therapy and Research. Advance online publication. https://doi.org/10.1007/s10608-023-10410-8
Built With
- retool

Log in or sign up for Devpost to join the conversation.