-
-
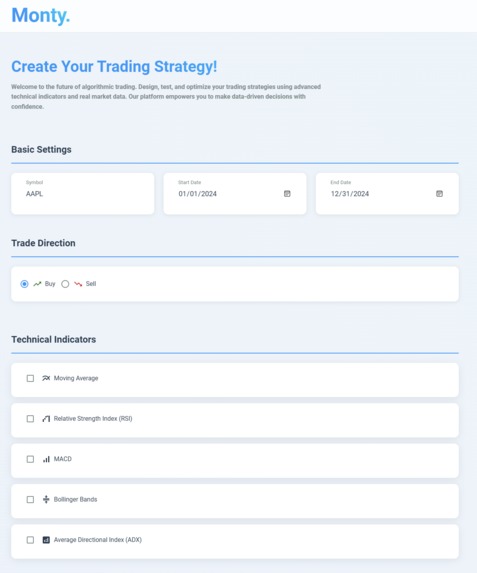
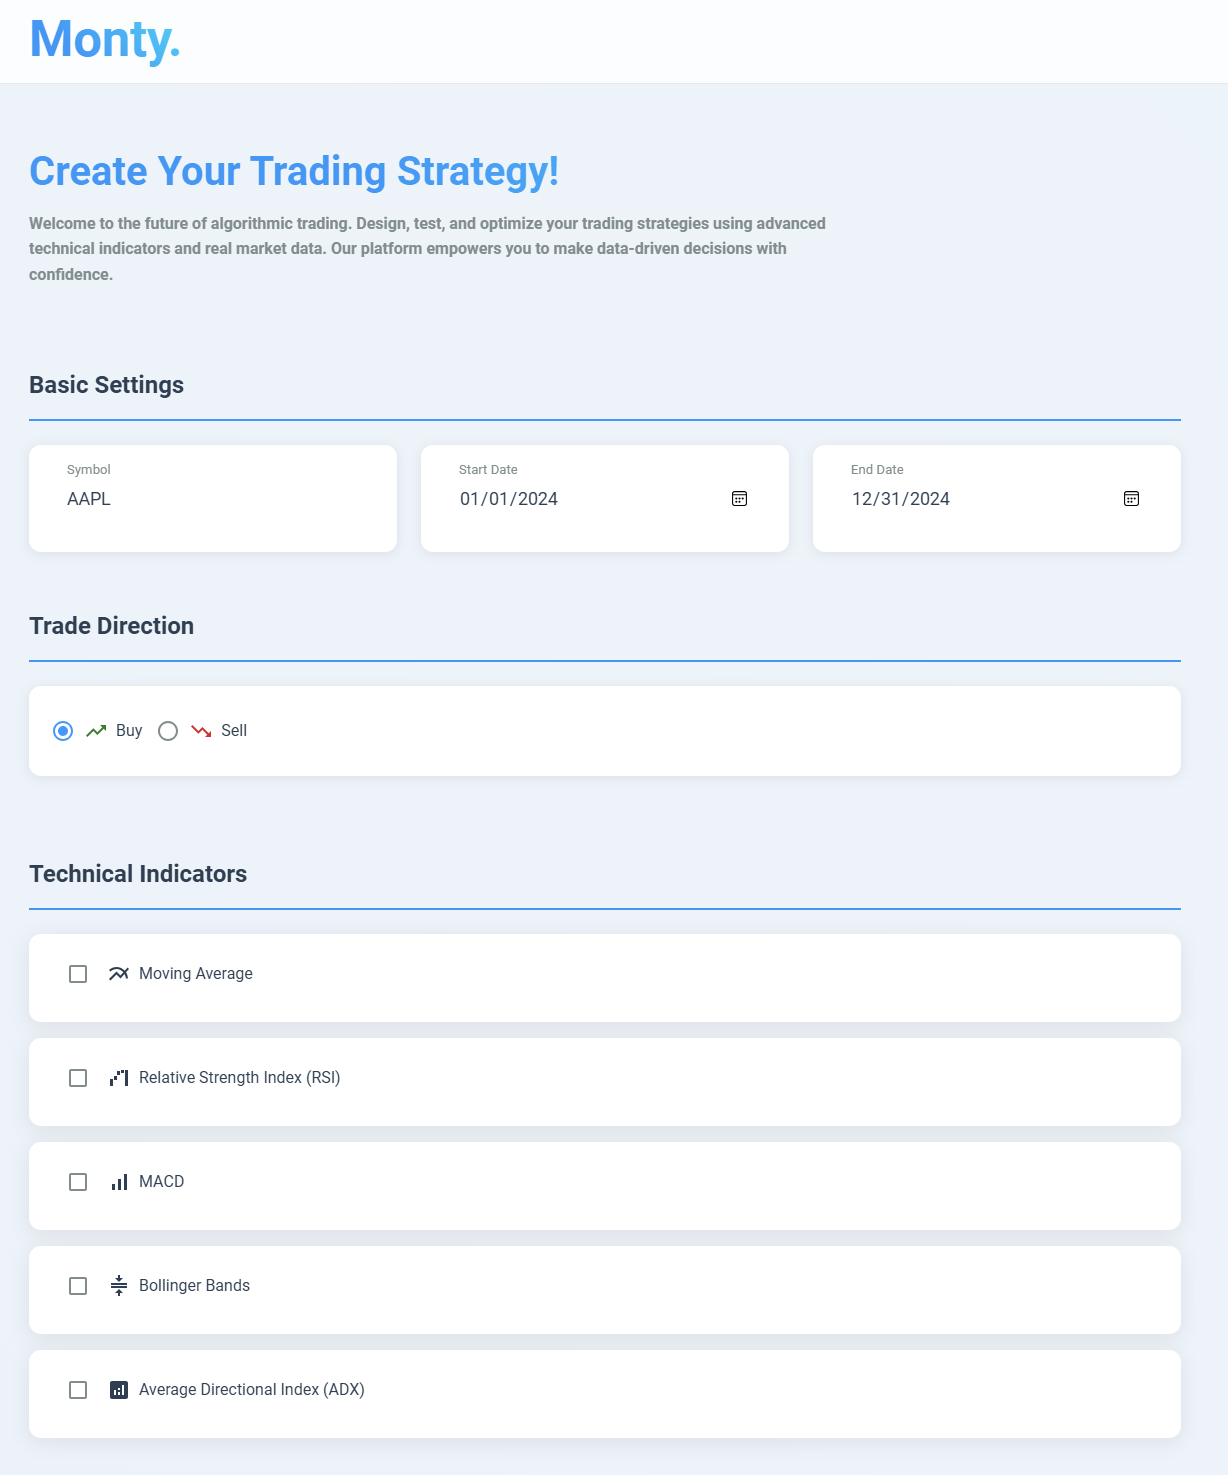
Homepage
-
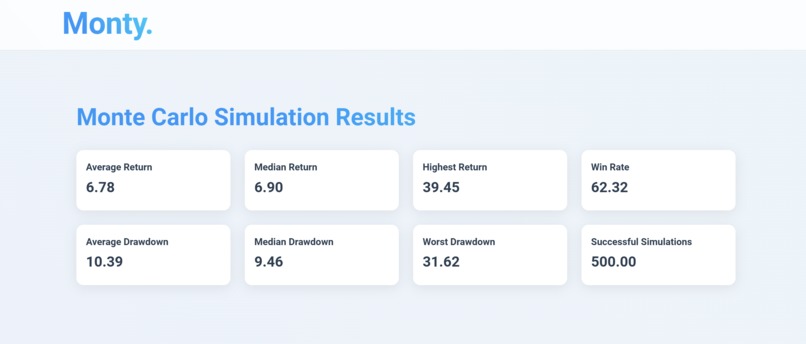
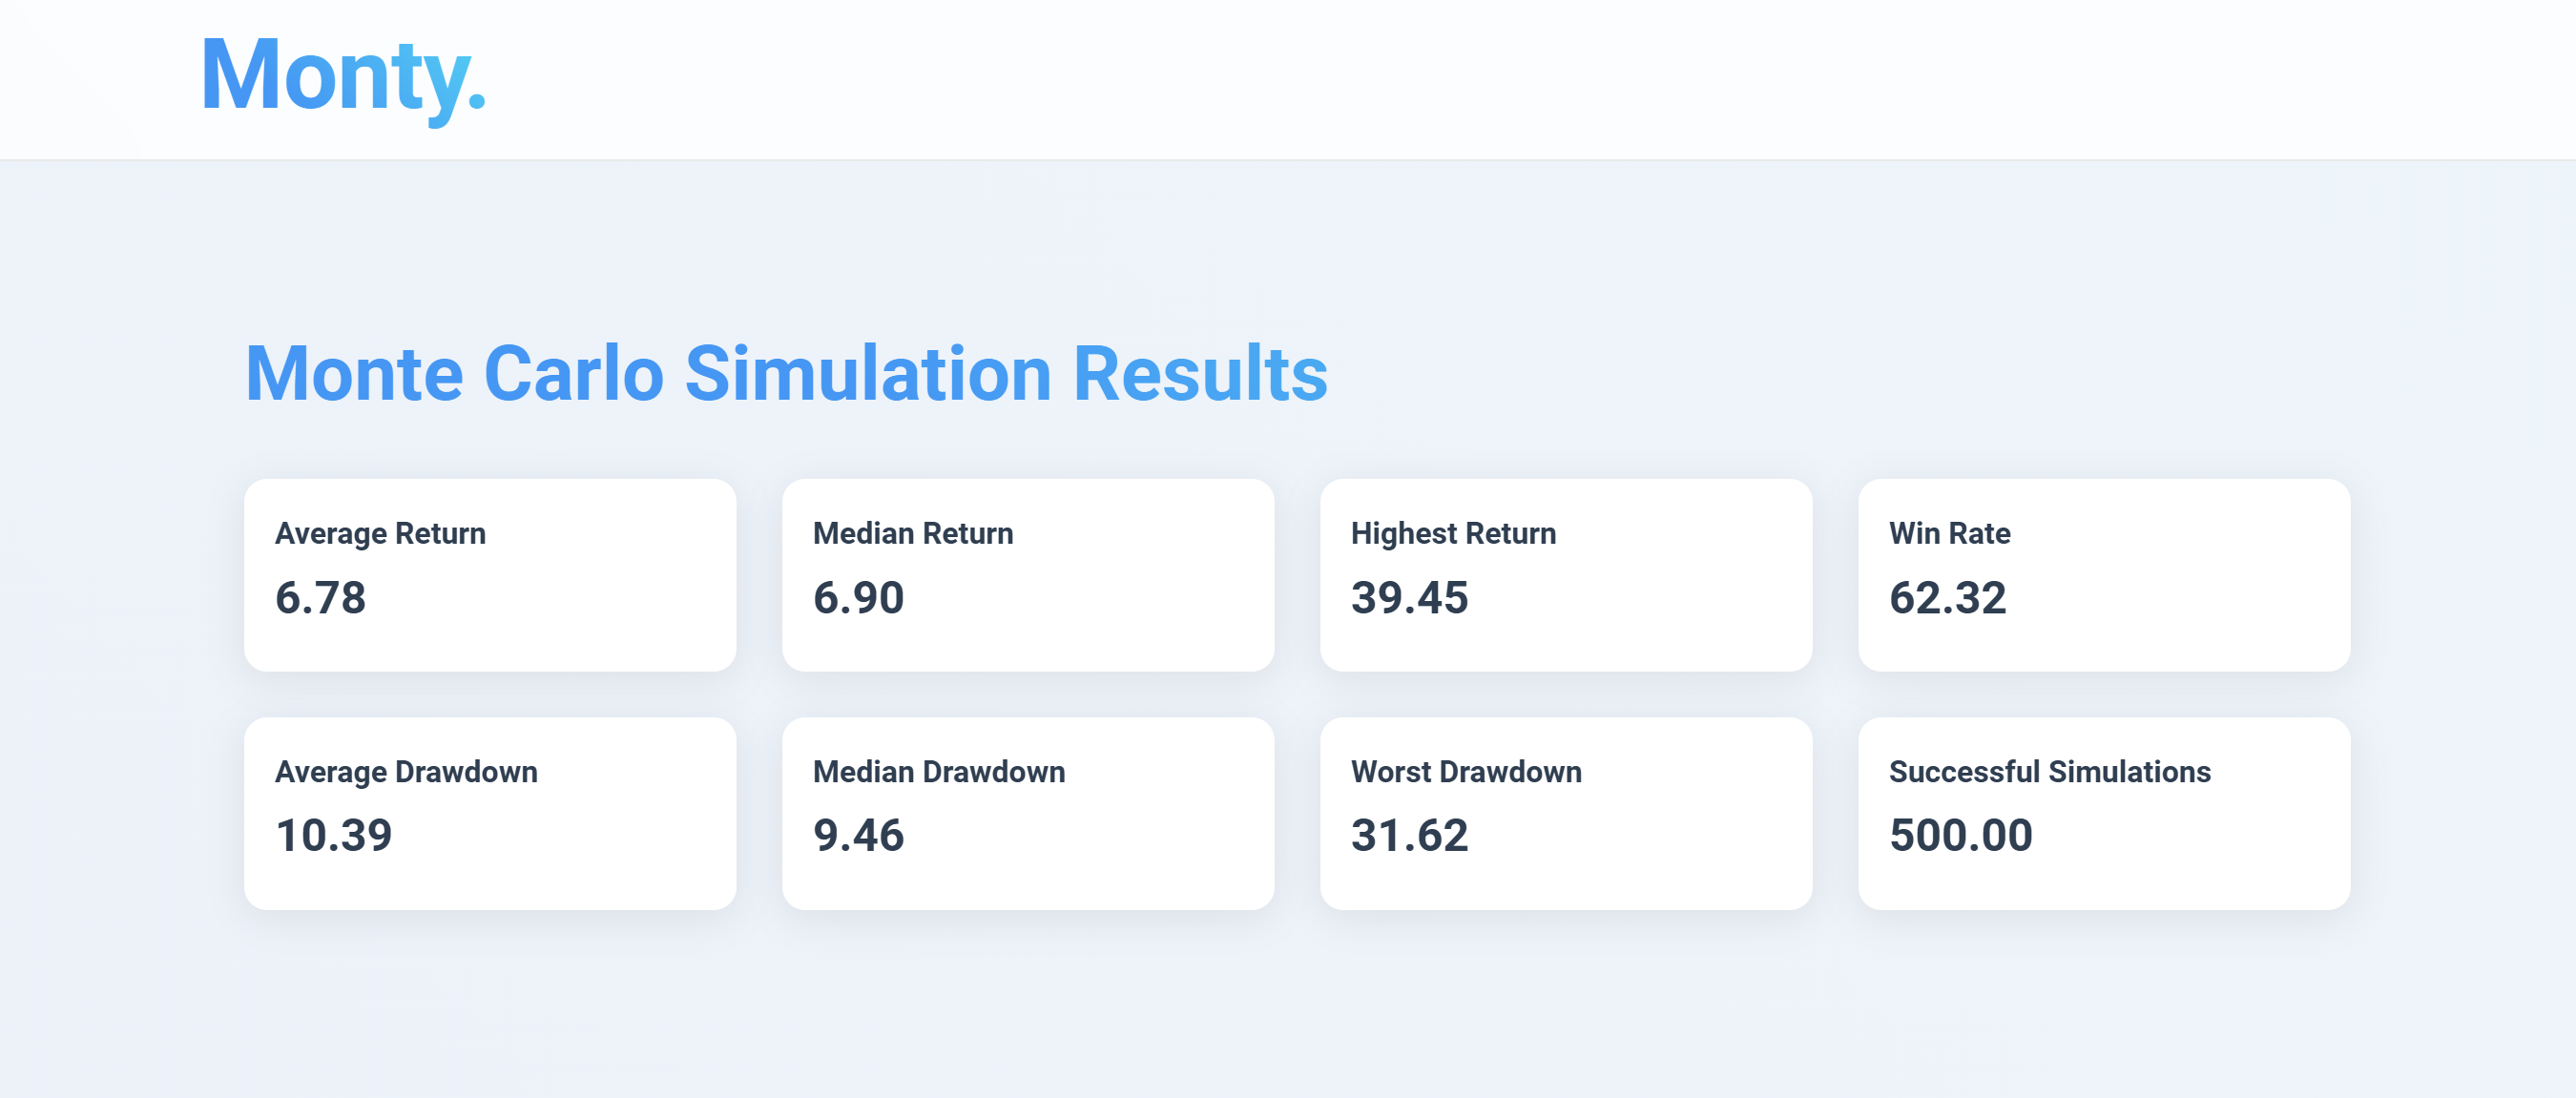
Monte Carlo Results for a hypothetical algorithm
-
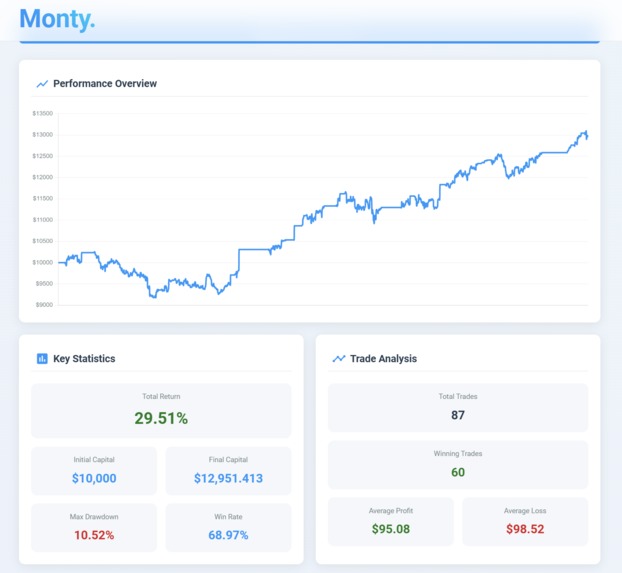
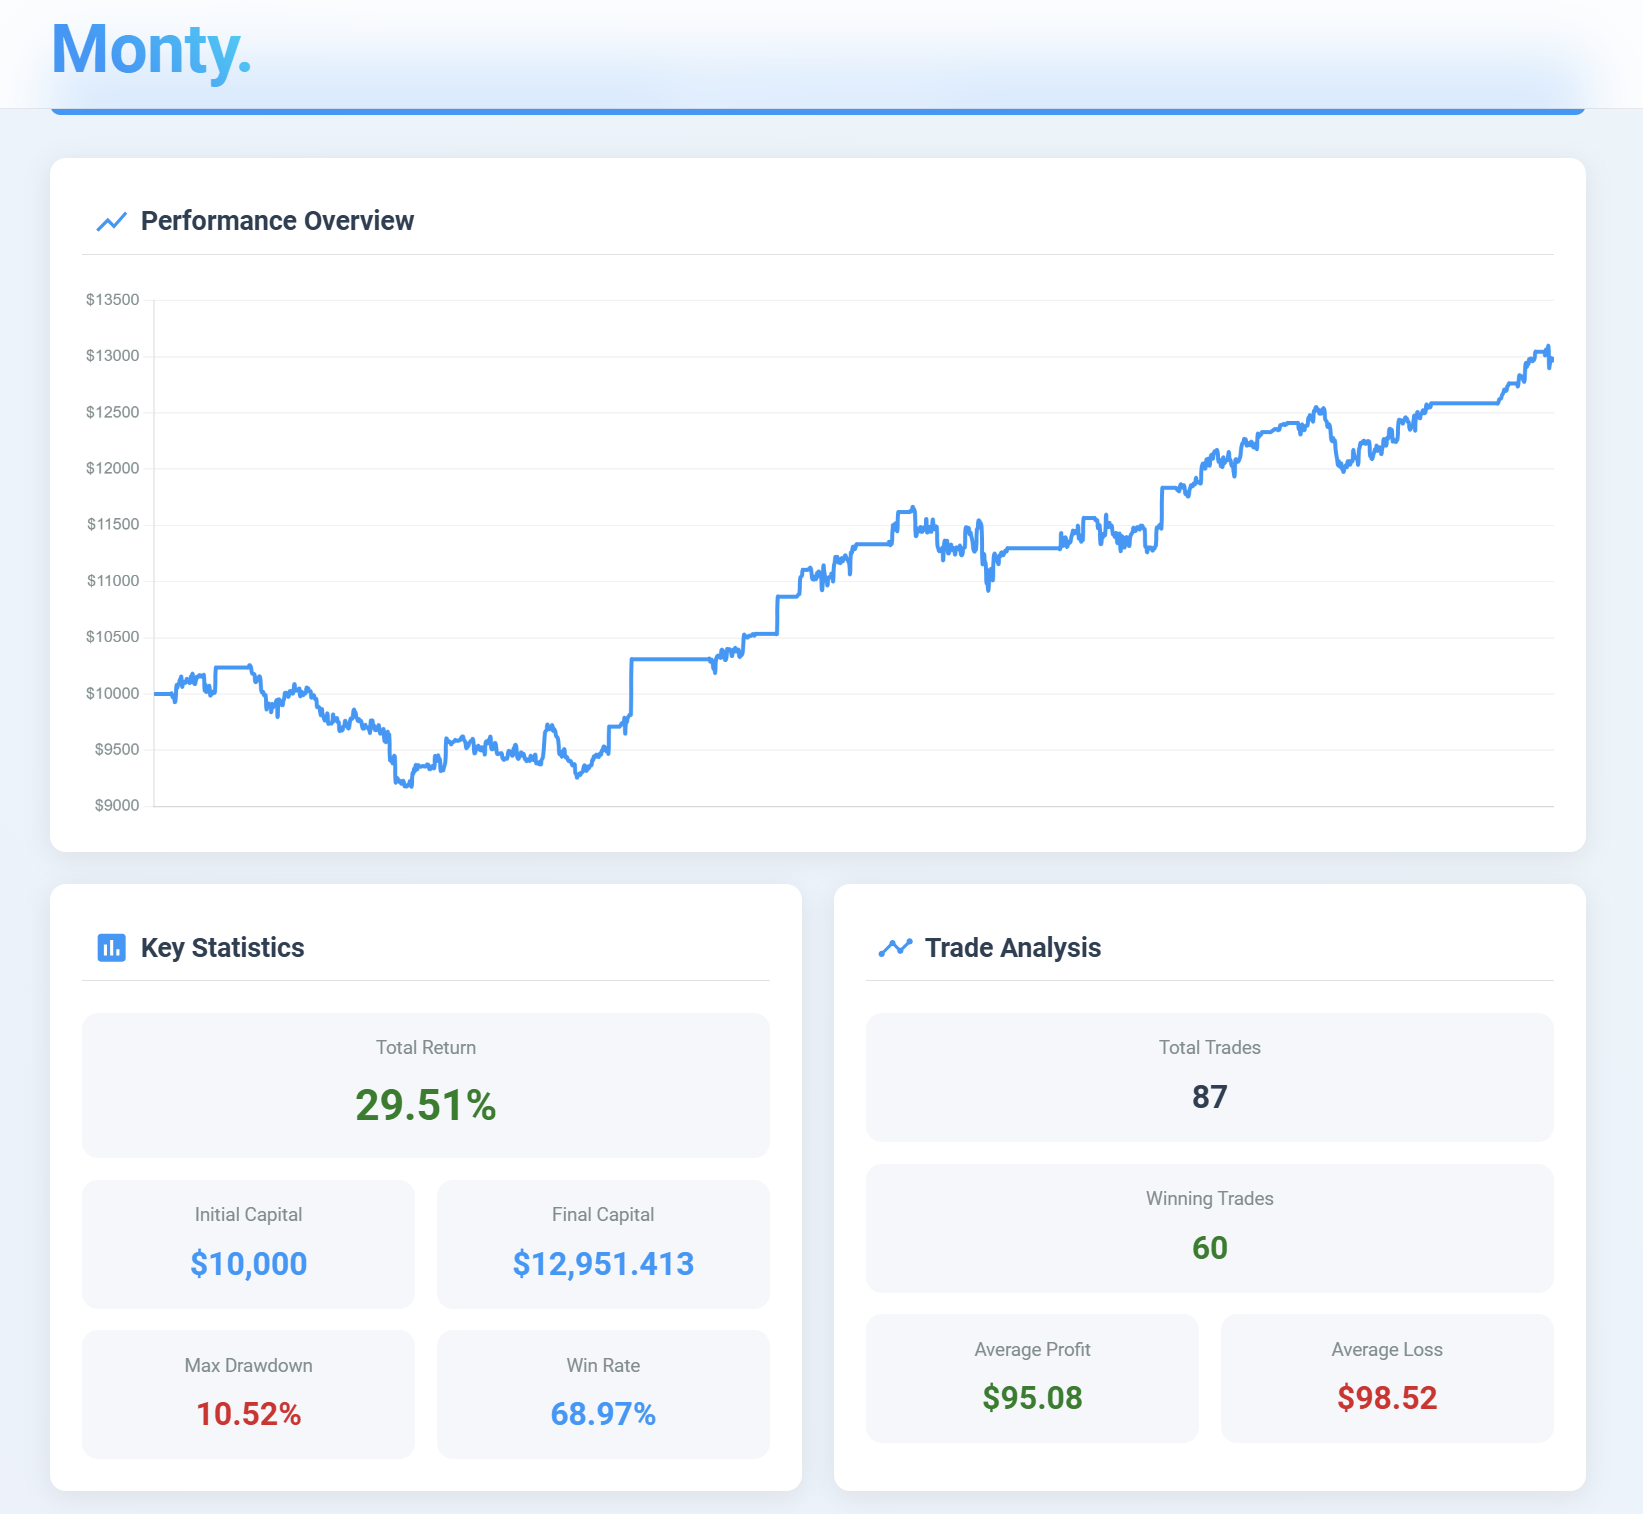
Analysis of the stock algorithm that the user entered
-
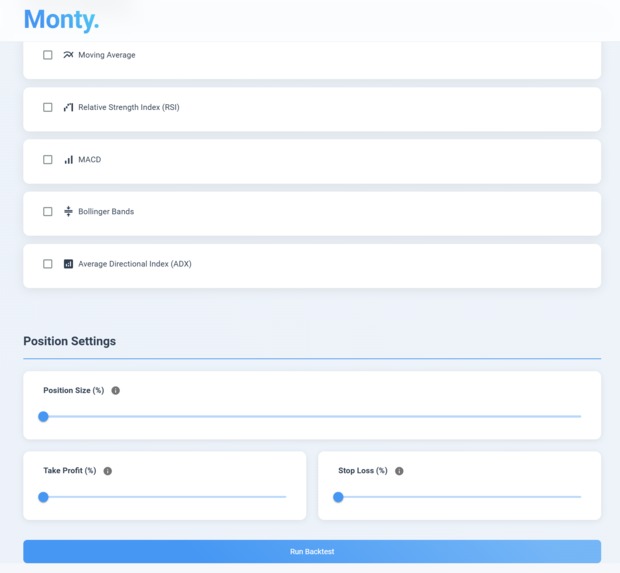
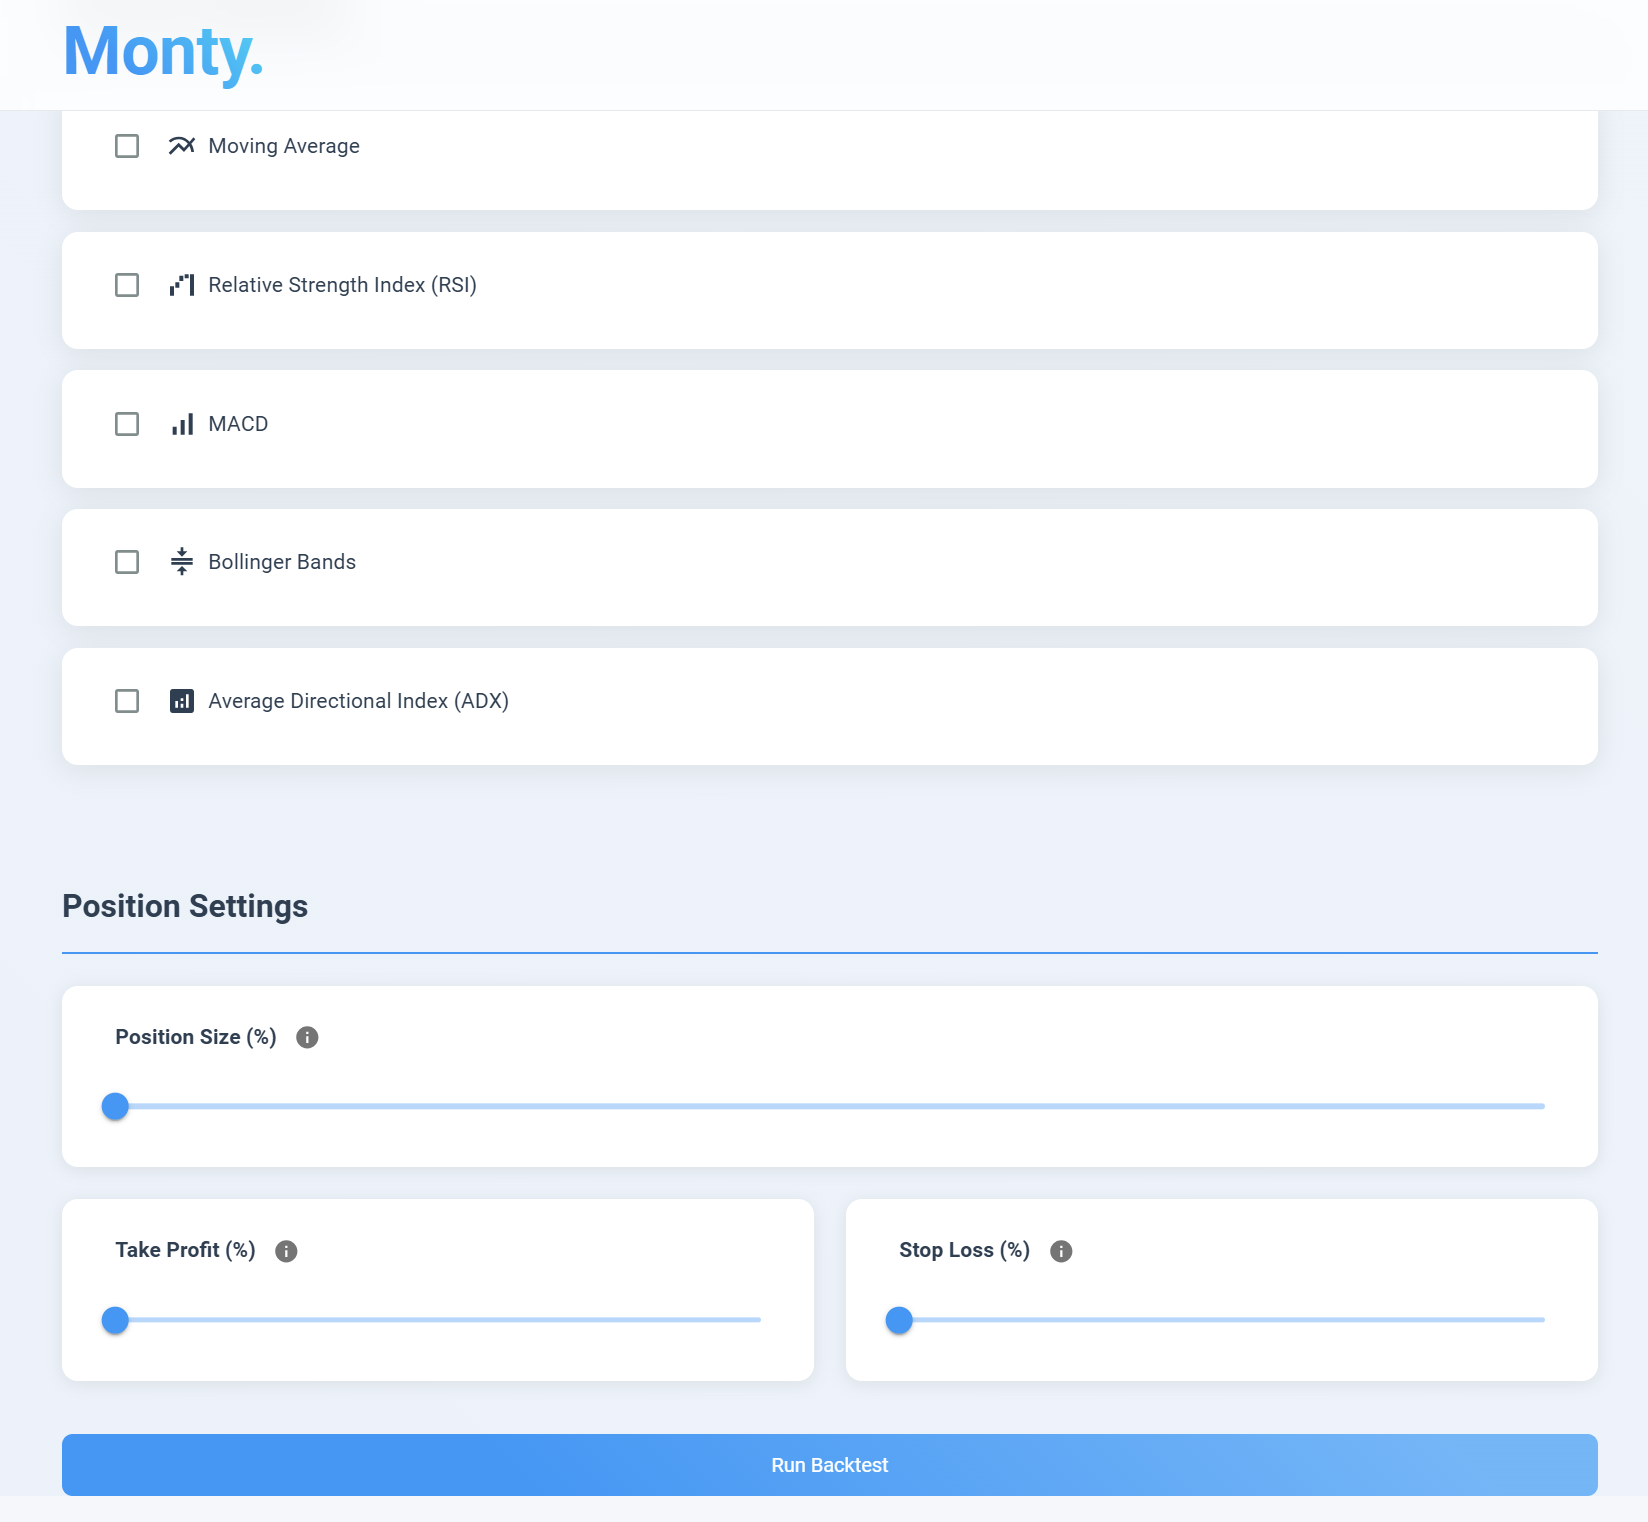
Position Settings for the user algorithm
-

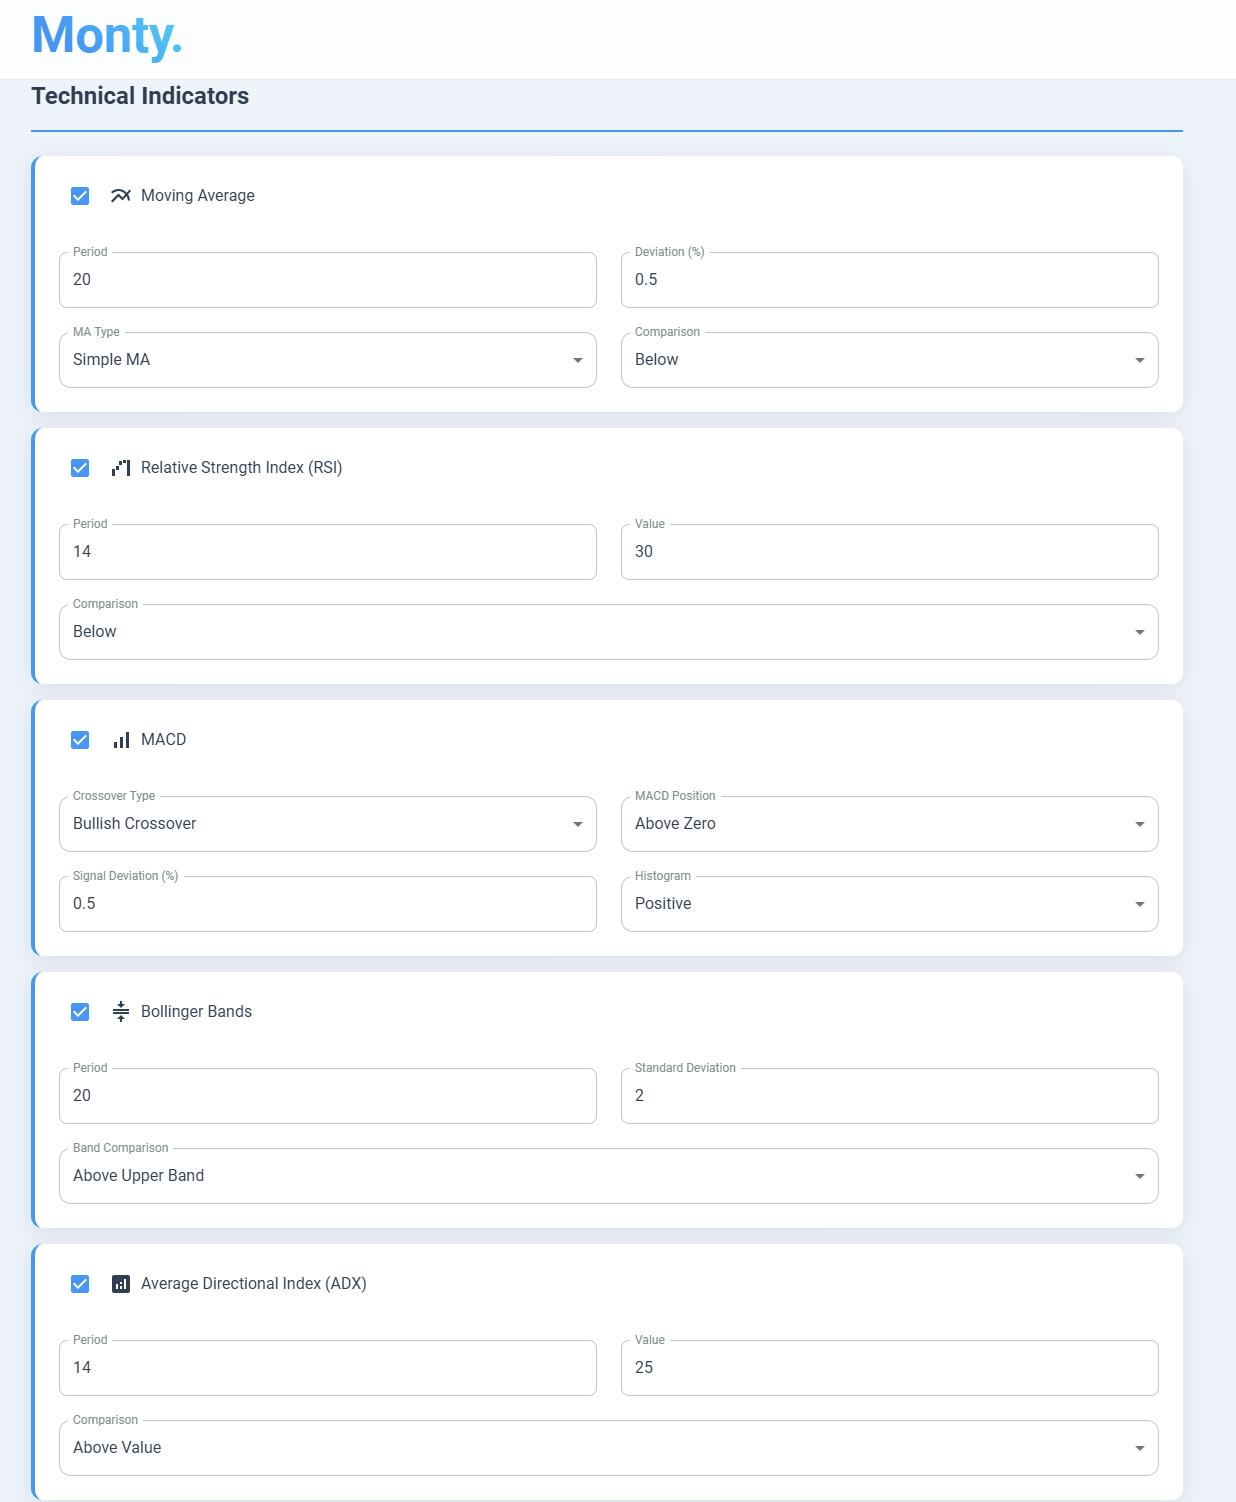
Technical indicators for the position
-
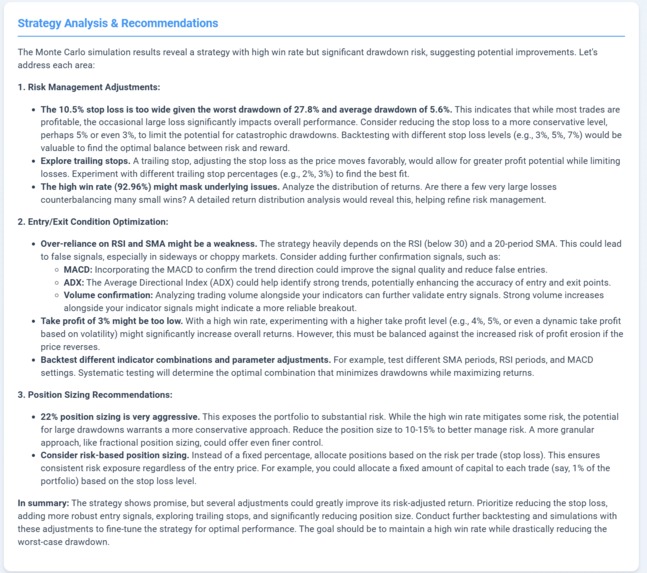
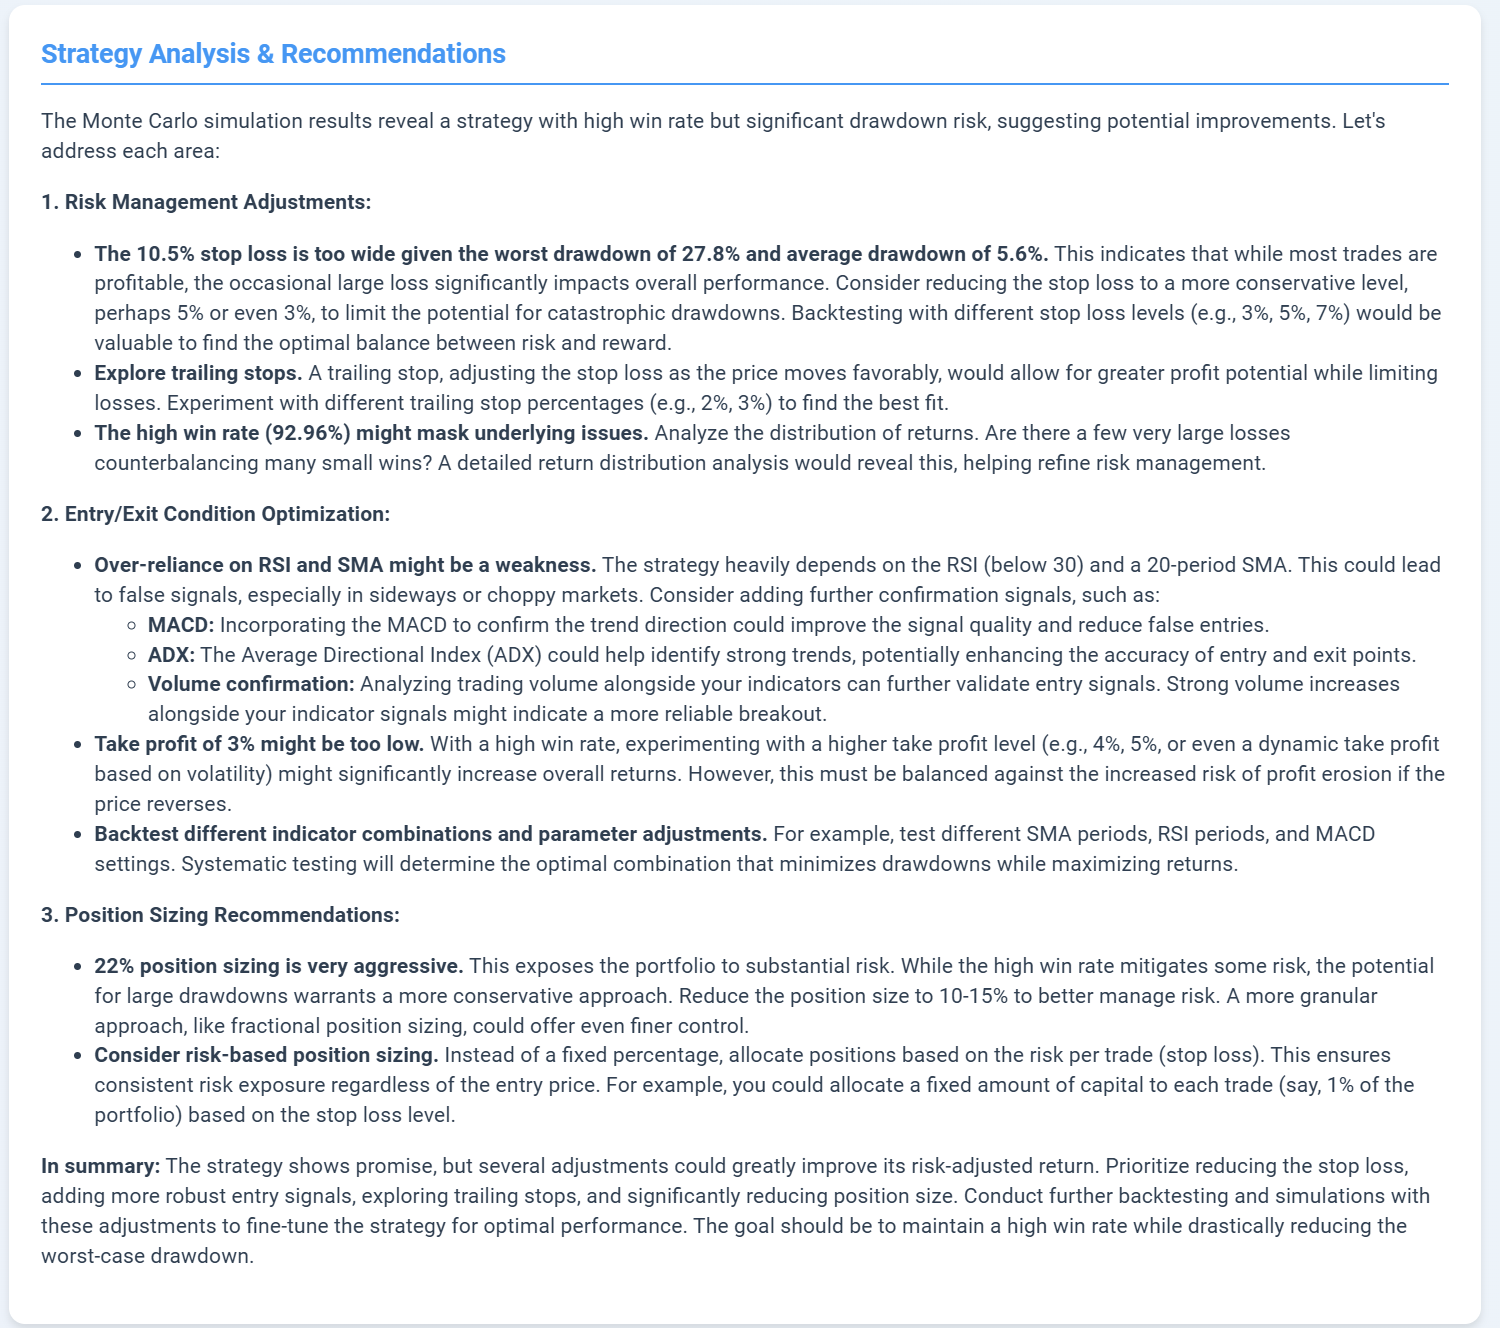
Feedback on the algorithm chosen (using the monte carlo predictions)
Inspiration
The inspiration behind this project was essentially a tool for users to implement their own algorithms to help them conduct trades on the stock market. We wanted to design the app so that the user could choose certain parameters for entering and exiting a position, and back test their algorithms based off of not only past market data, but also simulations of the market using Monte Carlo simulations.
What it does
The app allows users to experiment with different stop and end conditions for a position. The app allows users to set these conditions based off of a variety of technical indicators, such as the RSI, SMA, EMA, MACD, and Bolinger bands. Once the user inputs these parameters, along with a certain time interval to analyze the stock between (for historical analysis), then the app will calculate the trades that the user would make according to the algorithmic decisions that they themselves wanted. The user can then use this information to decide how they want to evaluate their own algorithm, depending on what they were going for. Before this app, this process had to be done manually, and users would have to evaluate the accuracy of their algorithms by going through what they think would happen in the market. Now, with automating Monte Carlo and historical context, this process can be streamlined and done in an efficient manner.
How we built it
To build the app, we used Python, JavaScript, and HTML with our tech stack of React and FastAPI. We also integrated the Polygon API and yFinance for indicator and stock data, and we also use the NVIDIA NIM API to integrate an LLM to provide suggestions for improving the strategy. We also deployed the project using AWS.
Challenges we ran into
The main challenge that we ran into was when we had to integrate the backend with the frontend for not only the technical indicators, but also the Monte Carlo portion of the project. When integrating the technical indicators with the front end, we ran into many CORS issues, as well as issues with the data not being correctly parsed in JSON format. On top of that, we initially attempted to use a different API, polygon, to implement the historical data comparison for the technical indicators. However, the fact that the polygon API only allowed 5 calls per minute prevented us from doing a lot, so we had to use the yahoo finance API. Additionally, for the Monte Carlo simulation portion, there was an issue connecting the output with the rest of the project, so we had a lot of trouble with that.
Accomplishments that we're proud of
We are proud that this is a fully functional, deployed web app that can provide real benefits to stock traders. It allows traders to create real, working strategies with minimal effort and see how effective their strategies are. We are also proud of the creative aspect of Monty, in which we are integrating Monte Carlo simulations and testing the custom strategies on potential future stocks. We are also proud of the idea of implementing an LLM to improve the strategies, as the LLM can analyze how the strategy performed on the Monte Carlo simulation and propose more effective strategies. We’re also proud of our clean, robust tech stack using React and FastAPI
What we learned
What we learned in this project is how to integrate financial data and LLMs into a full-stack project. We first learned how to connect a frontend UI to the backend FastAPI, and then learned how to develop a custom FastAPI which utilizes libraries and other APIs to return custom data. We learned how to get the FastAPI to communicate with our React server properly to display all of this processed data.
What's next for Monty
In terms of what's next for Monty, we are planning on integrating additional technical indicators. Additionally, we want to refine the UI of the frontend by making it more interactive. Enhanced interactive elements would make more features for users to conduct. Finally, we want to ensure that the Monte Carlo simulations are more accurate in the future so that users can more accurately predict their trades. More importantly, we have strong desire to implement a feature that would enable the user to select their own time stamp, as opposed to being limited to analyzing the average price of a stock on a day.
Built With
- amazon-web-services
- cloud
- cors
- fastapi
- javascript
- matplotlib
- montecarlo
- node.js
- pandas
- polygonapi
- python
- react.js
- restapi
- uvicorn
- yfinance

Log in or sign up for Devpost to join the conversation.