

Inspiration
I was trying to find a way to keep track of my monthly expenses and make sure I was not overspending.
What it does
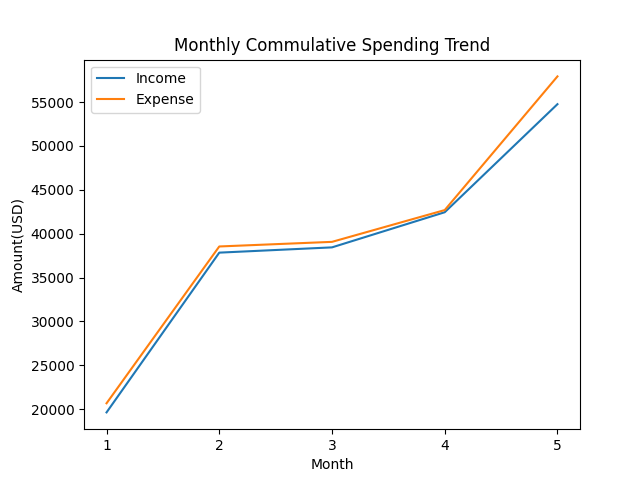
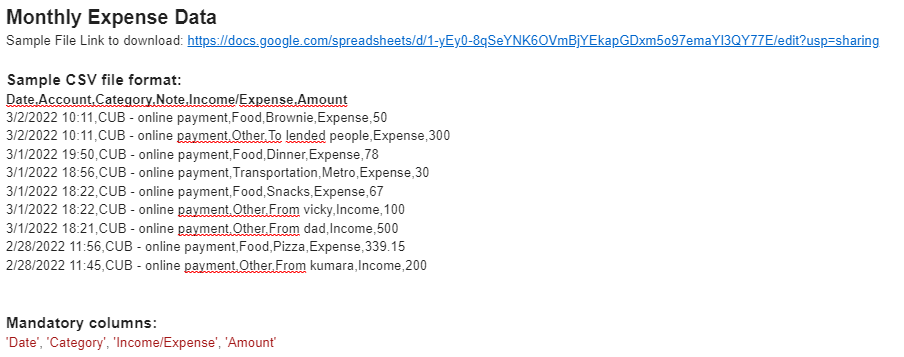
This code reads in a CSV file of monthly expenses and then creates three different graphs. The first graph shows the total income and expenses for each month. The second graph shows the cumulative income and expenses for each month. The third graph shows the total expenses for each category.
How we built it
This project is built using the Python programming language and the matplotlib library.
Challenges we ran into
I had some trouble getting the matplotlib library to work on my computer. I also had some trouble formatting the CSV file so that it would be read in correctly.
Accomplishments that we're proud of
I'm proud of being able to create the three different graphs. I'm also proud of being able to format the CSV file so that it would be read correctly. Also. I am proud that I finished this hackathon and learned something new.
What we learned
I learned how to use the matplotlib library to create data visualizations. I also learned how to format CSV files so that they can be read in correctly by Python.
What's next for Monthly Expense Calculator
I would like to add more features to the code, such as a way to input income and expenses for multiple years. I would also like to add a way to input income and expenses for multiple people.


Log in or sign up for Devpost to join the conversation.