-
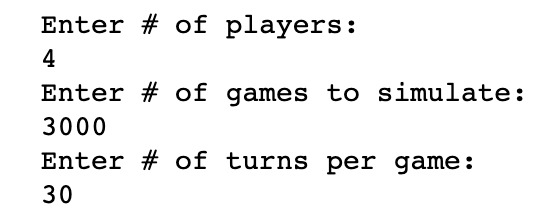
This is the standardardized input that we used to debug and work with our data.
-

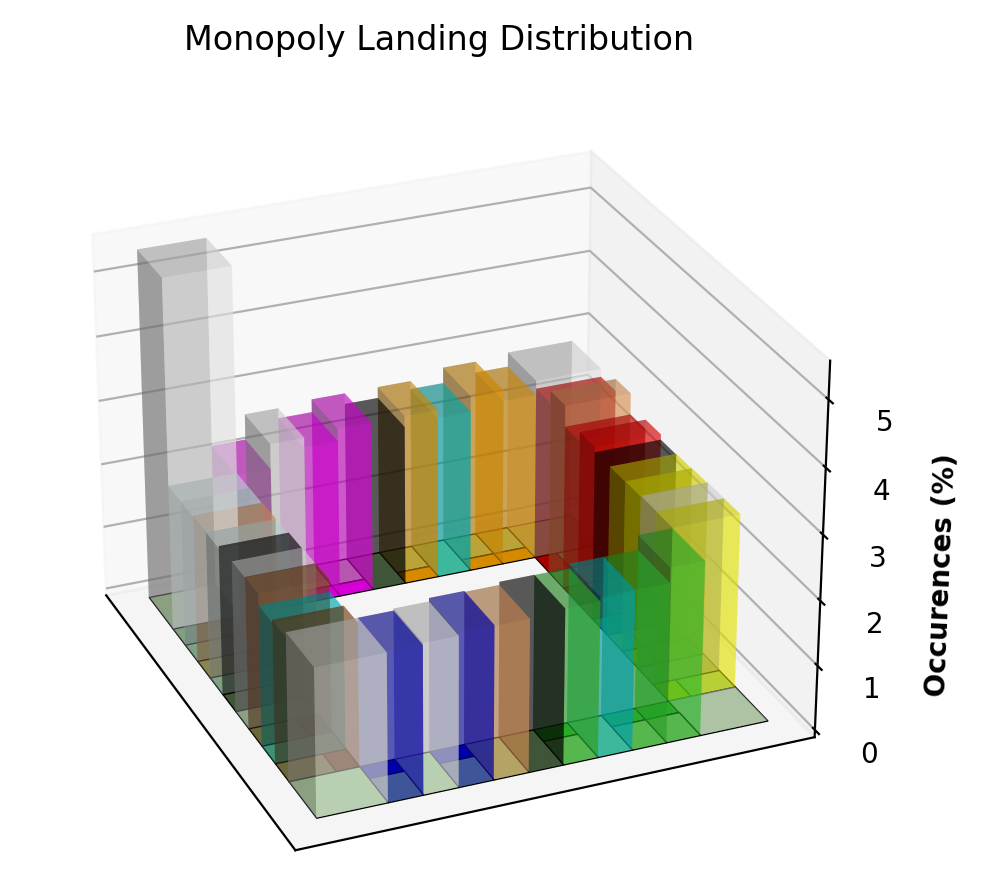
The interactive 3D graph in which users can visualize the distribution of landings.
-
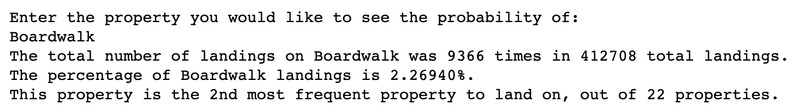
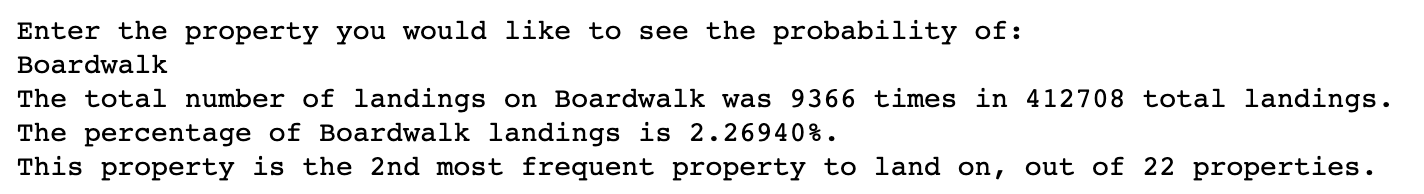
This is the input that users can utilize to retrieve data of a certain property.
-
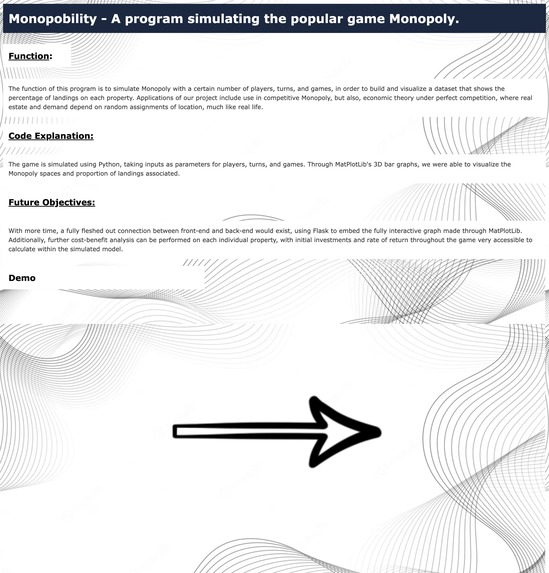
Here is our website, where we struggled to embed the Python code into.

Inspiration
Have you ever been faced with the problem of not winning every single Monopoly game? In some rare cases completely due to rng not a skill issue, you might lose? But now with Monopobility, you have the ability to be the sole winner* of every Monopoly game! *Everyone is a winner in our books
What it does
With Monopobility, our custom 3D data visualization of the probability of landing on each square, you can gain tactical insight into the game of Monopoly to see where is best to situate your properties.
How we built it
We utilized html with css to assemble a website with information about it. And then we used NumPy and Matplotlib inside of a Python Jupyter Notebook to create all models.
Challenges we ran into
Creating the board, 3D graphs, and embedding it into a method which people could interact with was difficult.
Accomplishments that we're proud of
Having a complete 3D Monopoly board which displays the probability of landing on each square based on our own working simulation of landing on each square.
What we learned
3D visualizations with Matplotlib, creating a website, and teamwork makes the dream work.
What's next for Monopobility
The next steps would be to enhance interactability to react on mouse hovers by displaying data and highlighting a bar, and embedding the graph while maintaining its interactivity into a publicly accessible website. Additionally, we would like to display more statistics such as ROI.


Log in or sign up for Devpost to join the conversation.