Template overview
Monitoring Template comprised of Grafana, Prometheus, and a Go exporter.
The template provides the Bunnyshell configuration for four components, more exactly 4 services.
You can update/extend the template by further adding data sources for Grafana and/or new Prometheus exporters.
Environment overview
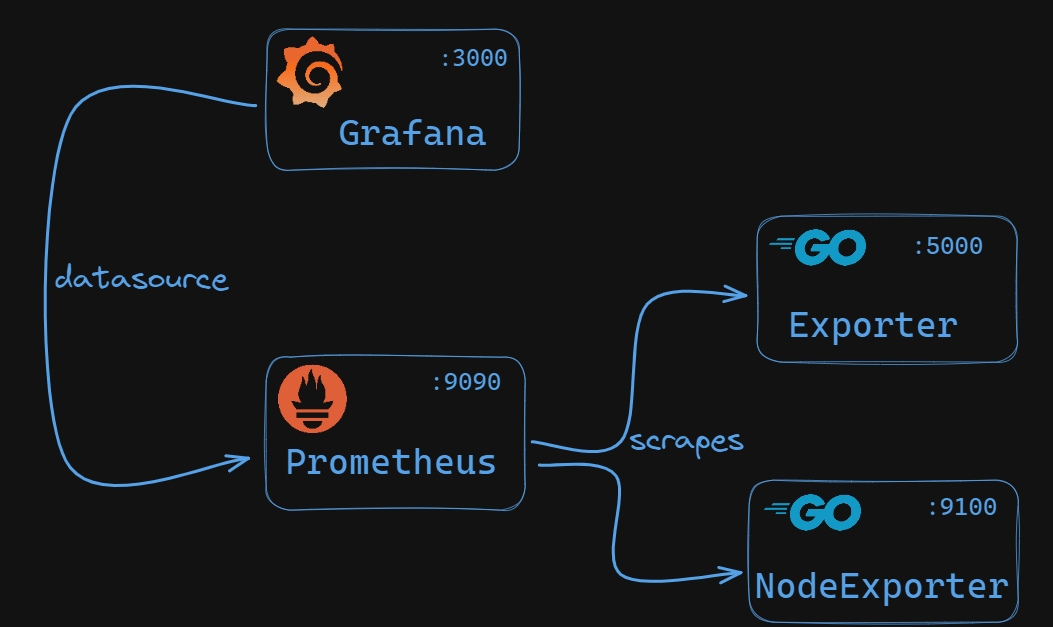
This environment is comprised of 4 components:
Grafanafor visualizationPrometheusfor metrics- Golang web app (that exposes Prometheus metrics)
- Golang node exporter (scrapes and exposes machine metrics)
The Grafana credentials are configurable (by default the values for the user and password are set at the component level)
Built With
- golang
- grafana
- prometheus

Log in or sign up for Devpost to join the conversation.