Inspiration:
Many people find their money spent easily and they even haven't realized how they spent the money. This system is helping people to analyze how they spend money on different aspects. It will show a pie chart to afford visualization of the analyzation.
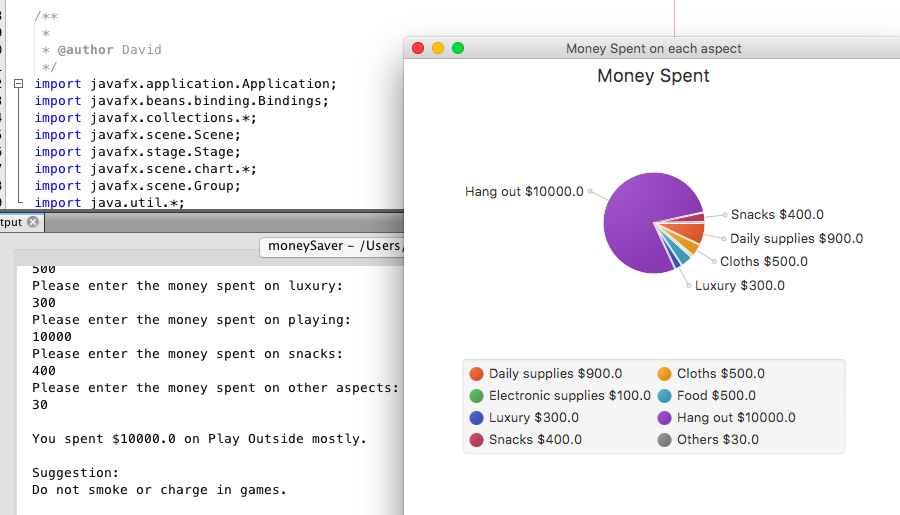
What it does
Visualize how user's money spent and give out a specific suggestion for saving money.
How I built it
Java, Netbeans, Coffee
Challenges I ran into
How to visualize it by a piechart with aspect name and data, not only a simple pie chart.
Accomplishments
I'm proud of writing a piechart showing aspect name and data at the same time in java. I never learned that before.
What I learned
How to let a piechart work. Not only a pie chart but showing both aspect name and data at the same time.
What's next for moneySaver----An visualized analyze system
Saving data into a Database. Give new features about comparing and analyzing the data between months.

Log in or sign up for Devpost to join the conversation.