Inspiration
Every transfer window, the same pattern plays out: a player at a mid-table club has a brilliant season, a big club pays three times what he was "worth" a year earlier, and everyone wonders why nobody spotted him sooner. Moneyball showed that markets for players can be systematically wrong. We wanted to know whether the football transfer market is too, and whether we could build a tool a budget-conscious club could actually use to get ahead of it.
The question we set ourselves was simple: can we find players whose on-pitch output is worth more than the market says, and can we prove the market later agrees?
What it does
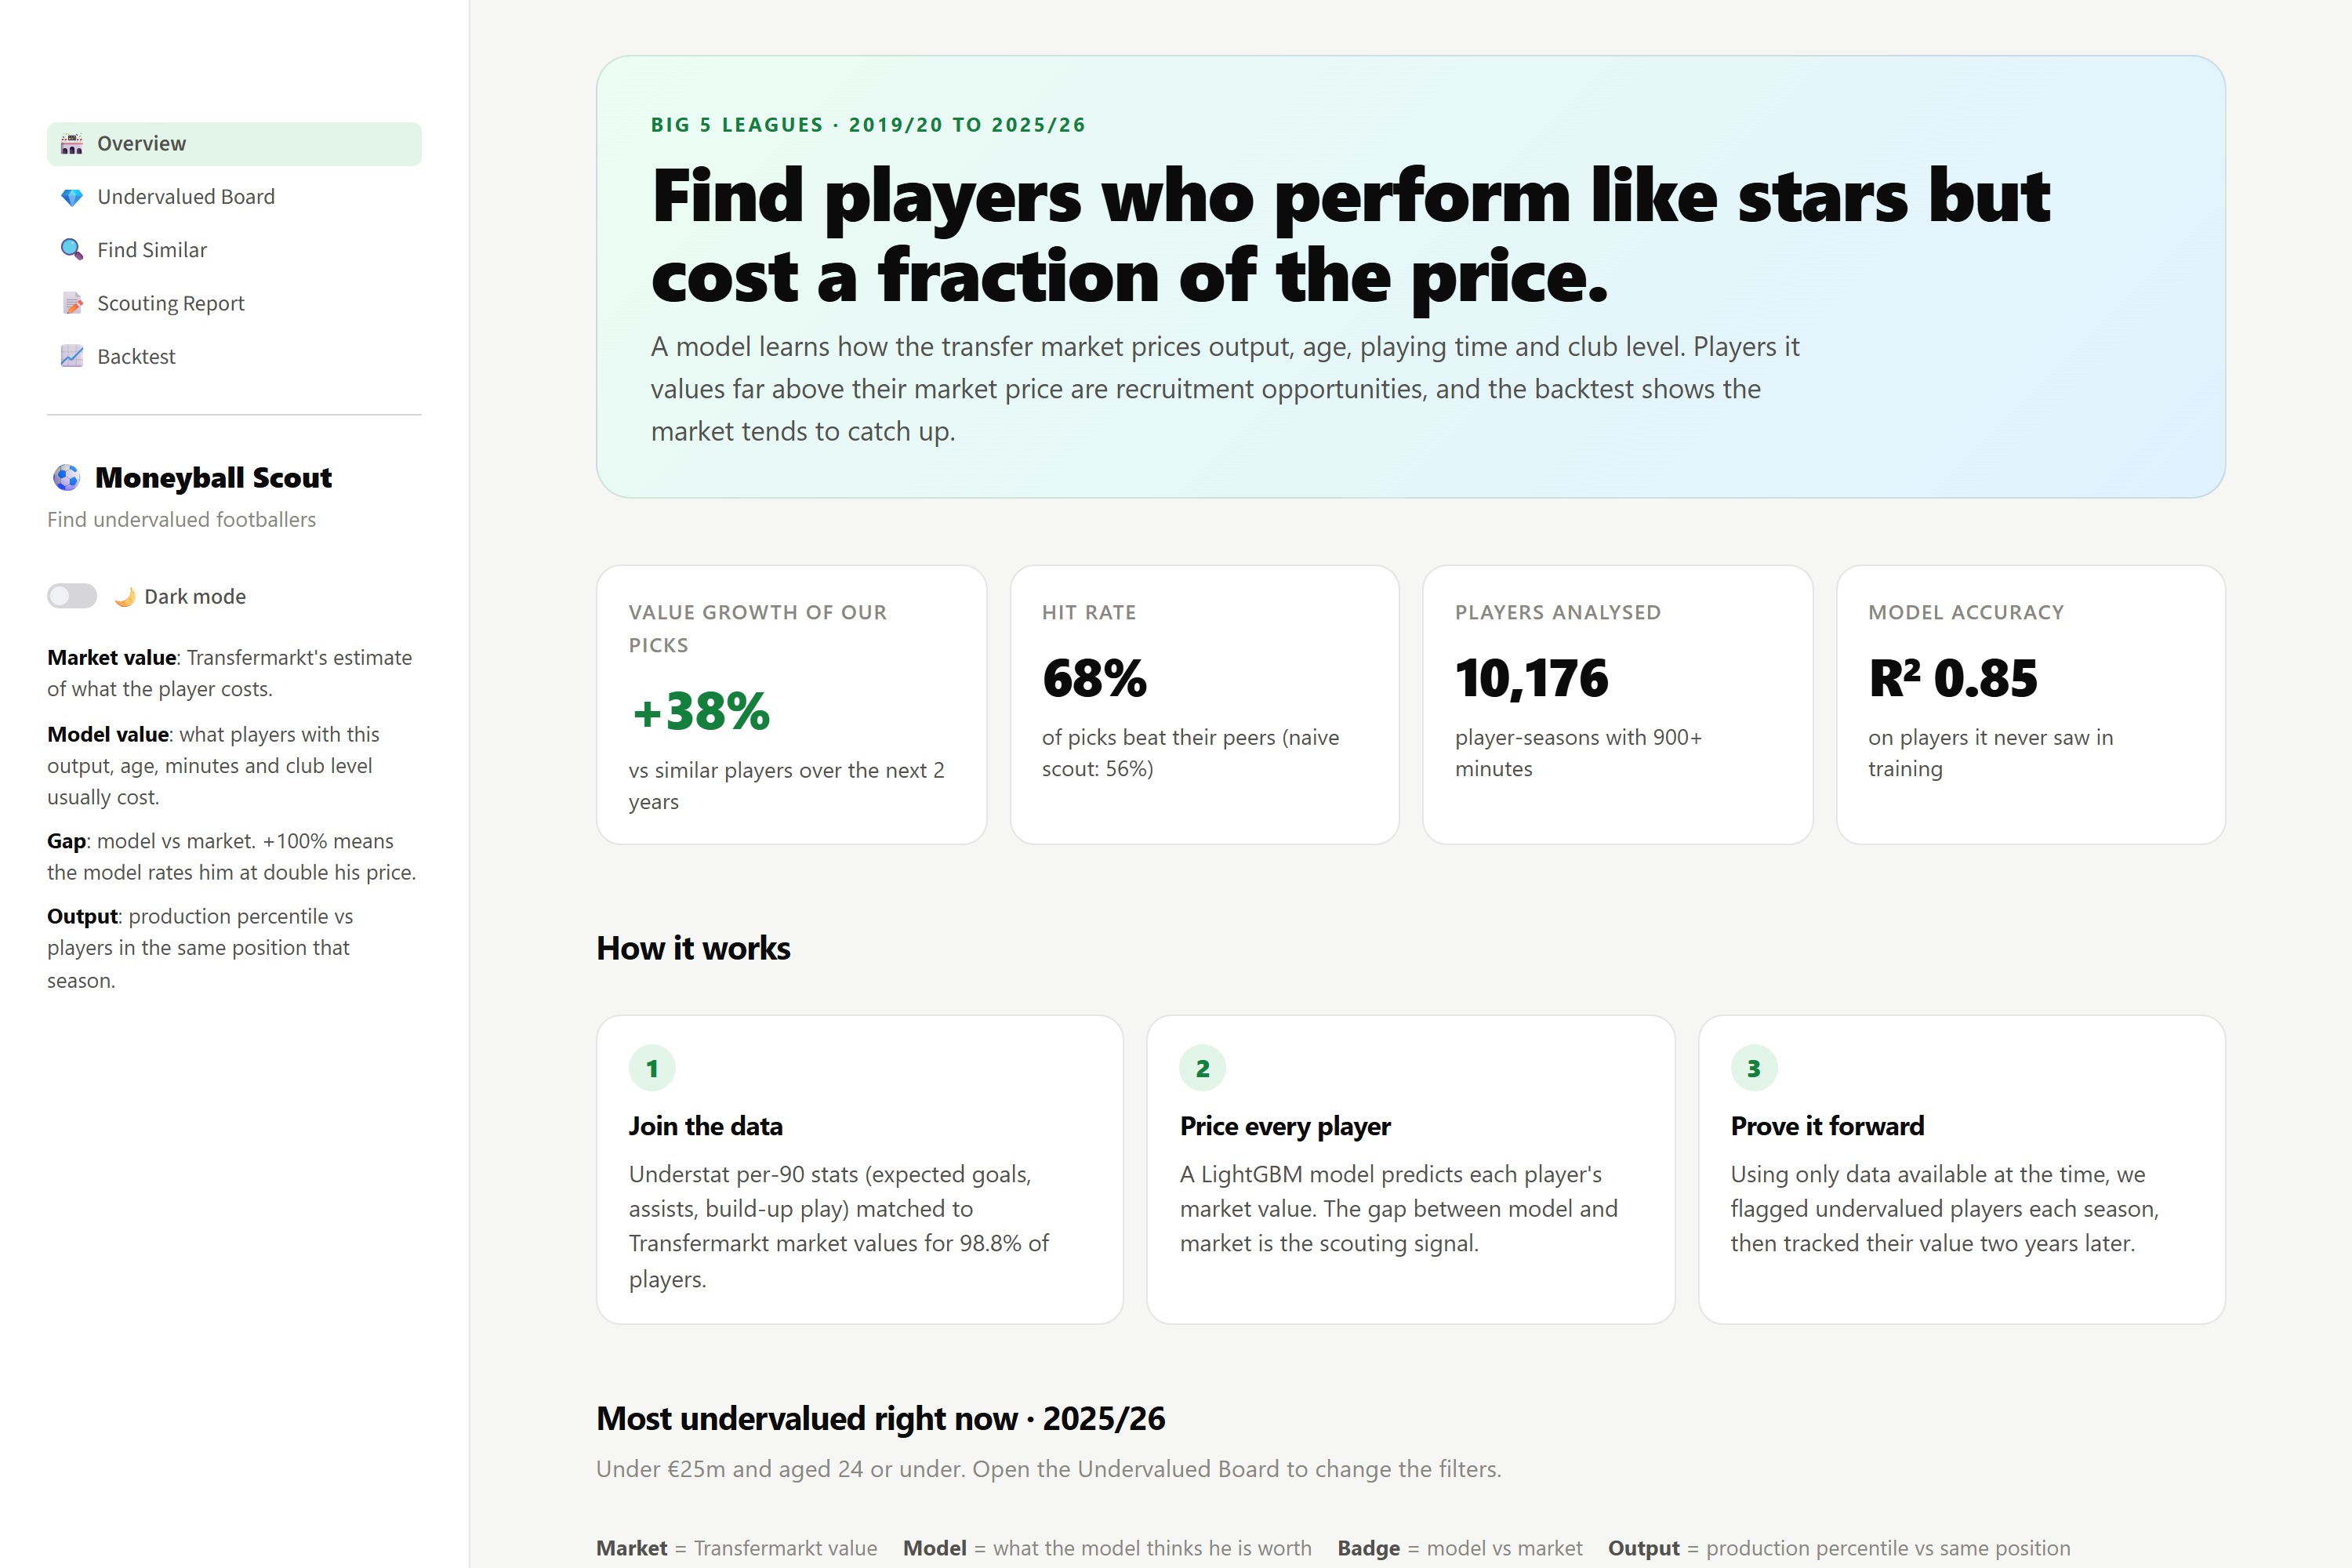
Moneyball Scout prices every regular player in Europe's Big 5 leagues (19,400 player-seasons, 2019/20 to 2025/26) and flags the ones the market undervalues.
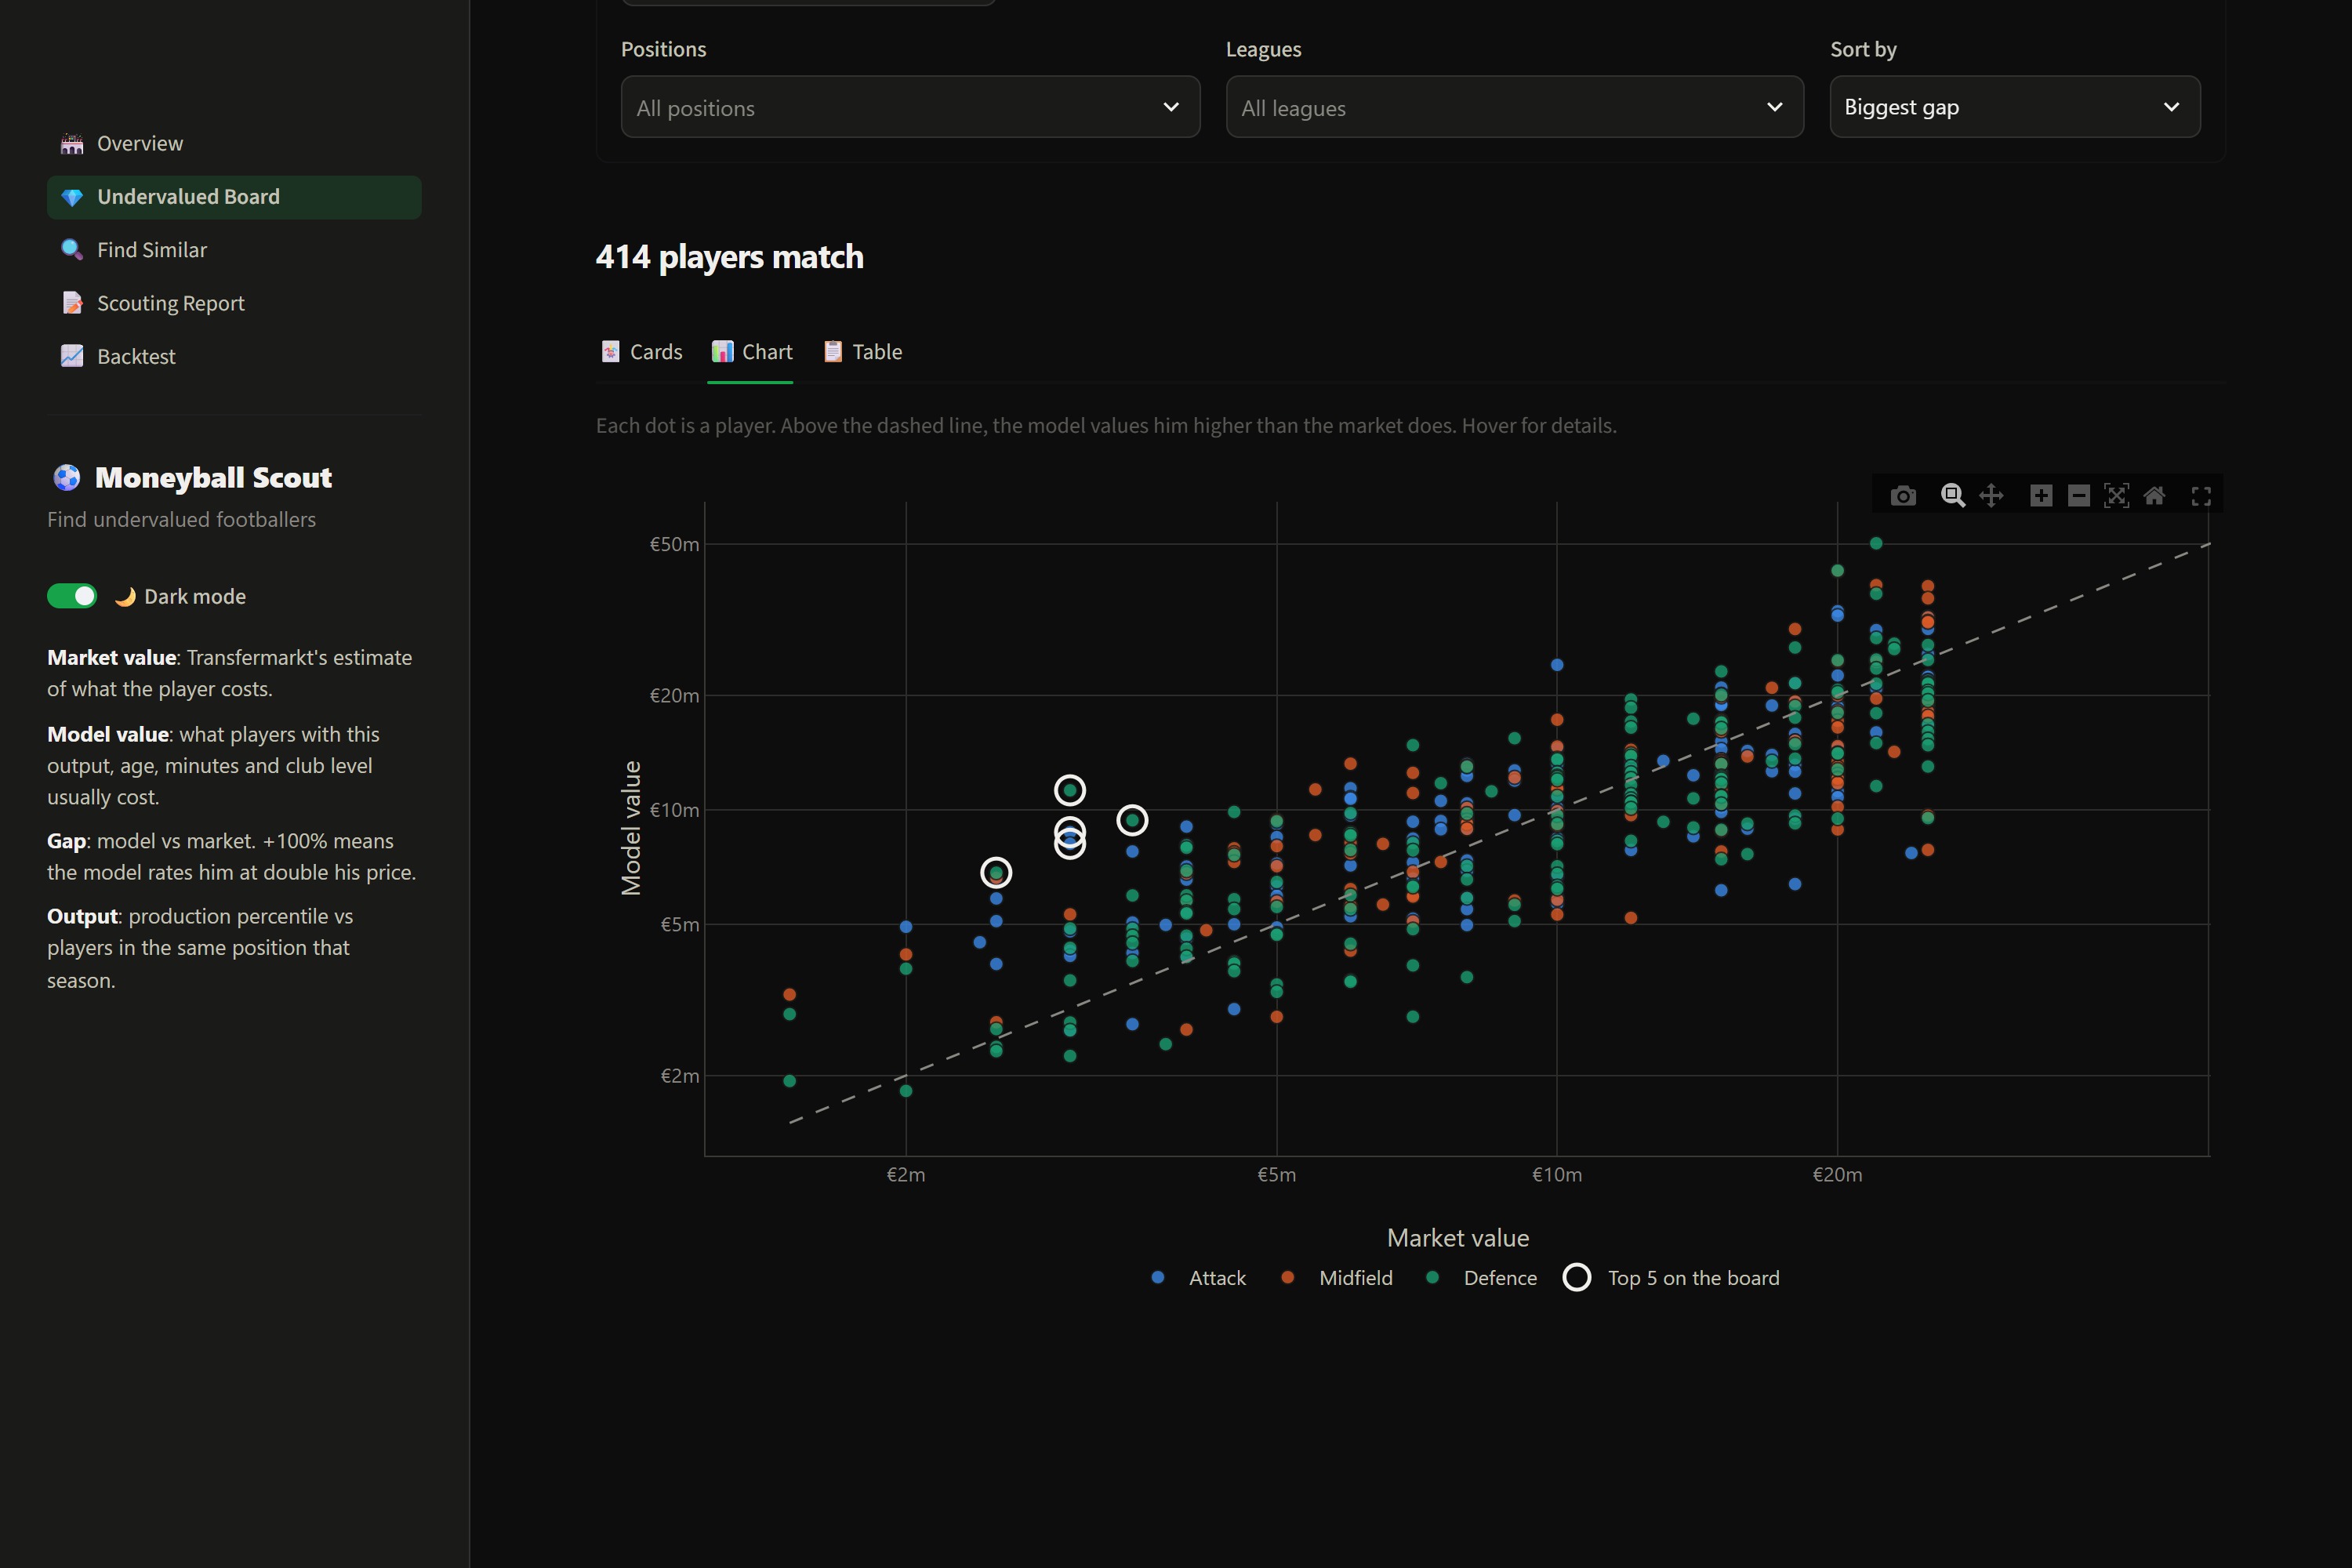
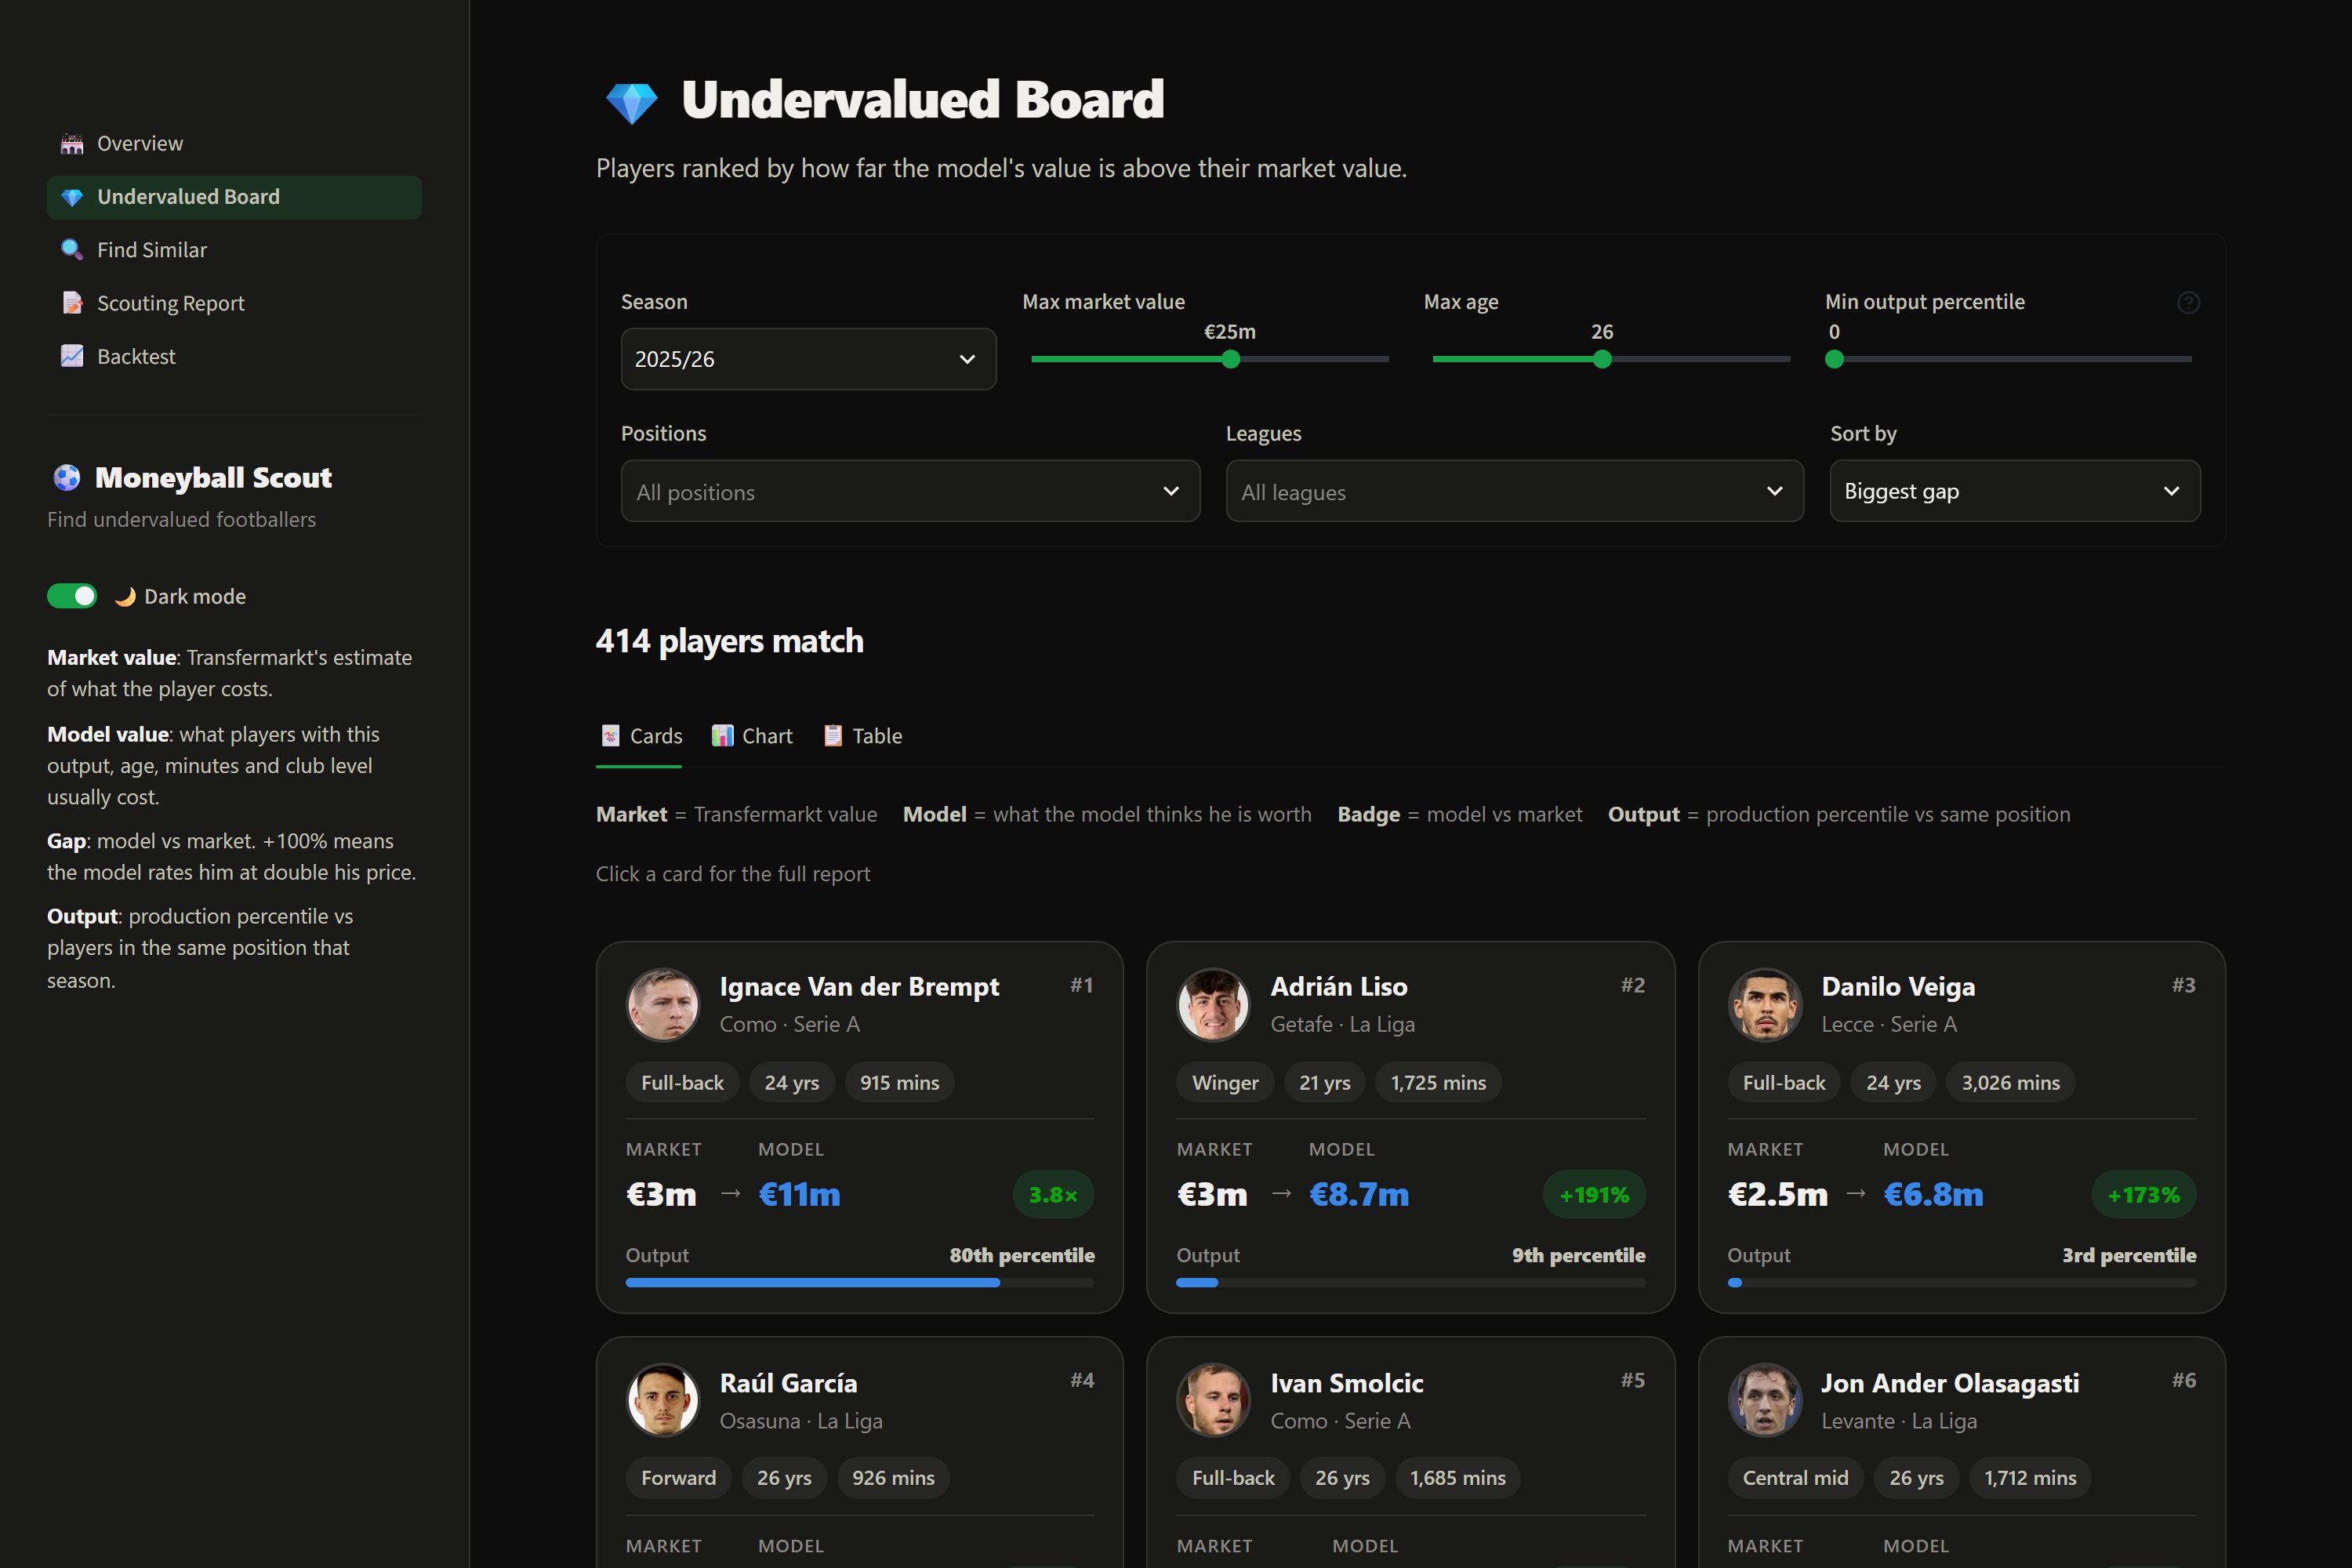
- Undervalued Board: every player ranked by the gap between our model's value and their market value. You can filter by budget, age, position, league and minimum output, then export a shortlist.
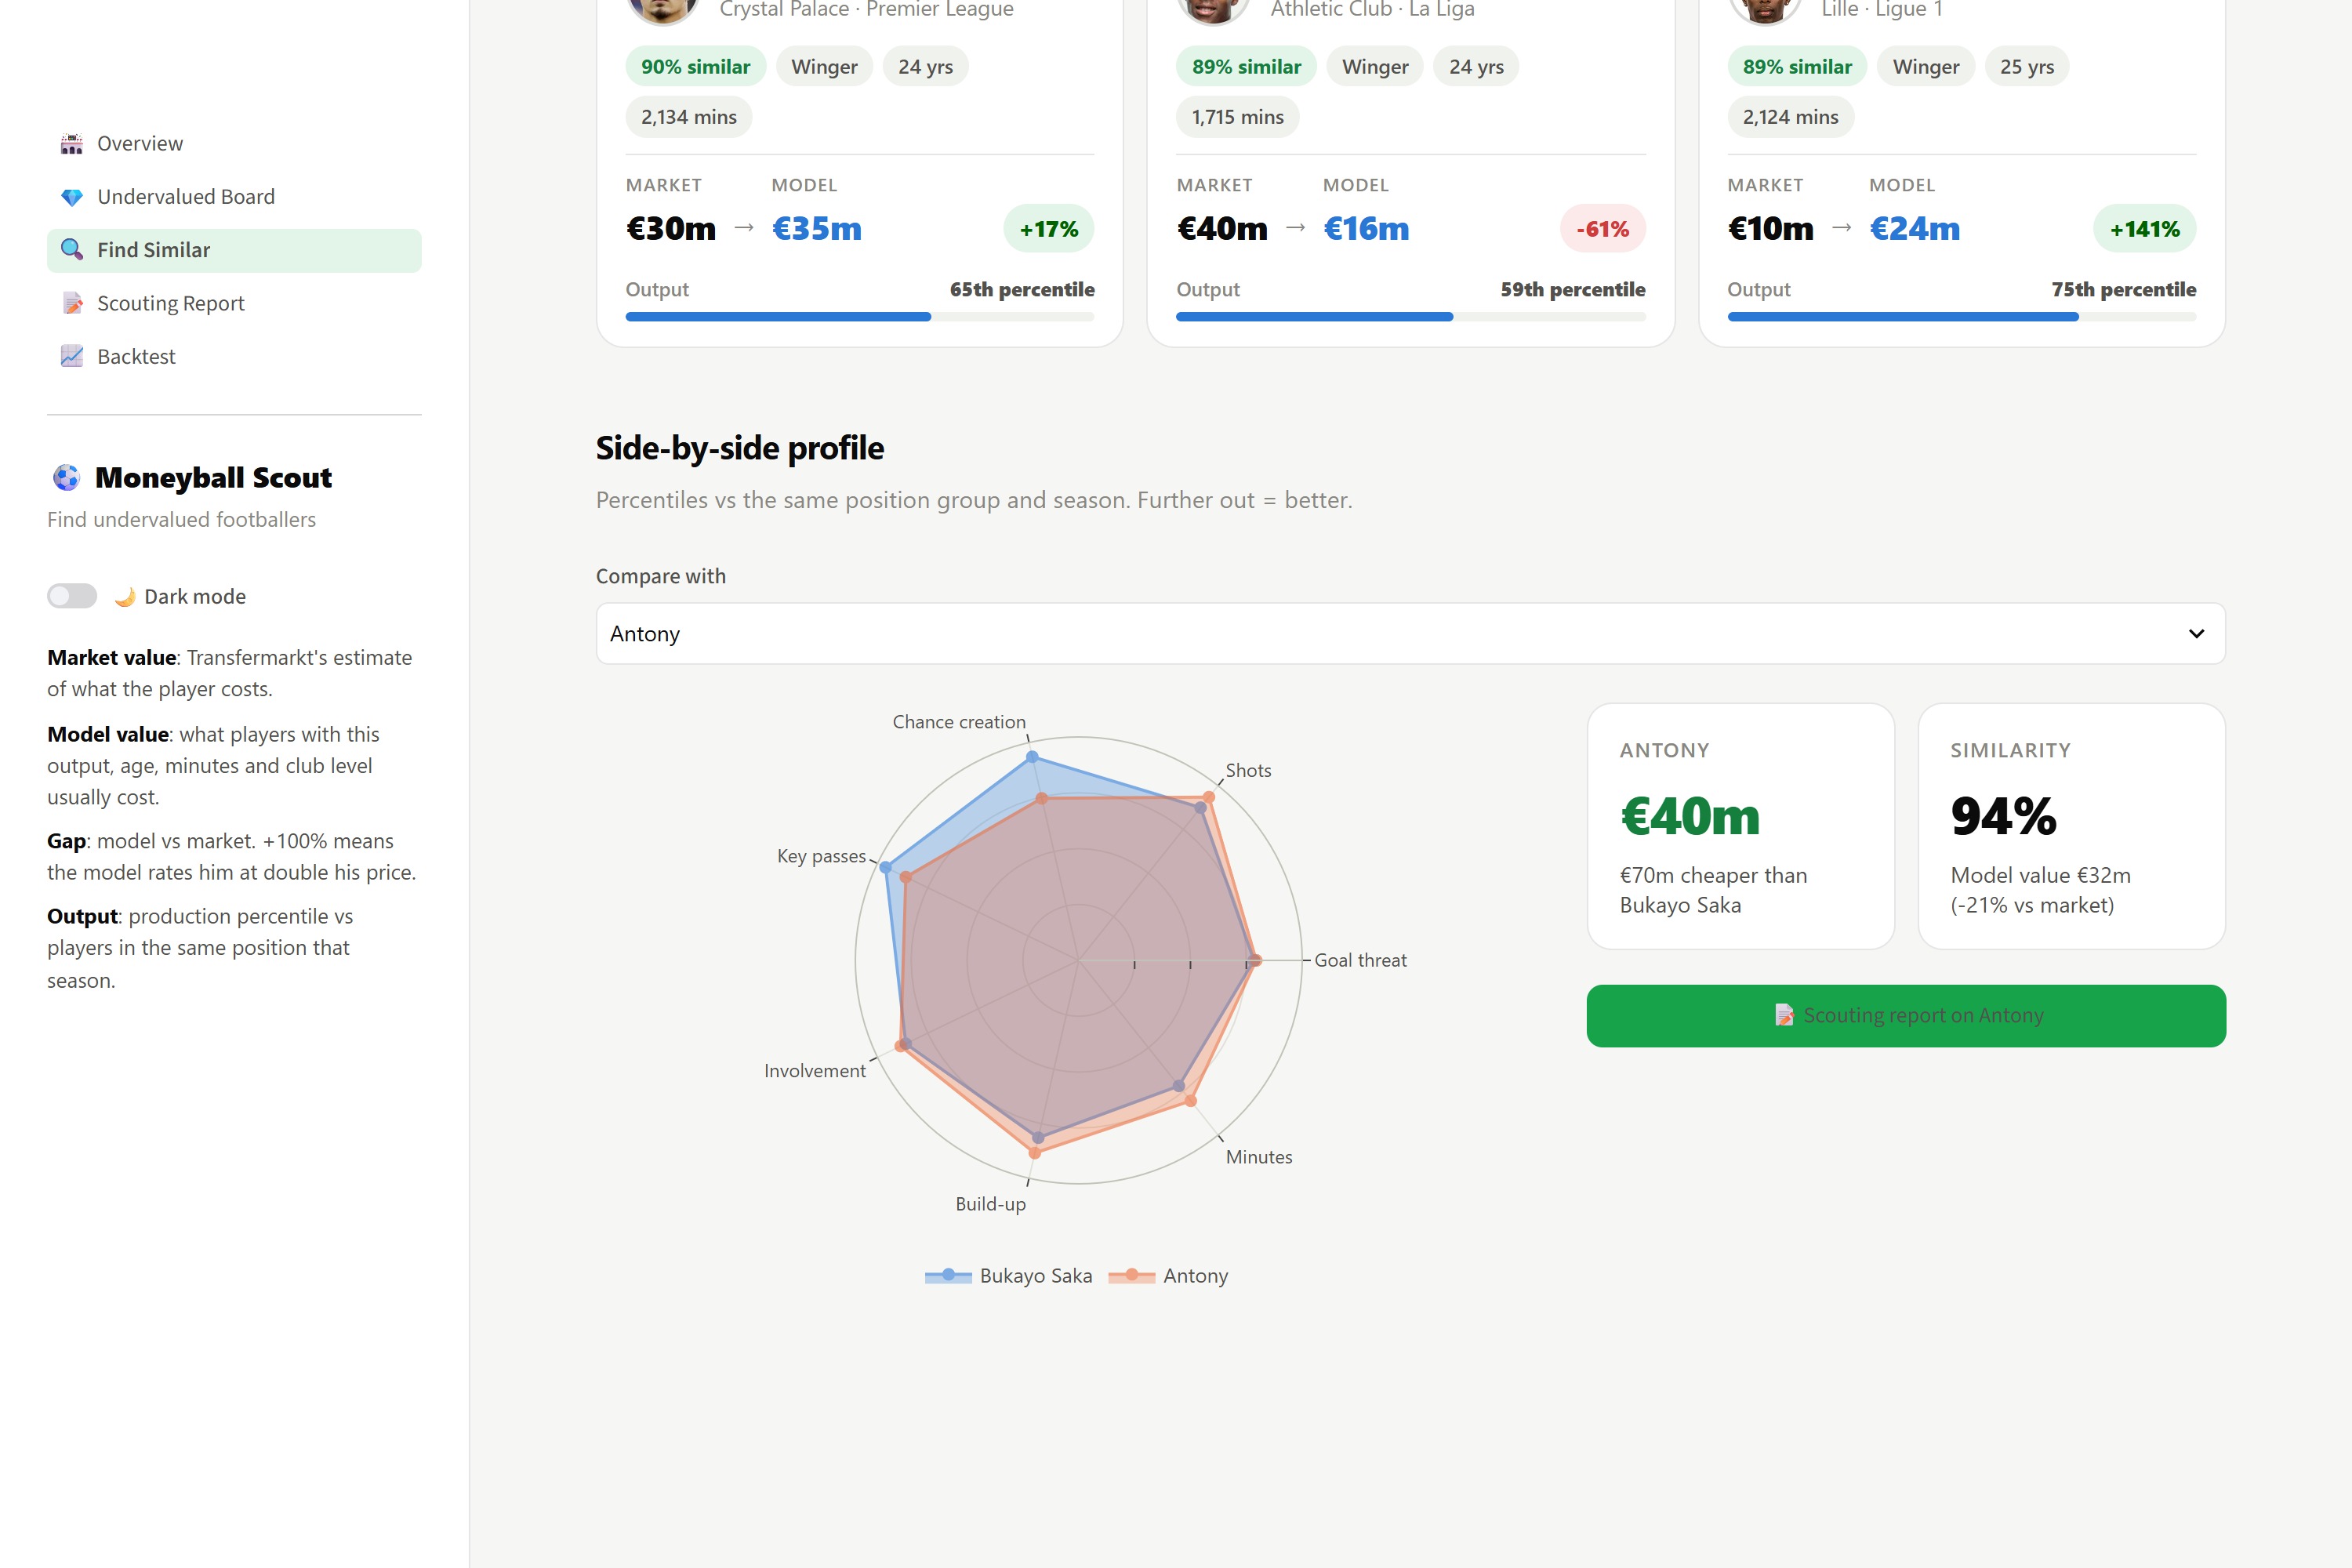
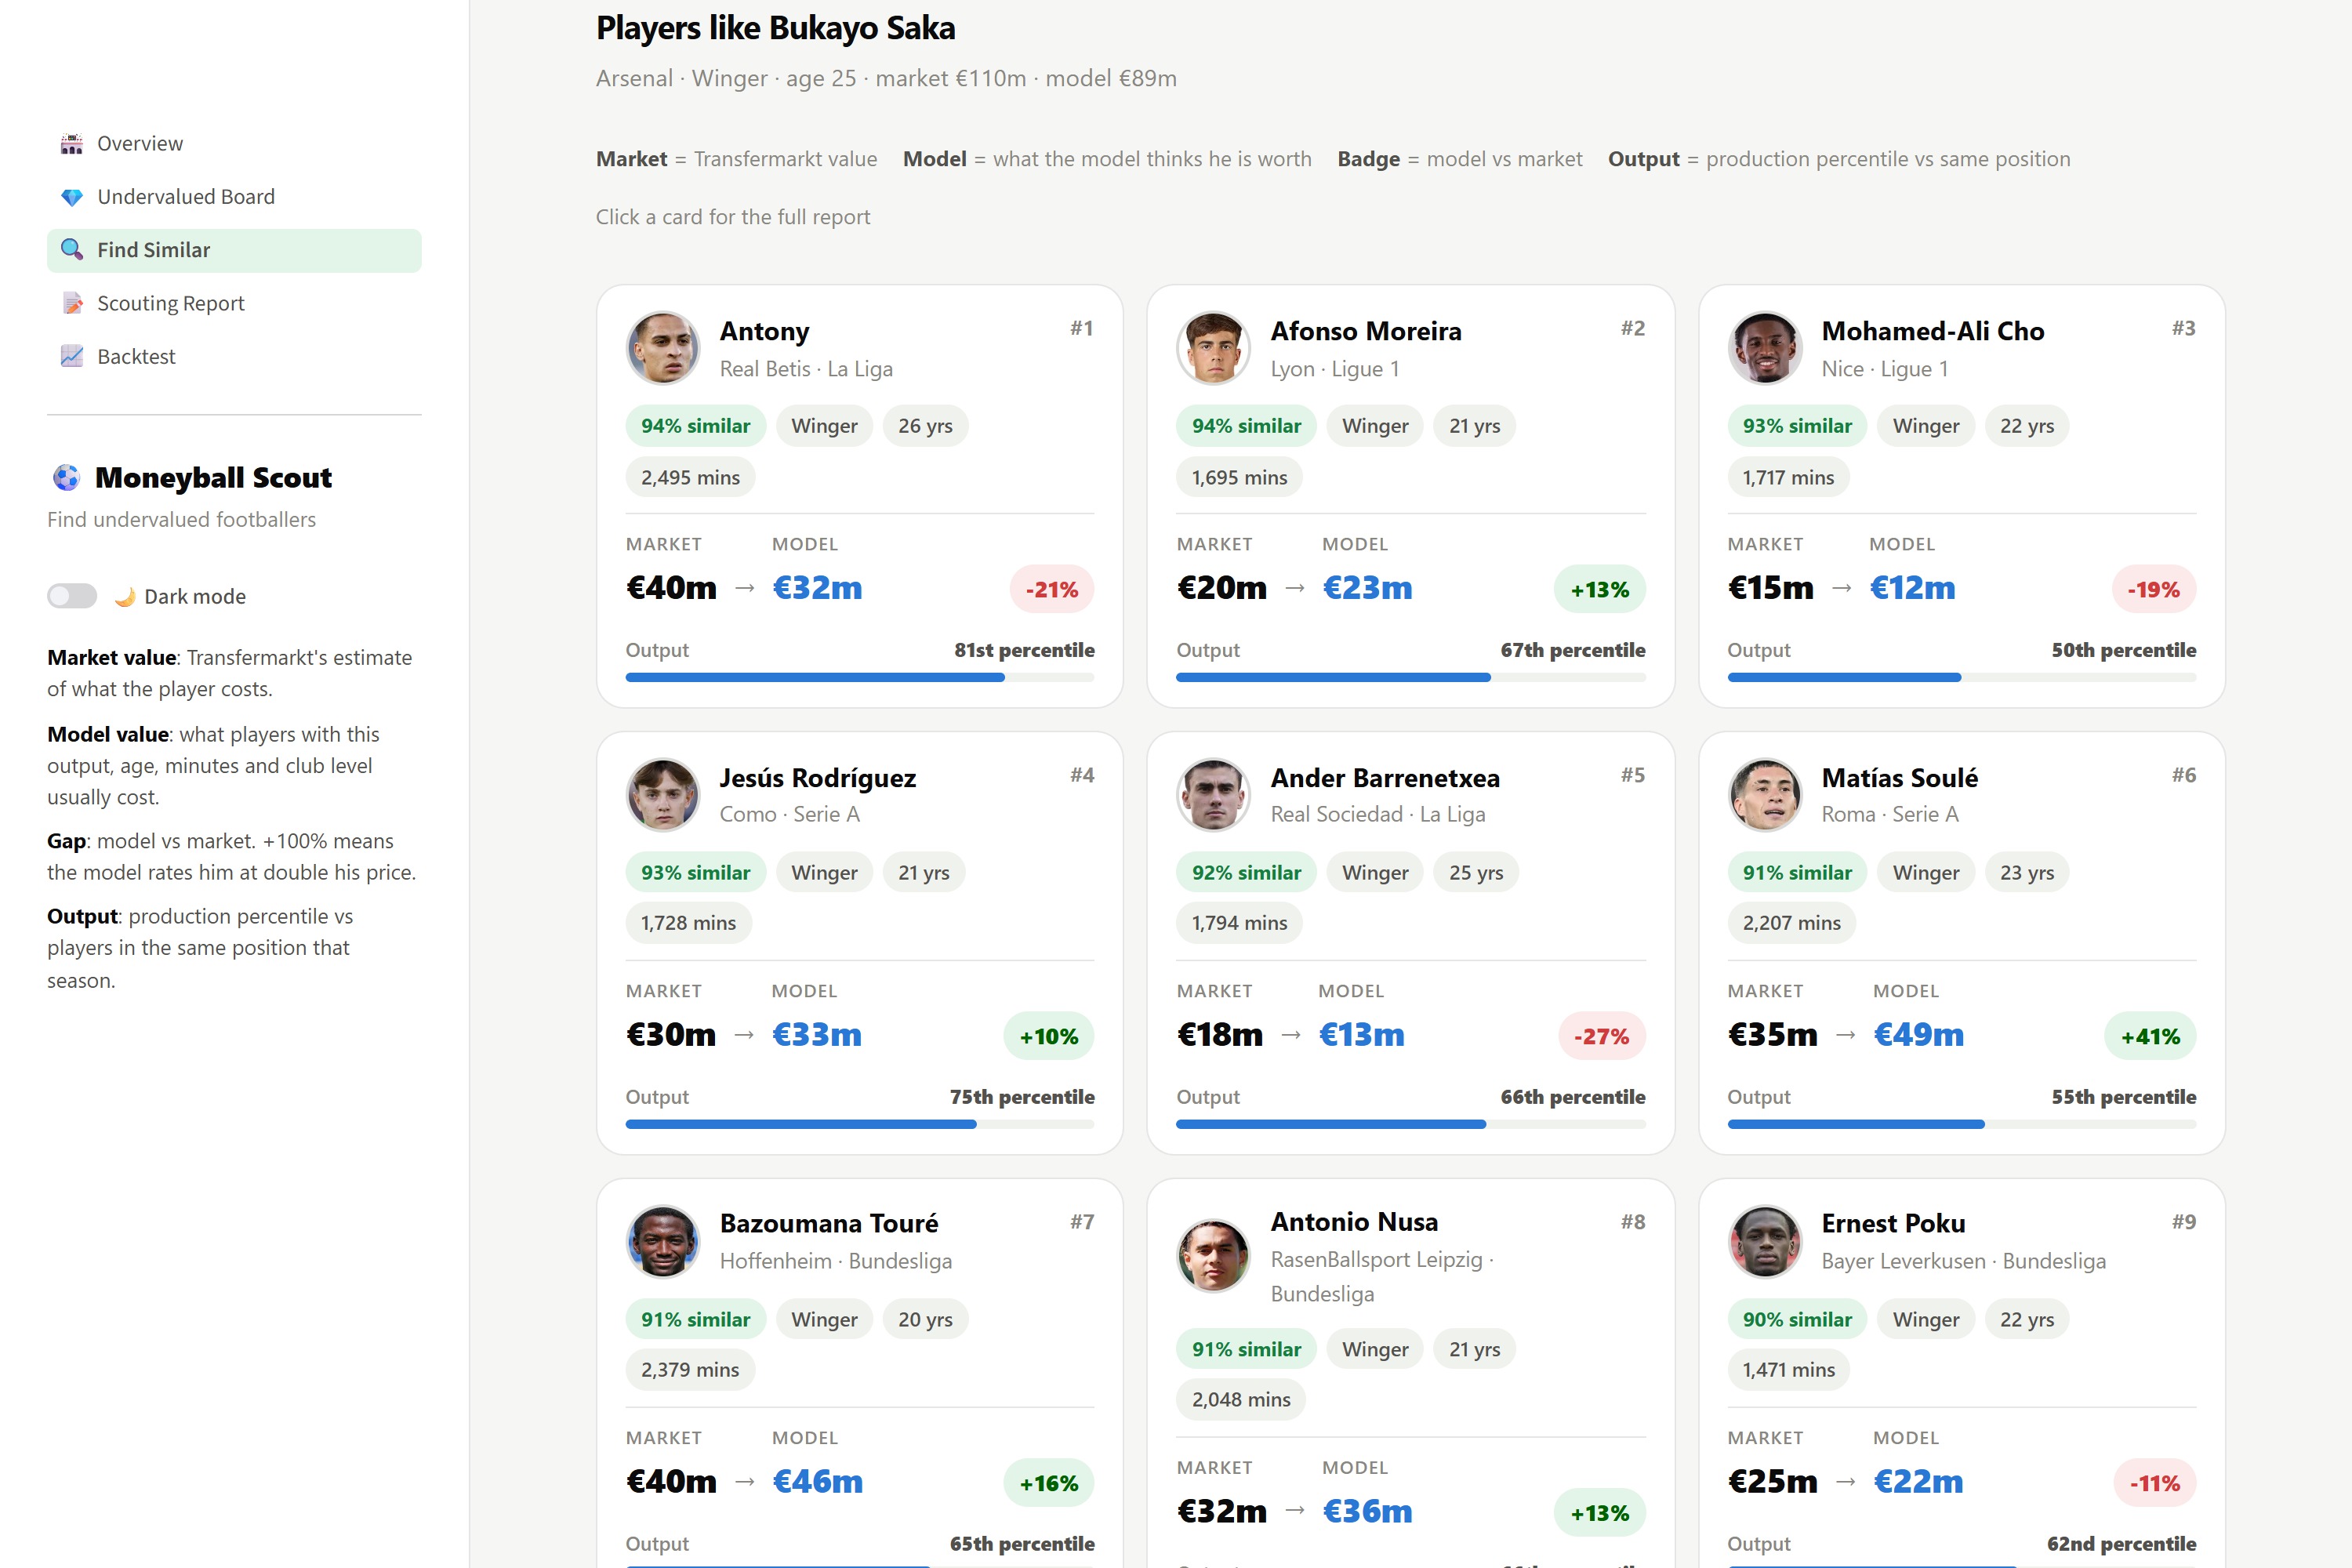
- Find Similar: pick a star you can't afford and get statistically similar players you can, with a side-by-side radar.
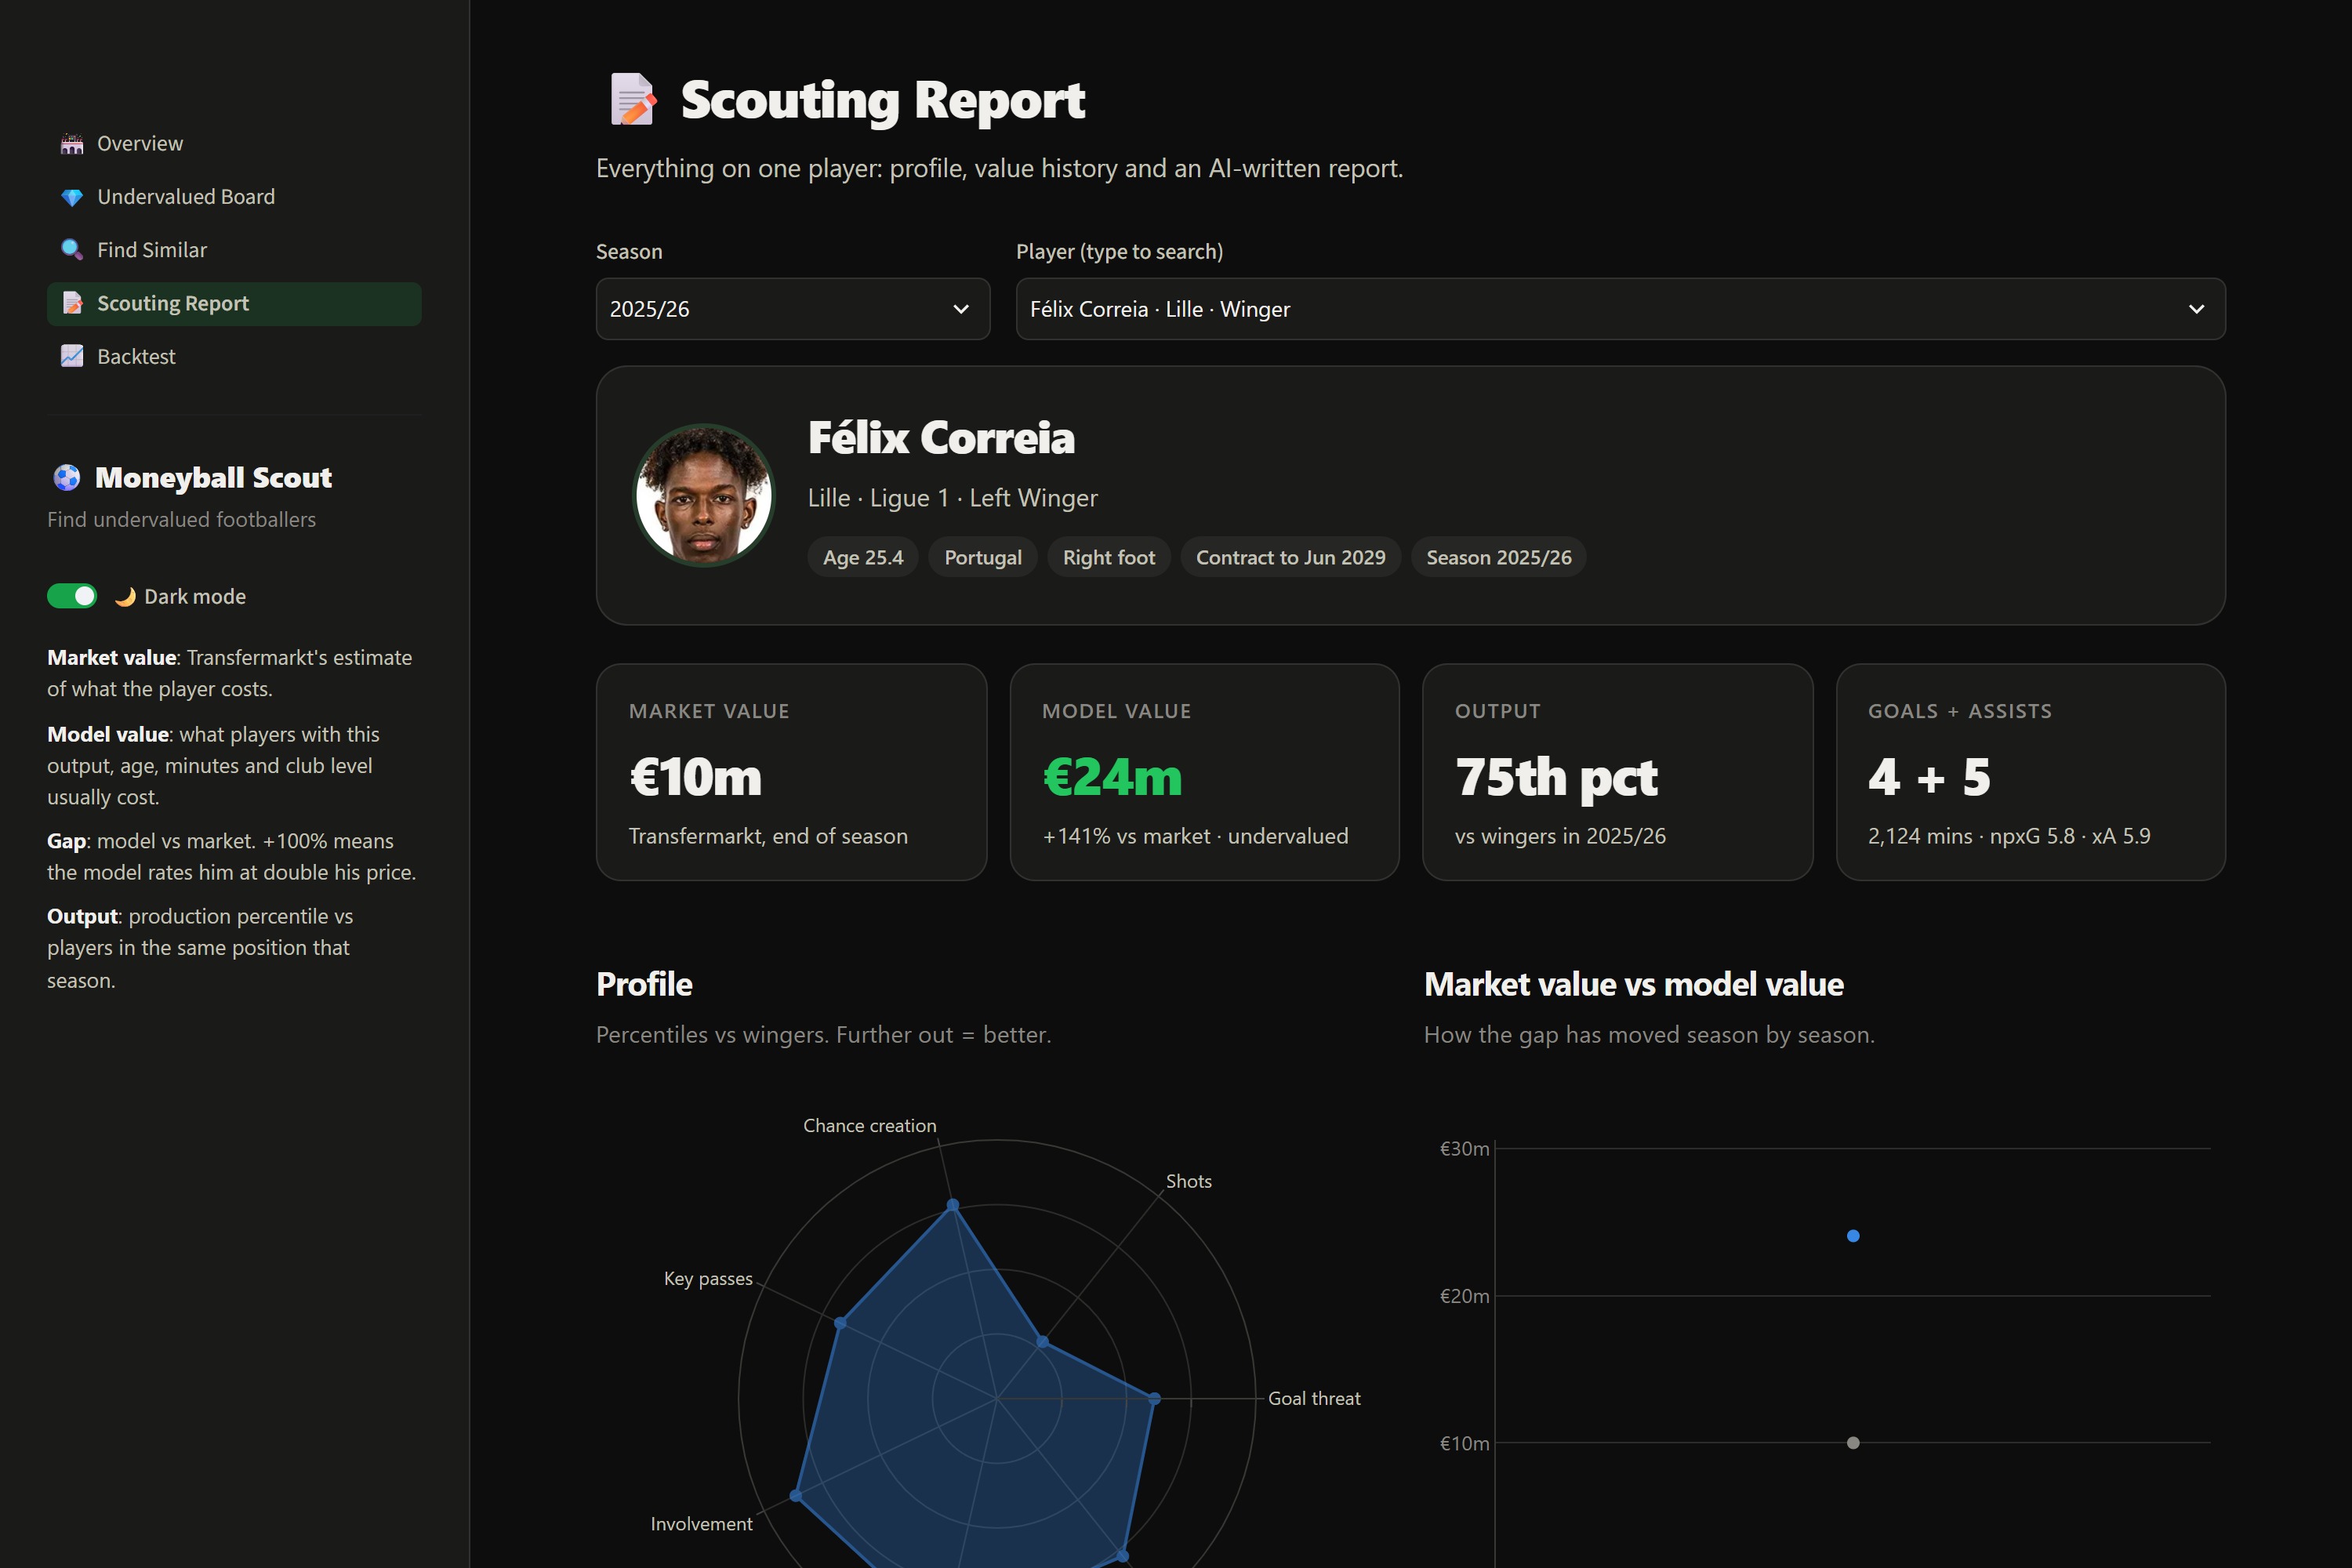
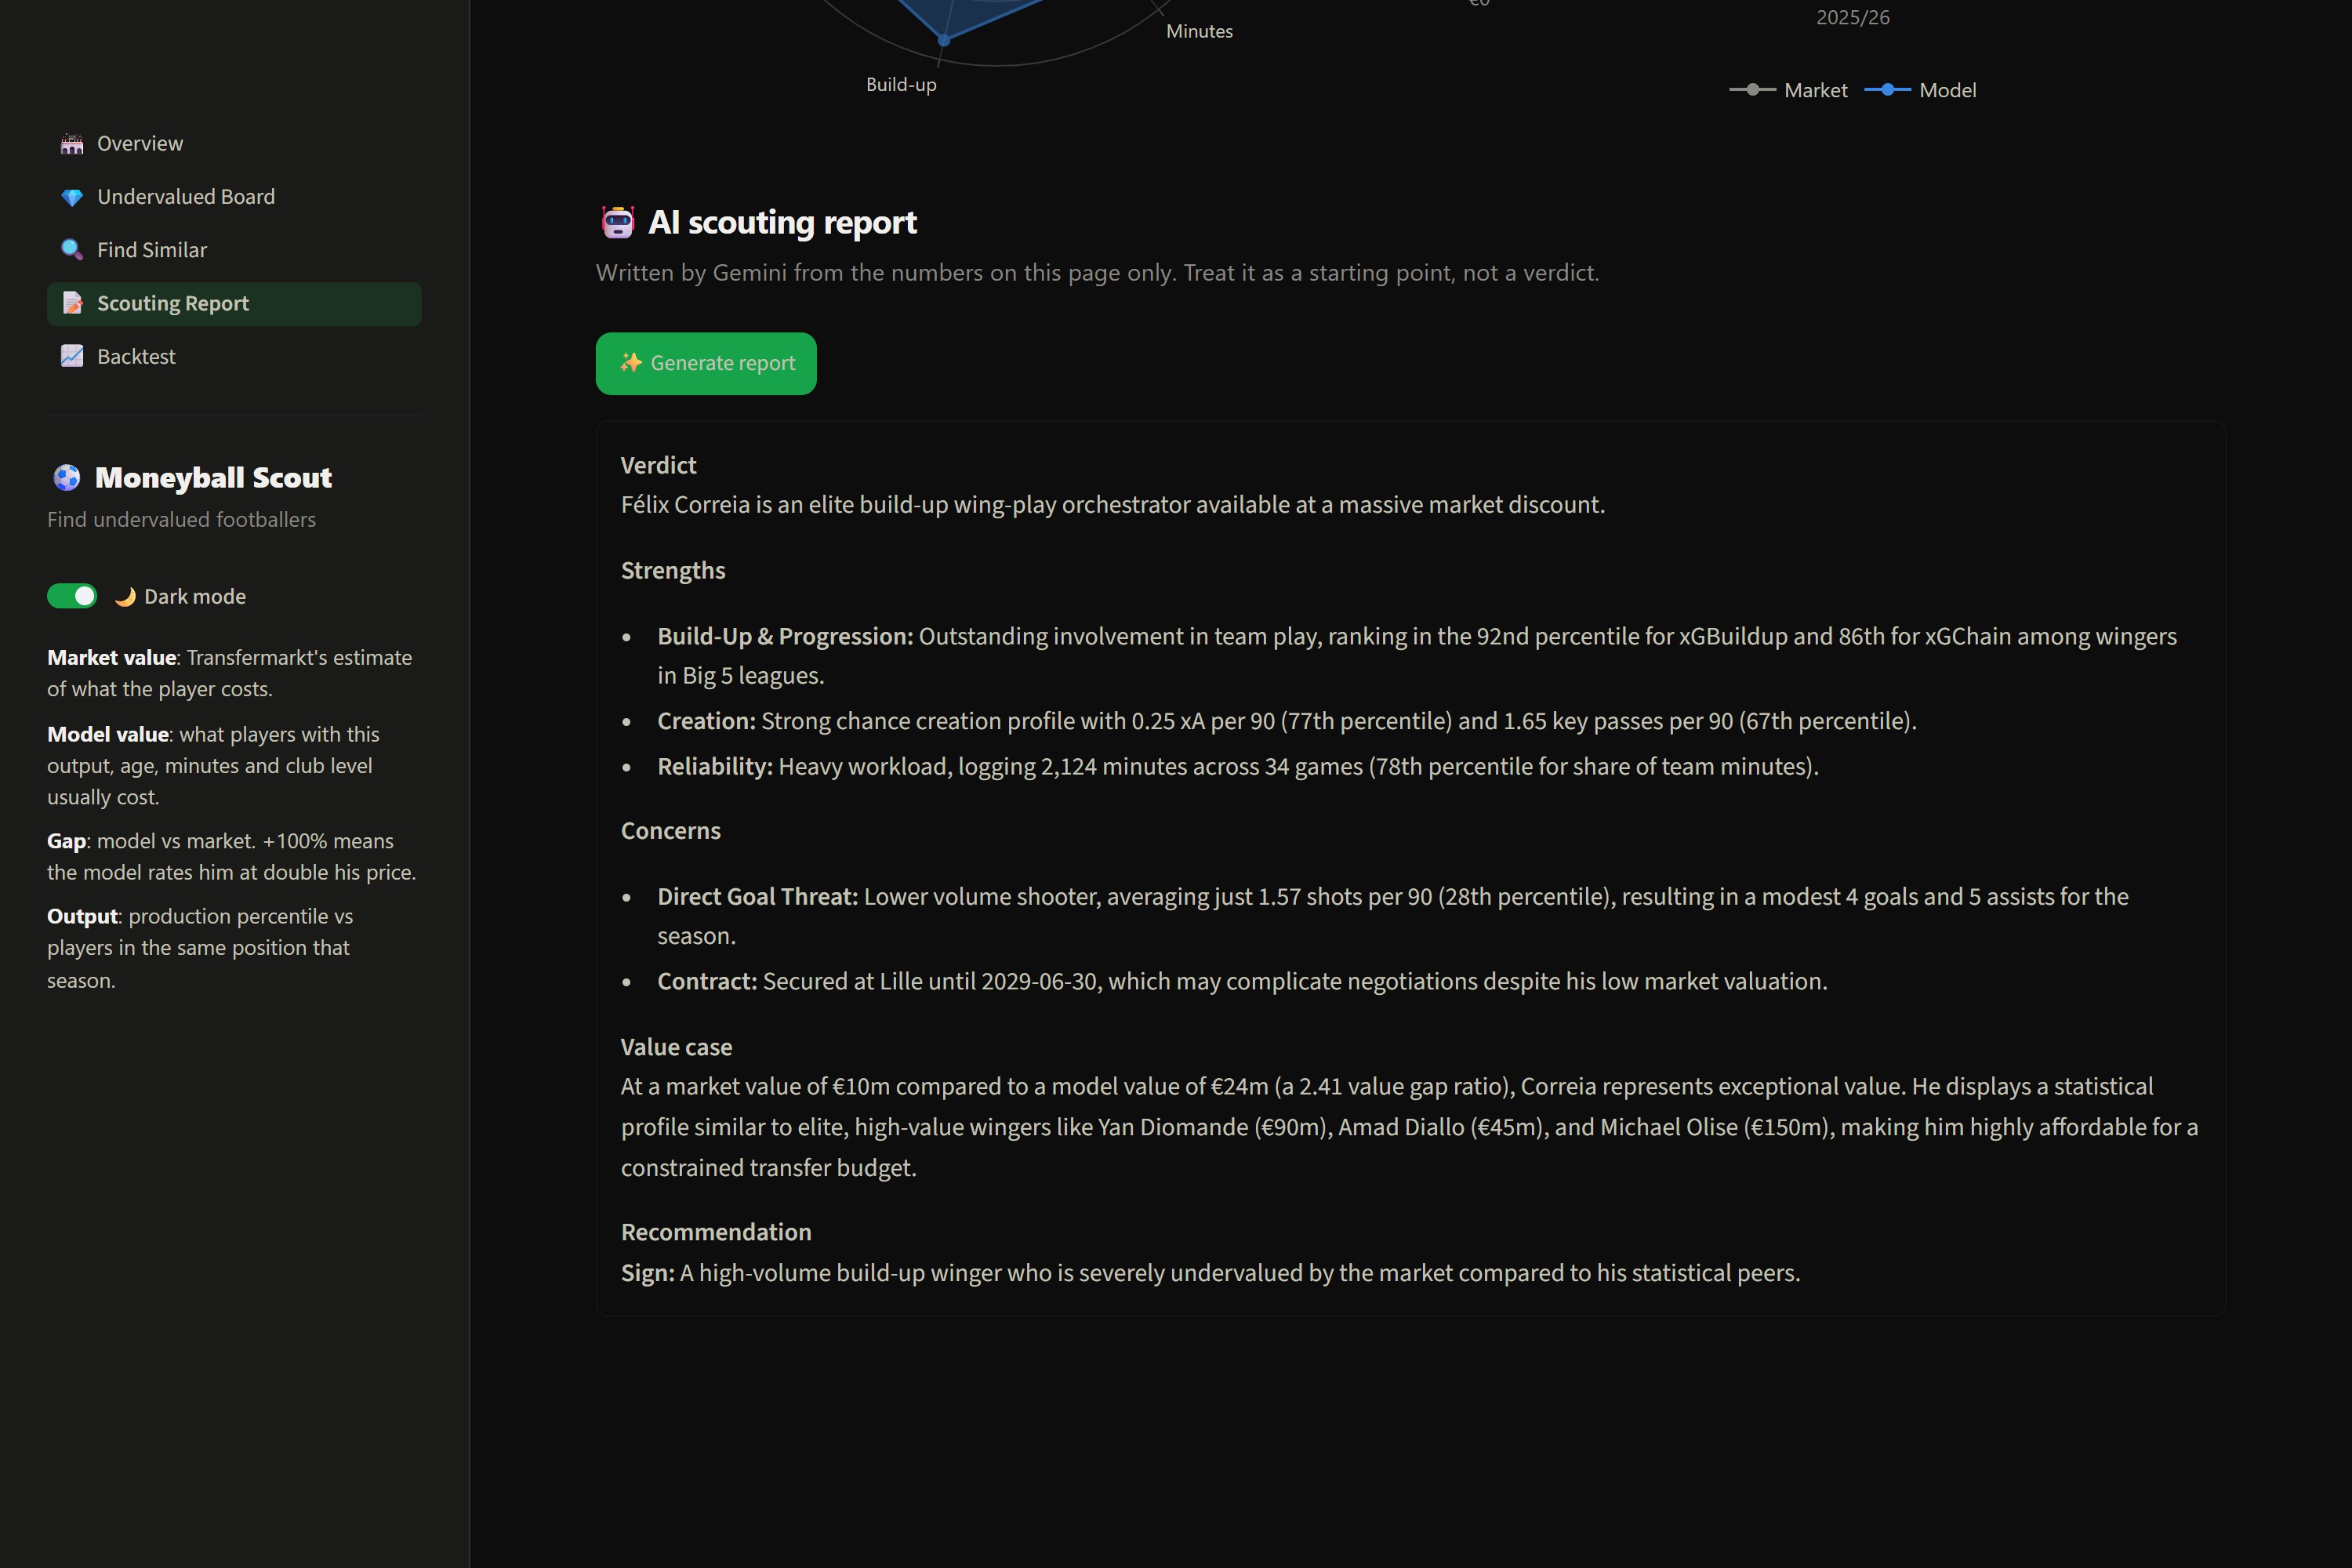
- Scouting Report: a player's profile, value history, and an AI-written report (Gemini) grounded only in the numbers on the page.
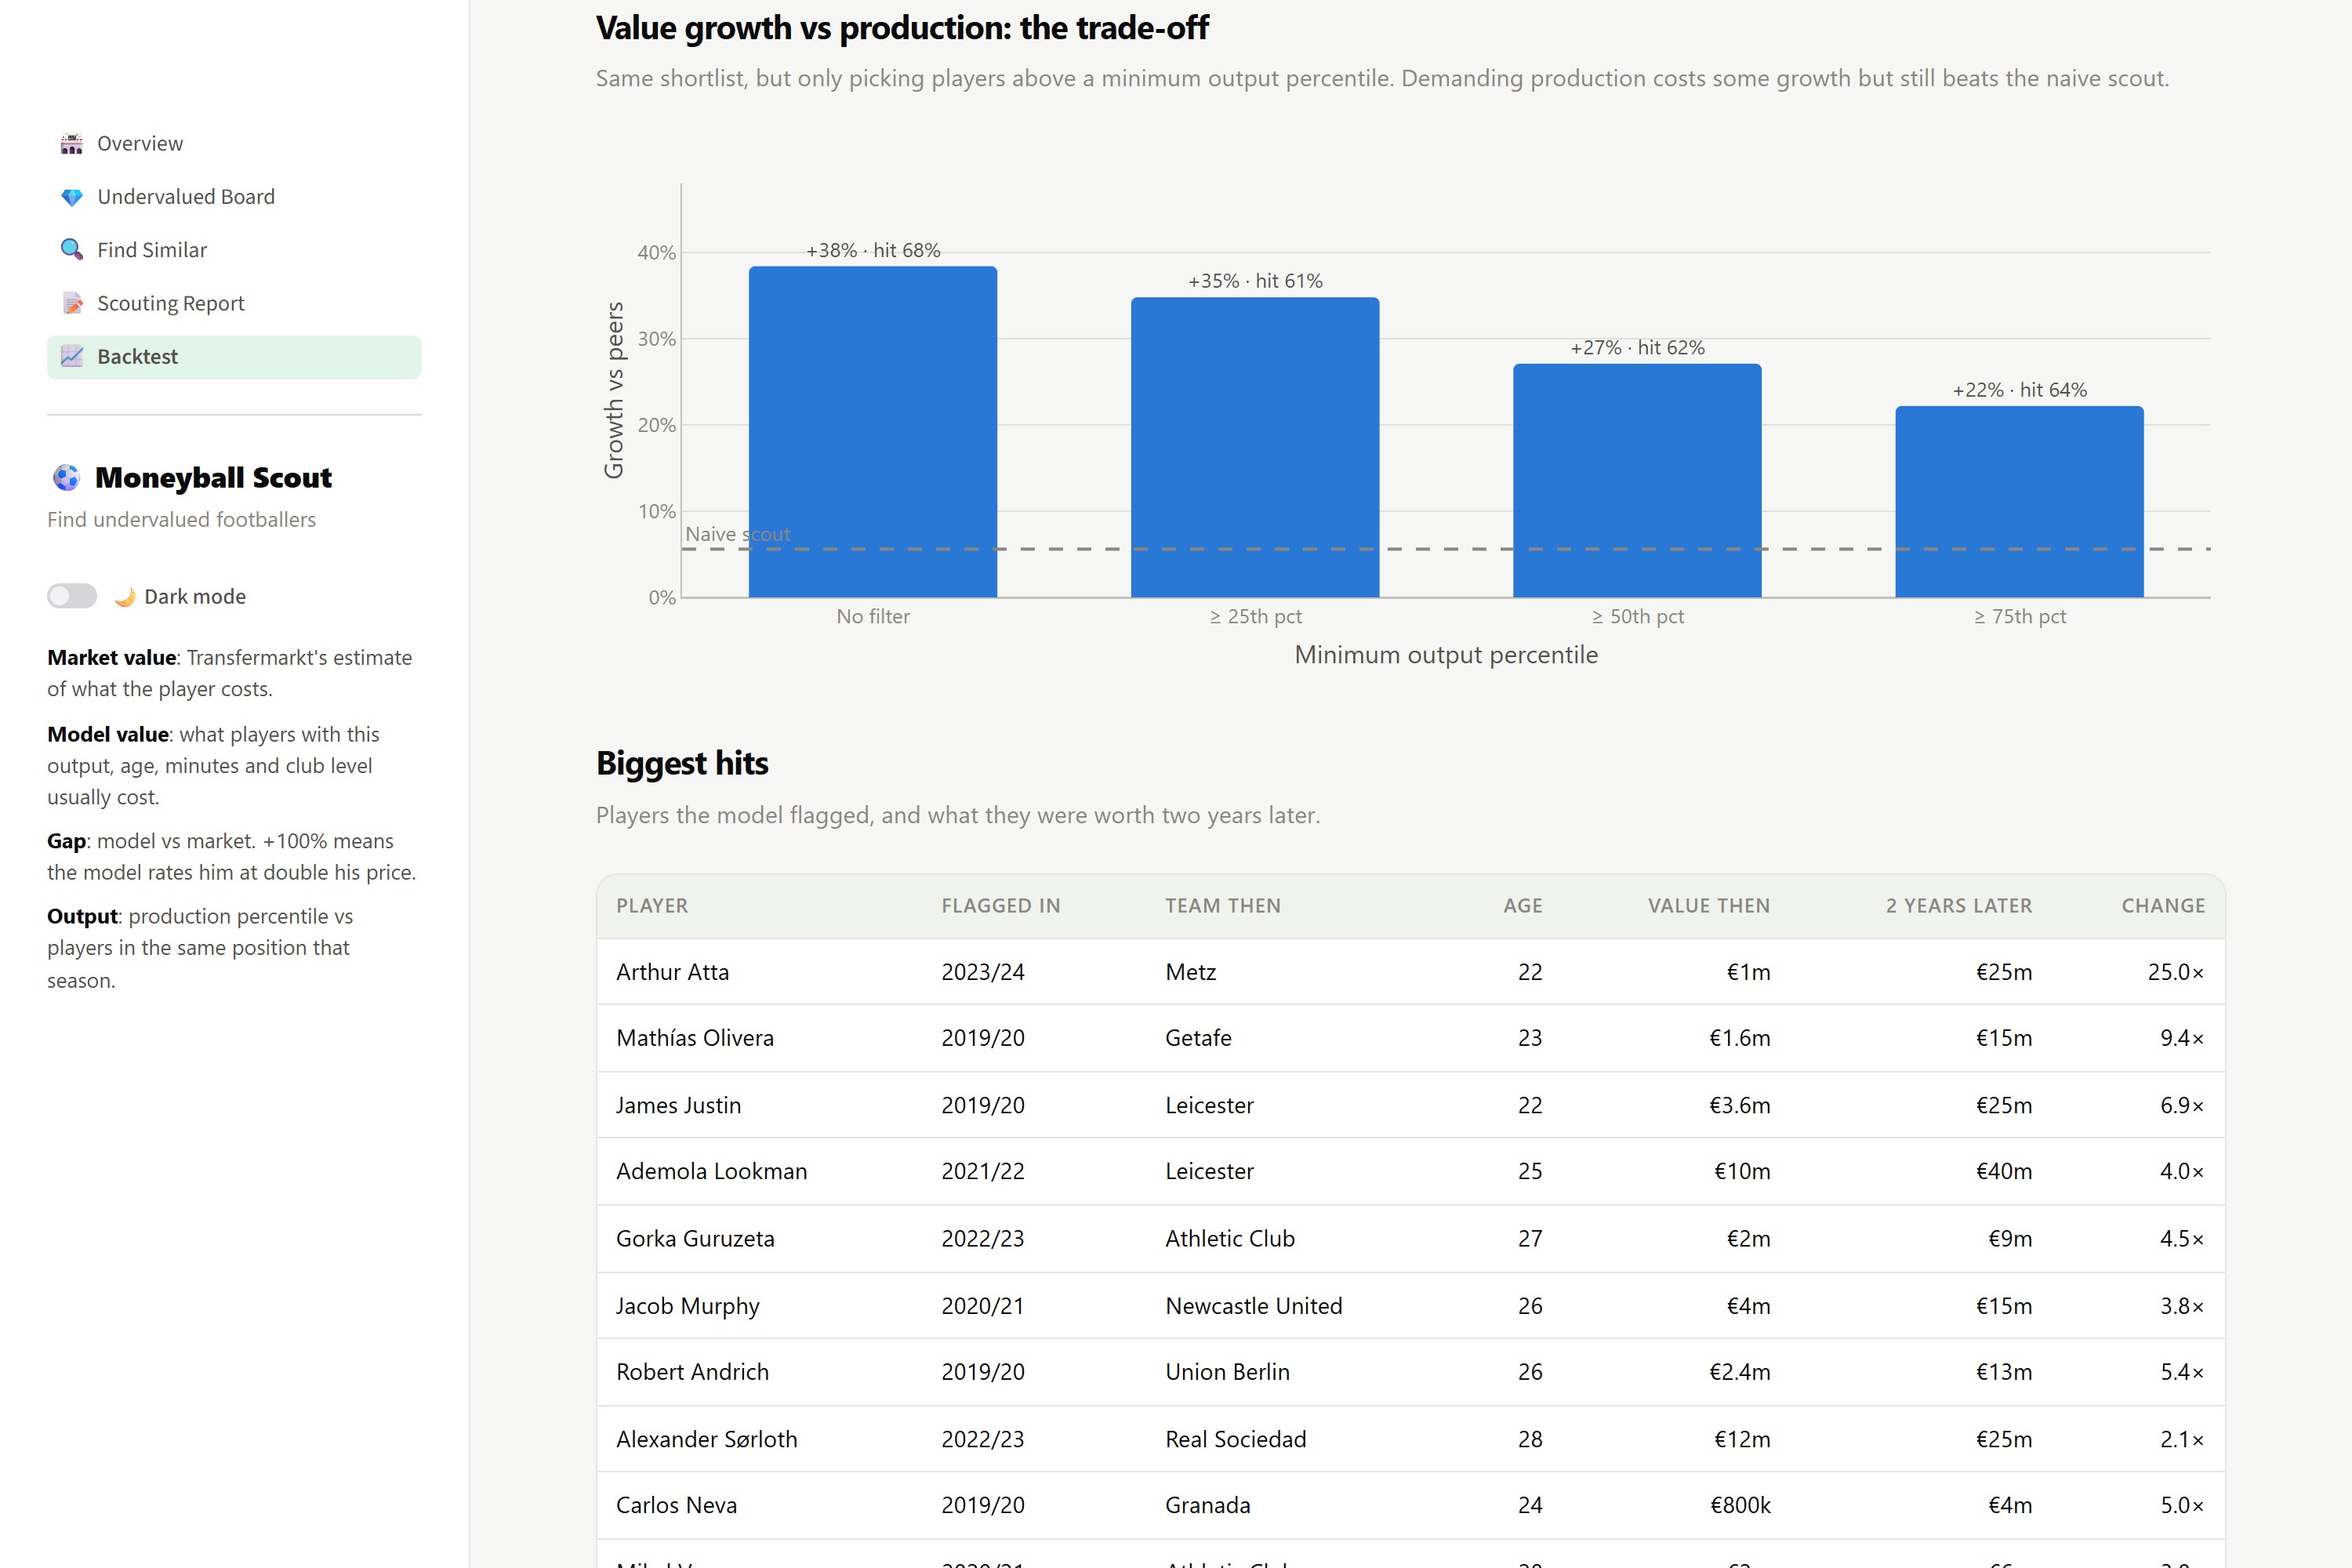
- Backtest: the evidence that the signal works.
How we built it
1. Data. We pulled per-player season stats from Understat (non-penalty xG, xA, xGChain, xGBuildup, shots, key passes, minutes) plus team strength (xG, xGA, points per game). We joined these to Transfermarkt market values from the open transfermarkt-datasets project.
2. Matching players across sources. The two sites share no player ID. We matched players who appeared for the same club in the same season, then applied strict name rules. A name counts as a match if one is a subset of the other ("Vinícius Júnior" vs "Vinícius José … Júnior"). Teammates who share a surname and first initial also match ("Joe" / "Joseph Gomez"). Shared surnames alone are rejected. This matched 98.8% of player-seasons with 900+ minutes.
3. The value model. A LightGBM regressor predicts log market value from per-90 output, playing time, age, position, track record, team strength and league:
$$\hat{V}_i = \exp\big(f(\mathbf{x}_i)\big)$$
Every prediction is made out-of-fold, grouped by player, so no player is valued by a model that has already seen him. The model reaches $R^2 = 0.85$ on log value. The scouting signal is the value gap:
$$g_i = \log \hat{V}_i - \log V_i$$
so $g_i = 0.69$ means the model rates a player at roughly double his market price.
4. Similarity search. We standardise each player's per-90 profile within a season, then rank players by cosine similarity:
$$\text{sim}(a, b) = \frac{\mathbf{z}_a \cdot \mathbf{z}_b}{\lVert \mathbf{z}_a \rVert \, \lVert \mathbf{z}_b \rVert}$$
5. The backtest. This is the part we're proudest of. For each season $s$ from 2019/20 to 2023/24, we trained only on seasons $\le s$, took the 25 most undervalued players under €30m, and measured their value two years later. A cheap young player rising in value proves nothing on its own, so we compared each pick against a control group from the same season, age band $a$ and value quintile $q$:
$$\text{excess}i = \log\frac{V{i,\,s+2}}{V_{i,\,s}} \;-\; \overline{\log\frac{V_{j,\,s+2}}{V_{j,\,s}}}\Bigg|_{\,j \,\in\, (s,\,a,\,q)}$$
6. The app. We built it in Streamlit with a custom light/dark theme, player cards and Plotly charts. Gemini (gemini-3.6-flash) writes the scouting reports, and the app caches and rate-limits every call.
Results
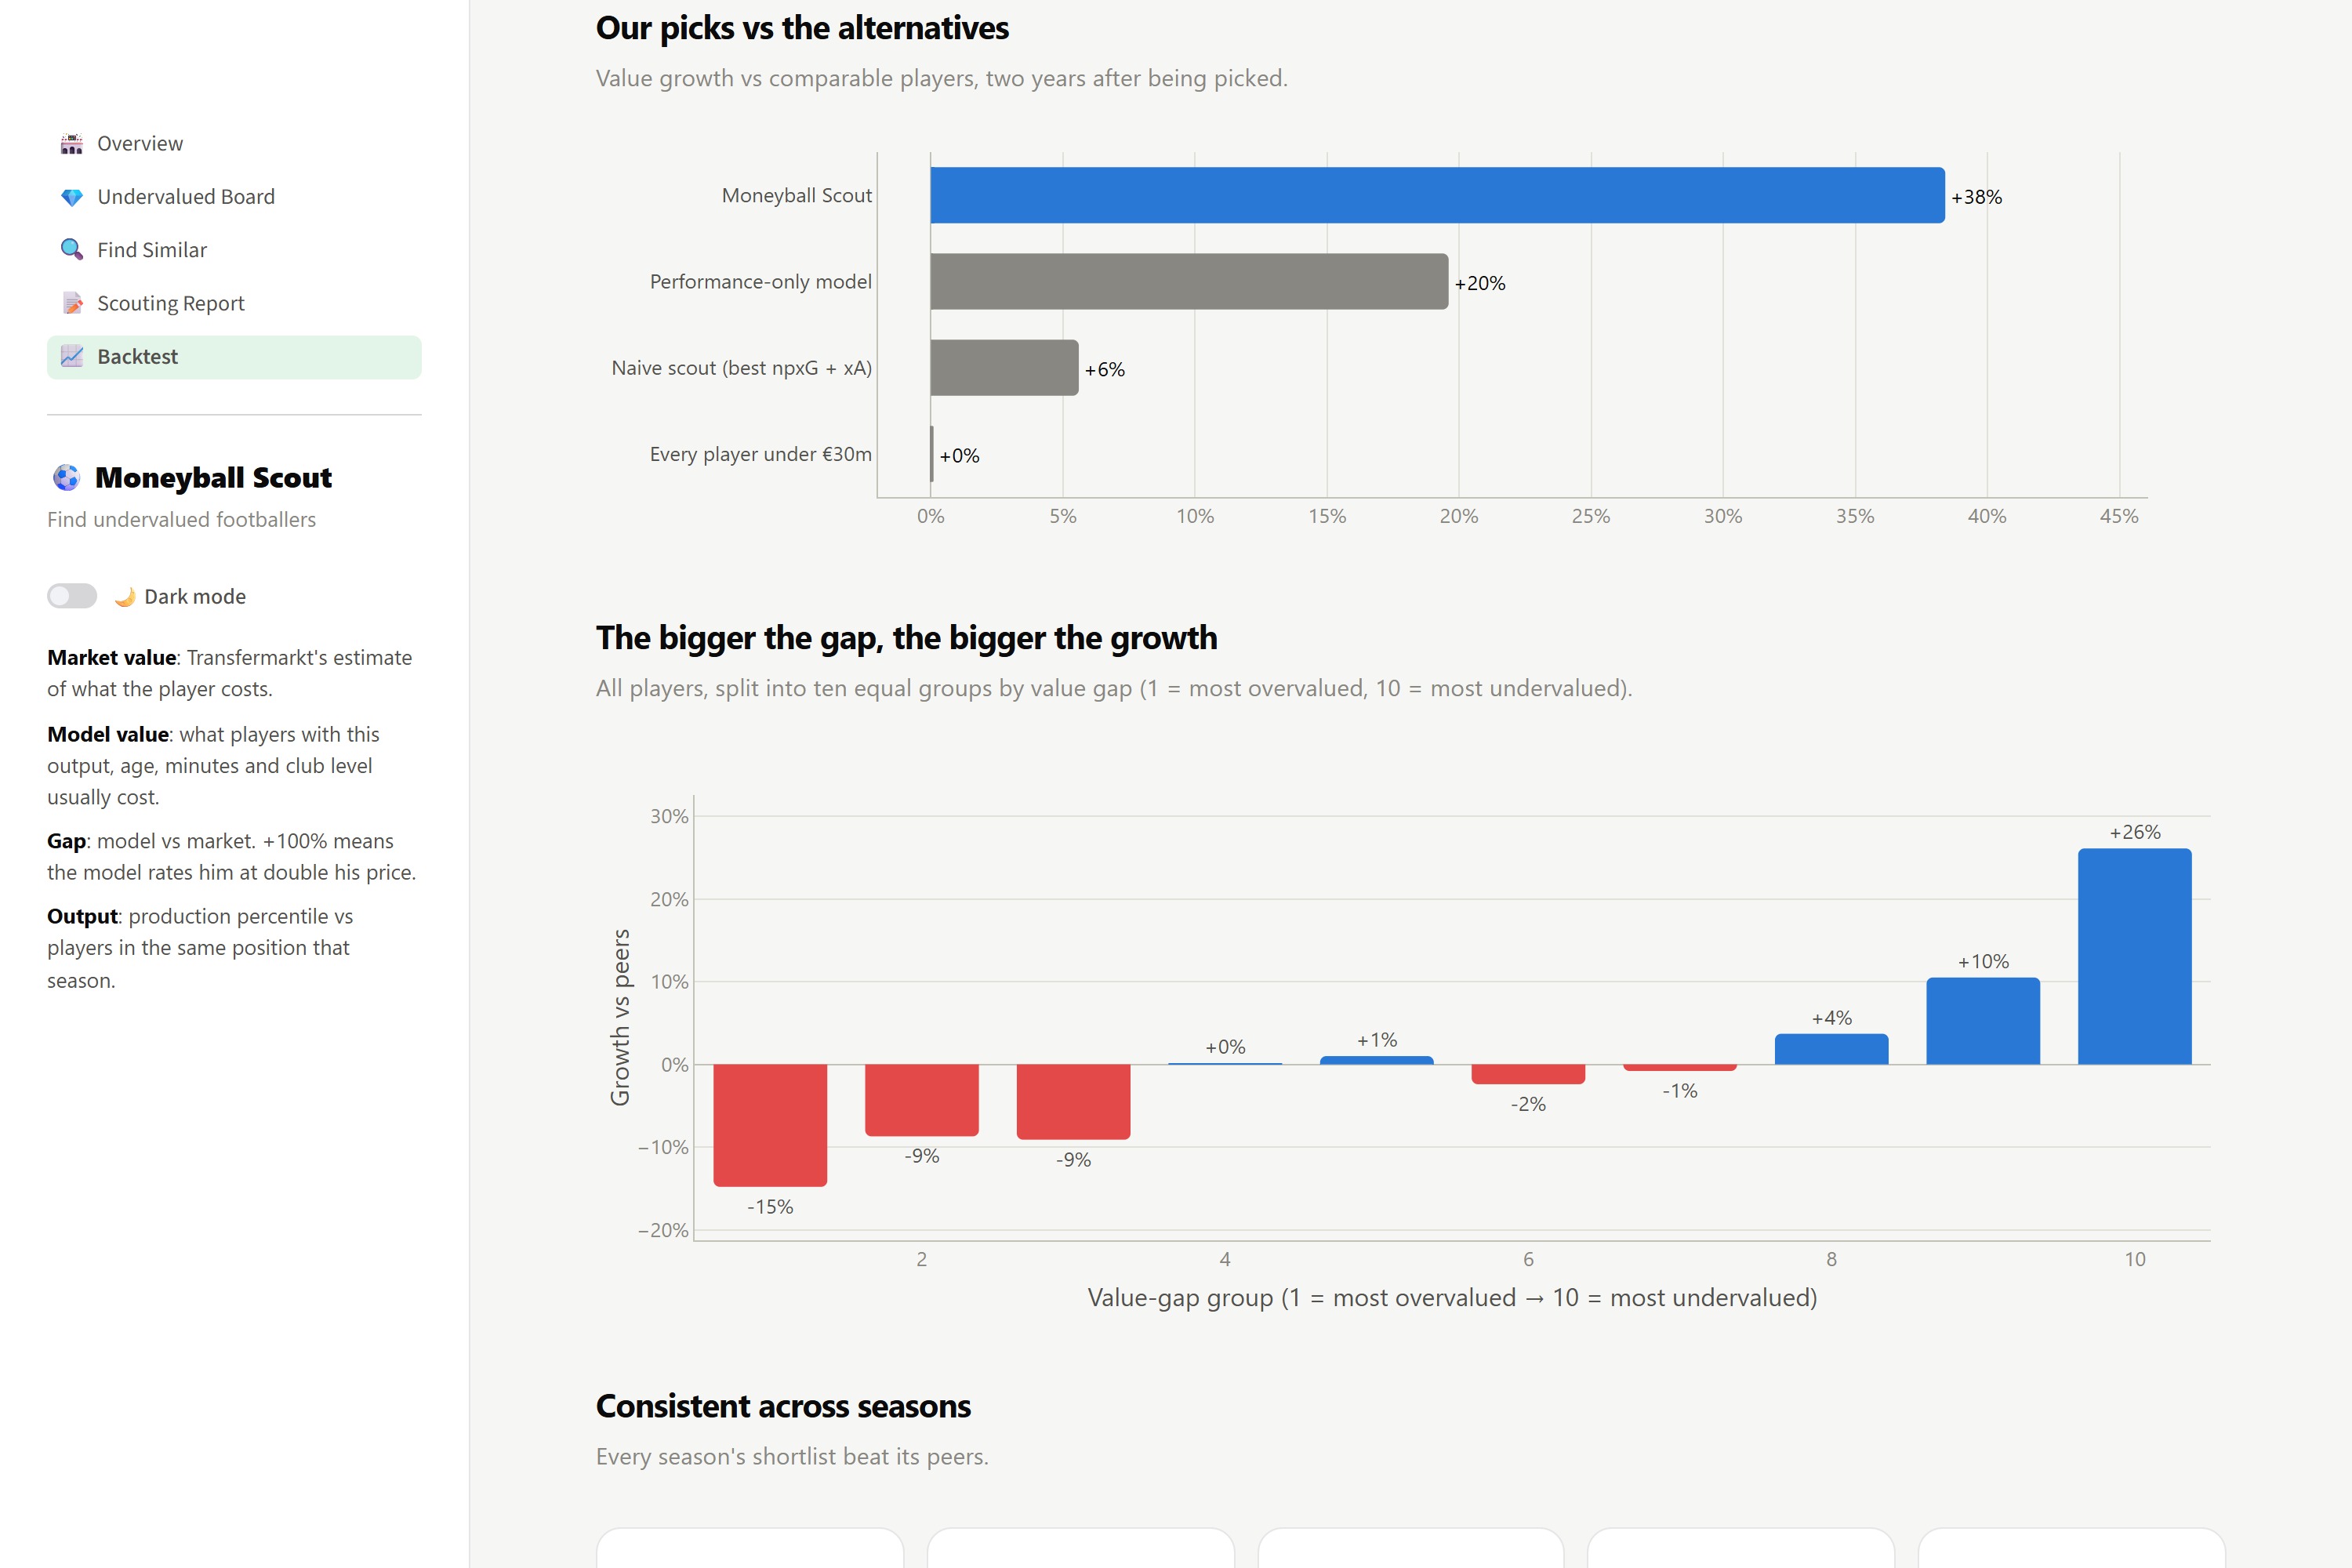
| Strategy (125 picks) | Value growth vs comparable players | Hit rate |
|---|---|---|
| Moneyball Scout | +38% | 68% |
| Performance-only model | +20% | 60% |
| Naive scout (best npxG + xA per 90) | +6% | 56% |
| Every player under €30m | 0% | 50% |
The effect is monotonic across all players: the most overvalued tenth lost −15% against their peers, while the most undervalued tenth gained +26%. Each of the five seasons' shortlists beat its peers.
What we learned
- The market pays for the badge. About 45% of the model's predictive signal comes from team strength and league rather than individual output. Surprisingly, the model that copies this market logic predicts future growth better (+38%) than a "pure performance" model (+20%). Its gap isolates players who outperform their club's market tier, and those players tend to get re-priced, usually through a transfer.
- The market rewards minutes and youth more than production. When we required picks to have at least 50th-percentile output, the edge fell from +38% to +27%. That's still far ahead of the naive scout, but it's a real trade-off. We exposed it as a slider in the app rather than hiding it.
- Honest evaluation matters more than model accuracy. A high $R^2$ is easy. Showing that the gap predicts the future, without look-ahead and against a fair control group, is the hard part, and it's the result that matters.
Challenges we faced
- A silent data trap. In Transfermarkt's valuation table, the club ID on every row is the player's latest club, not the club at the time. Our first matching pass quietly dropped or mismatched players who had moved, such as David Luiz and José Reina. We rebuilt club history from match-level appearance records instead.
- Name matching without false positives. Our first fuzzy matcher happily paired Marco Faraoni with Davide Faraoni. Tightening the rules without losing nickname matches (Matty/Matthew Cash, Max/Maximilian Kilman) took several iterations of auditing the weakest matches by hand.
- Avoiding leakage. Contract expiry dates and positions only exist as of the data snapshot, so we kept contract dates out of the model entirely. The walk-forward design ensures each season's picks use only information available at the time.
- AI reports cutting off mid-sentence. Gemini's reasoning tokens count against the output budget, so early reports ran out halfway through. Setting the thinking level to minimal fixed it. Because the app is public, we also cache each report for all visitors and cap generation per session and per hour, so the API key can't be abused.
- Our #1 pick was a bad advert. The top of the board was a 21-year-old with first-percentile creative output. The model liked his age, minutes and league; the AI report (correctly) said "Pass". That pushed us to measure the output trade-off properly and to show an output percentile on every player card.
Limitations and what's next
Understat has no defensive actions (tackles, interceptions, aerials), so defenders are only judged on ball progression. The 2019/20 cohort is flattered by the post-COVID market rebound, although the other four seasons still beat their peers by +25% to +34%. Market values are crowd estimates, not transfer fees. Next, we'd like to add event-level defensive data, model actual transfer fees, and extend to second-tier leagues, where mispricing is likely largest.
Built With
- python
- streamlit

Log in or sign up for Devpost to join the conversation.