-
Version by Version
Inspiration
Money can feel abstract in a banking app. We wanted to make spending feel local and understandable by putting it on the places where it actually happens: coffee shops, dining halls, restaurants, and stores around Blacksburg. MoneyMap turns a transaction list into a visual story of campus life.
What it does
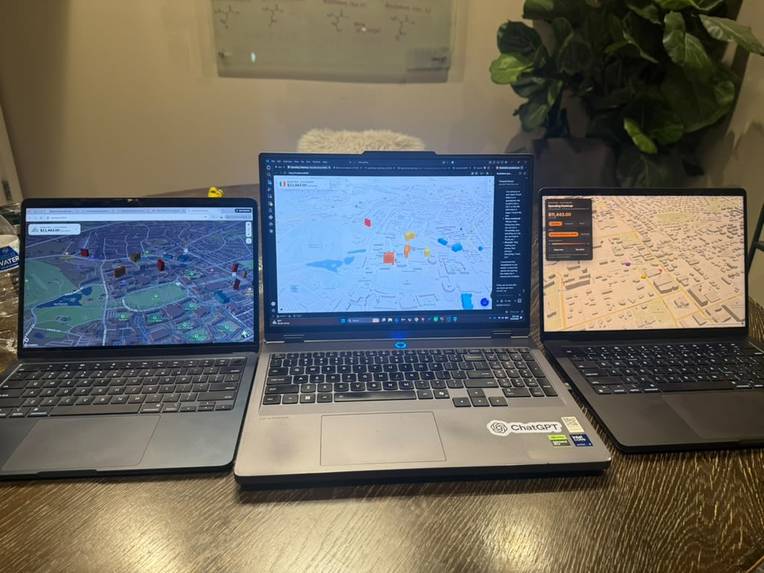
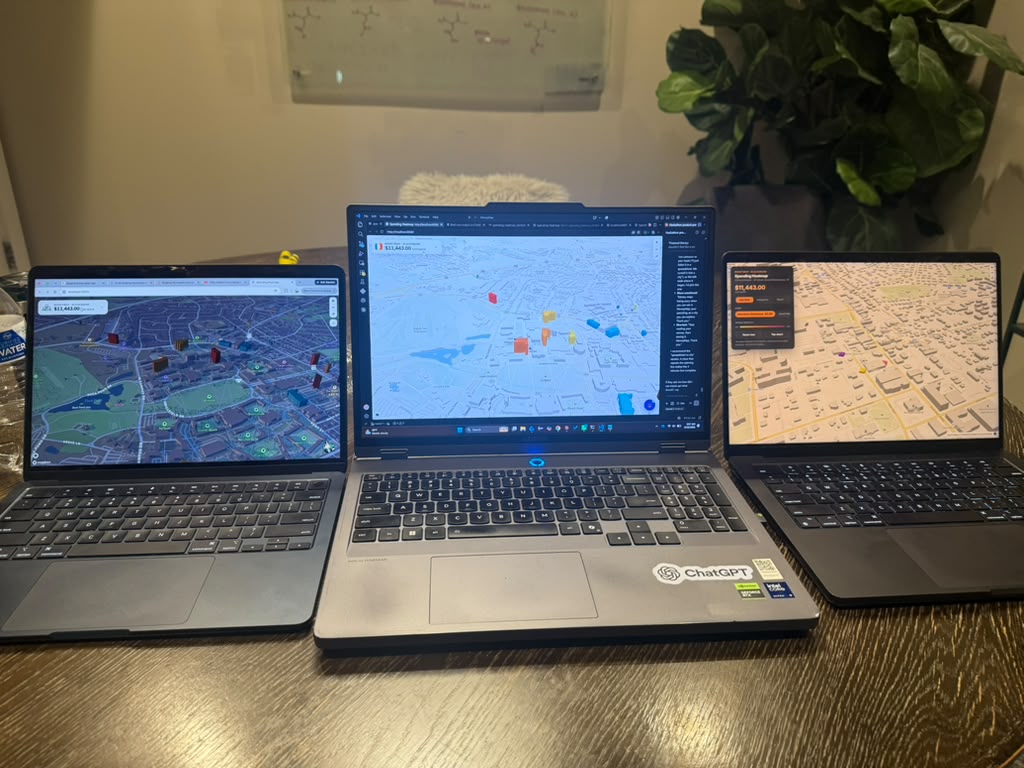
MoneyMap is an interactive 3D spending map for Blacksburg and Virginia Tech. It groups transactions by merchant, displays spending as color-coded building overlays, and lets users click a location to see its photo, transaction history, average visit cost, category breakdown, and a personalized insight
How we built it
We built MoneyMap with a FastAPI backend, PostgreSQL transaction data, and a Mapbox Standard 3D map. Python handles transaction aggregation, merchant data, catalog generation, and API endpoints. The frontend uses Mapbox GL JS to render the campus map, real building footprints, custom spending towers, location cards, and the interactive Mayor chat. We used Google Places-powered venue photos and curated campus coordinates so places such as Perry Place at Hitt Hall and Turner Place at Lavery Hall land on the correct buildings.
Challenges we ran into
The hardest challenge was location accuracy. Merchant coordinates can point to parking lots, nearby streets, or an entire campus rather than the exact building. We solved this by matching merchant pins to building footprints and adding precise overrides for important Virginia Tech dining locations. We also had to make the map visually understandable without overwhelming users. That meant balancing 3D buildings, heat colors, spending data, cards, controls, and chatbot UI while keeping the main map readable.
Accomplishments that we're proud of
• Turning raw spending data into a polished, interactive 3D campus experience. • Mapping purchases to realistic building footprints instead of generic map pins. • Building rich place cards with photos, transaction history, average spend, and insights. • Creating the Mayor, a friendly spending assistant with both quick questions and free-form chat. • Designing custom MoneyMap and Mayor branding that fits the map interface.
What we learned
We learned that financial data becomes much more meaningful when connected to real-world context. We also learned how much work goes into geospatial accuracy, especially when joining merchant transaction data with real buildings and local businesses. Technically, we gained experience with Mapbox GL JS, FastAPI, PostgreSQL, browser-side data visualization, API integration, and building an interface that tells a story instead of only showing numbers.
What's next for Money Map
Next, we want to add budgeting goals, monthly comparisons, personalized alerts, and recommendations for reducing spending at frequent locations. We also want users to upload or connect their own transaction data, support more cities, and add stronger privacy controls so MoneyMap can become a useful everyday financial companion.

Log in or sign up for Devpost to join the conversation.