-
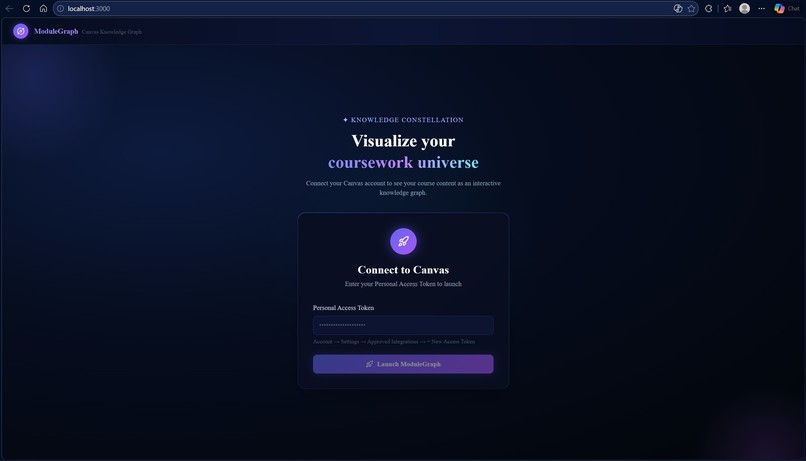
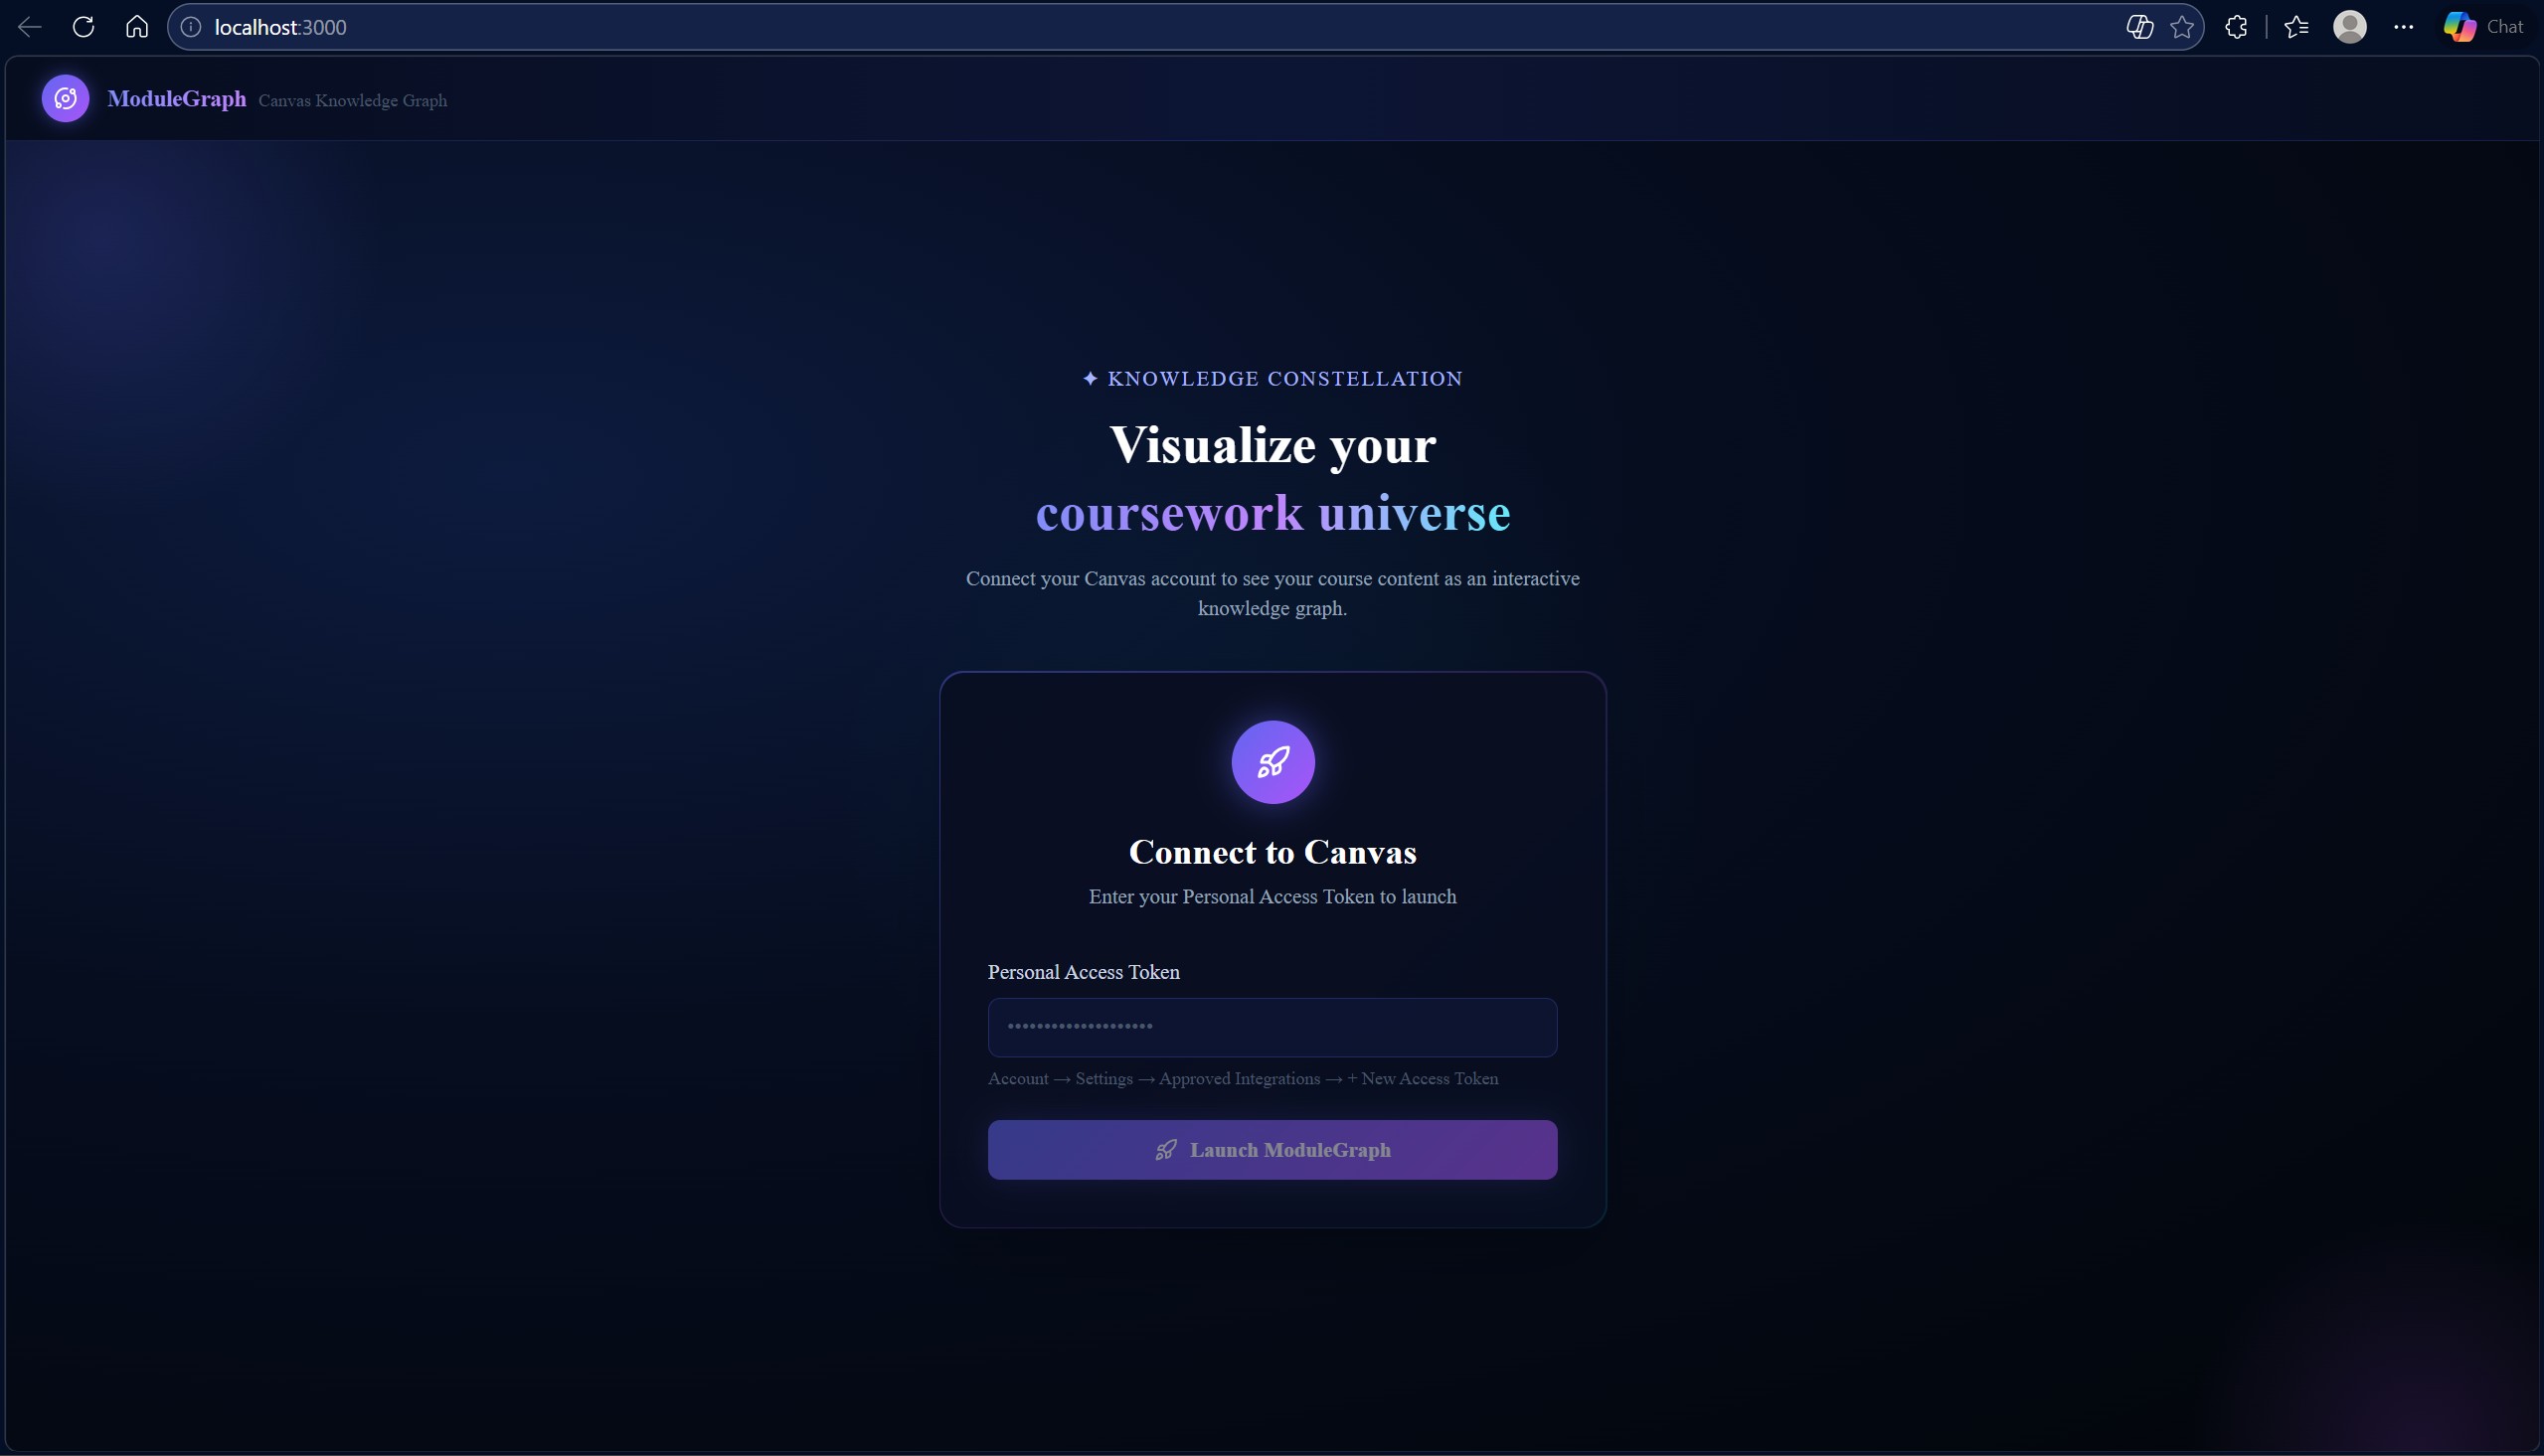
Login Screen where the user inputs their Canvas API, the instruction to get it are mentioned under the box where API is to be placed.
-
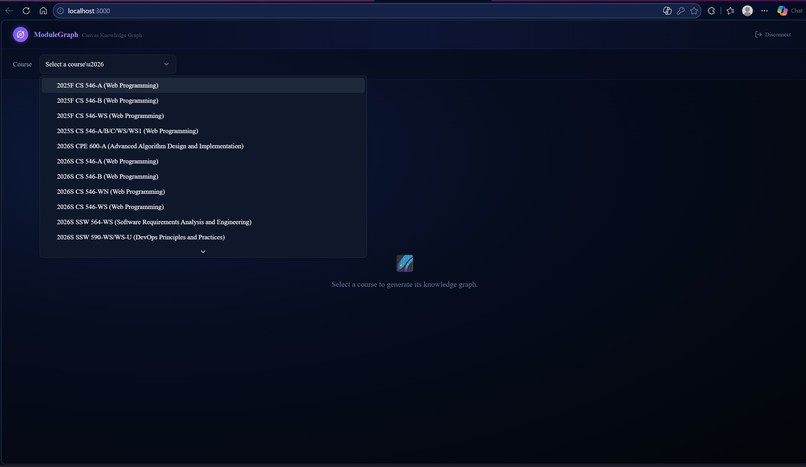
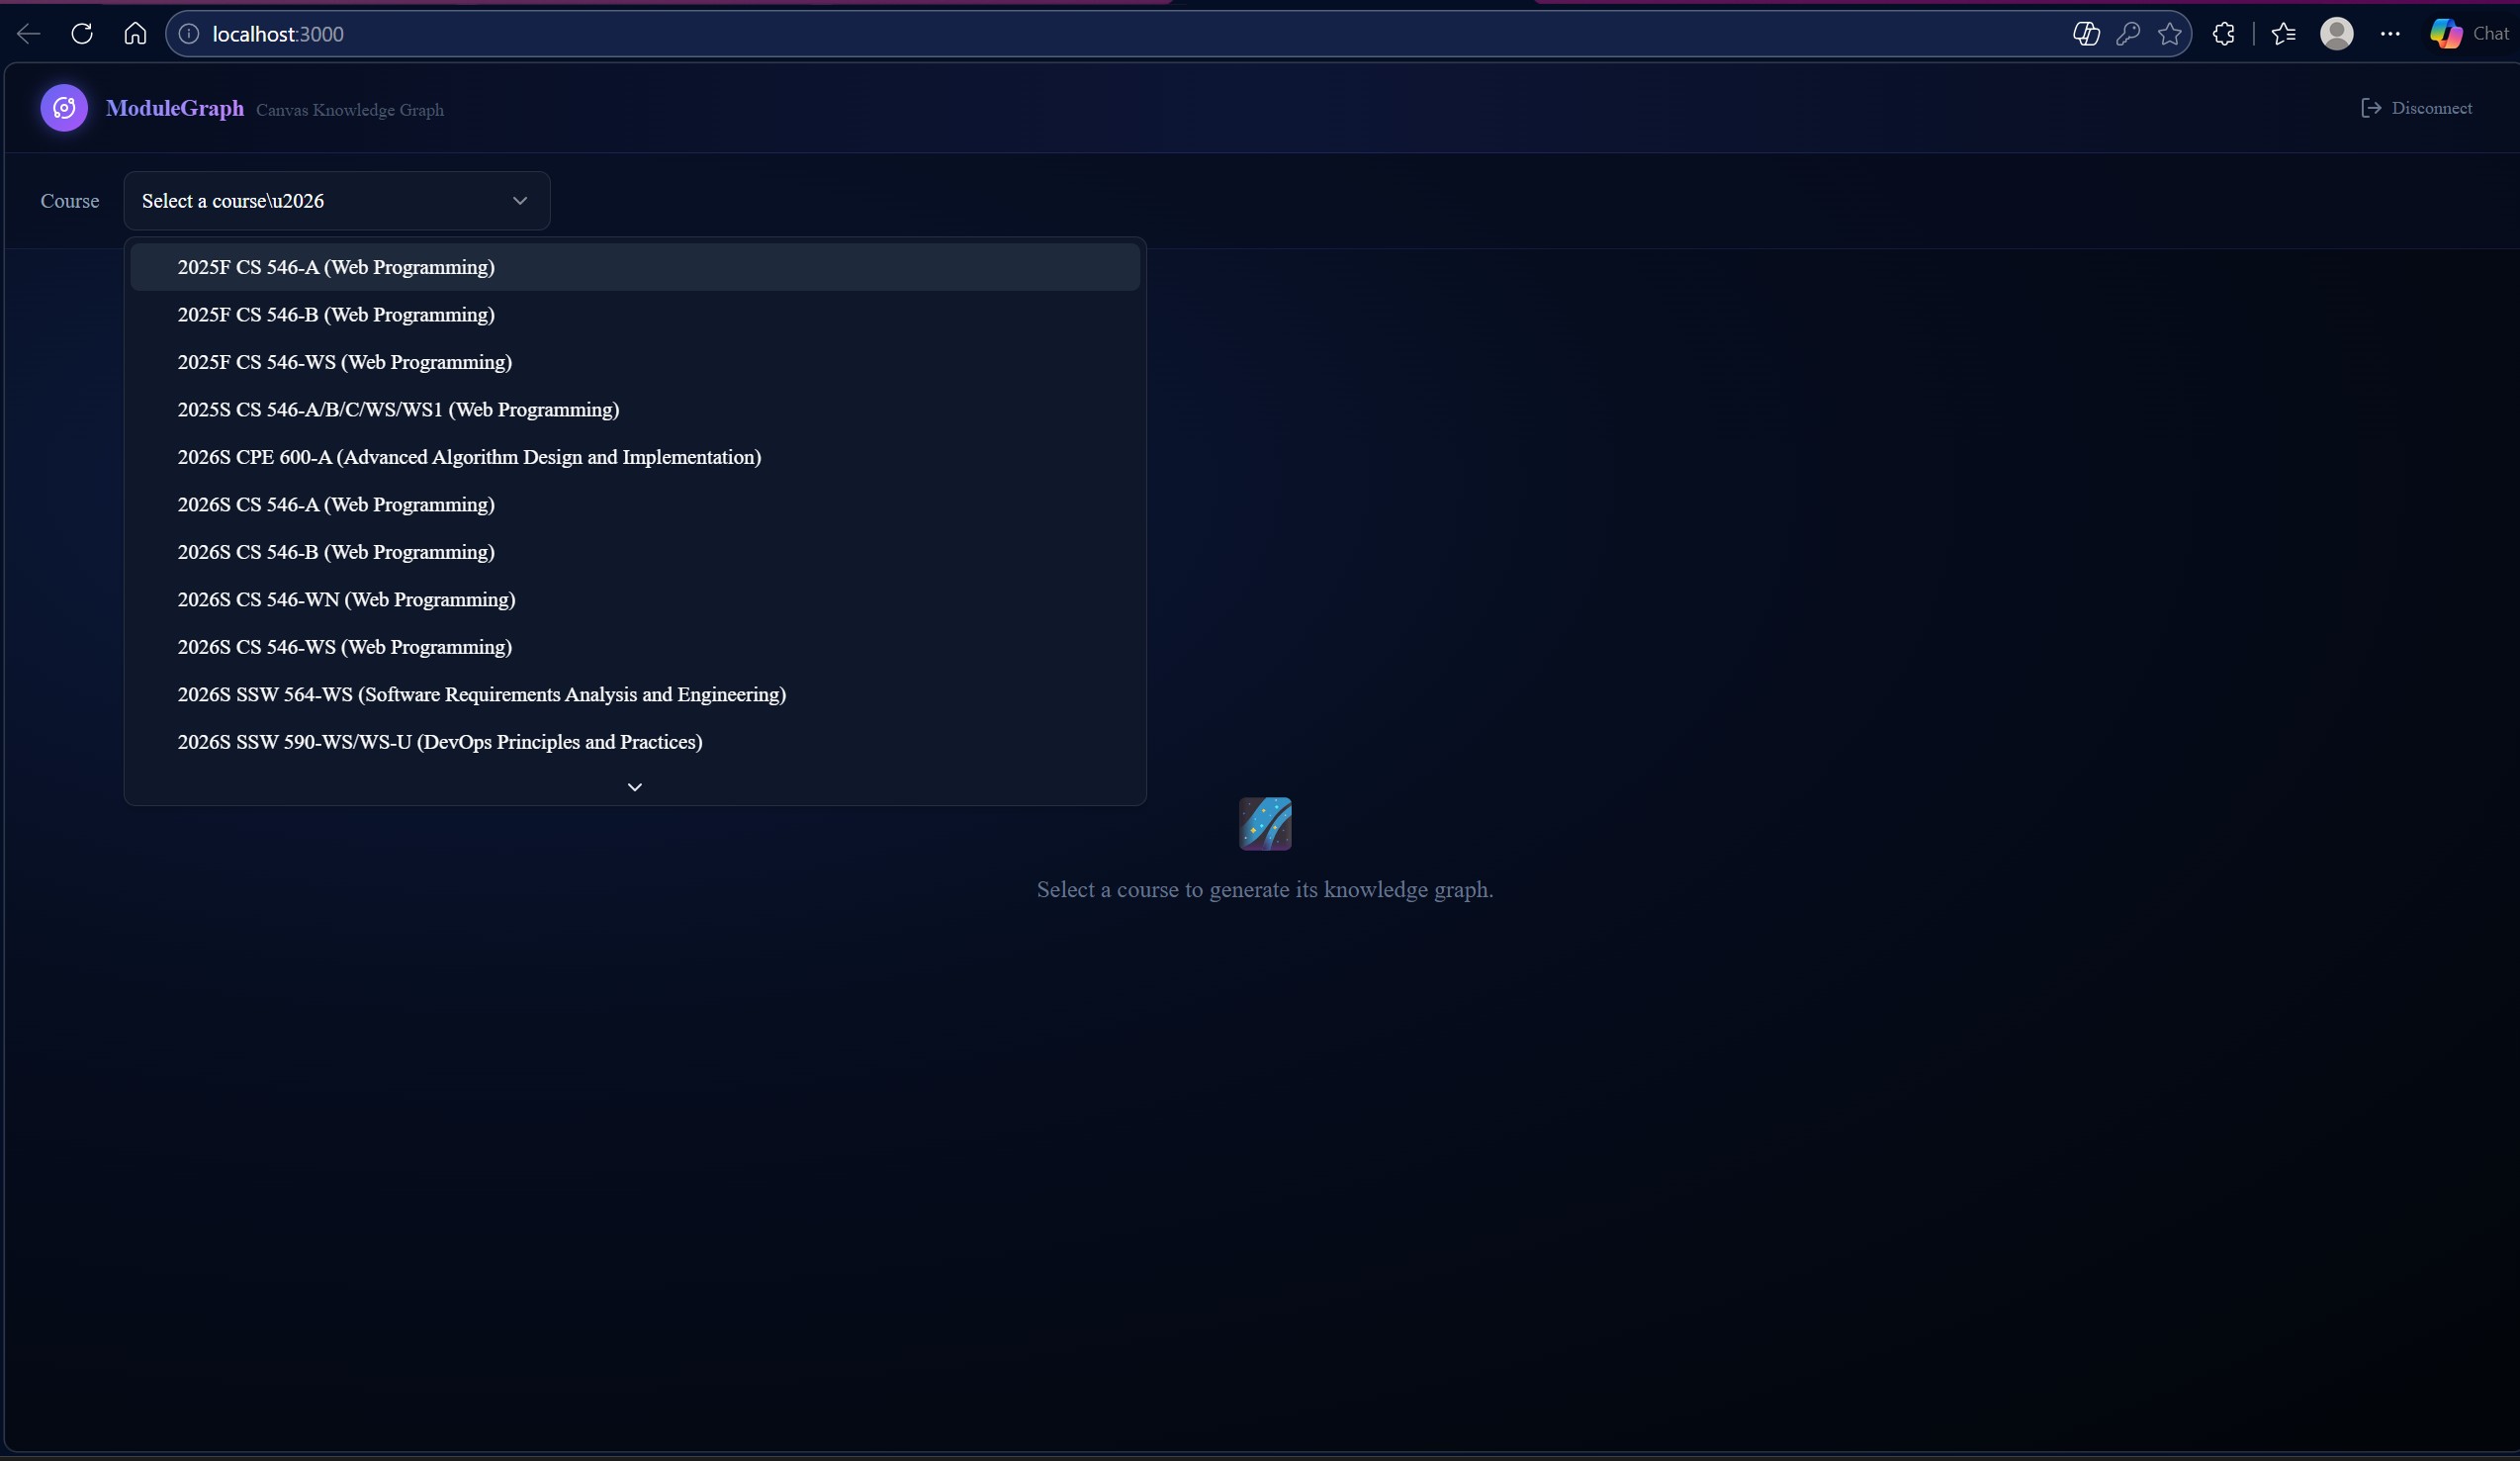
This screen occurs after after the user's API has been used to gather all the course data. A dropdown of it is shown
-
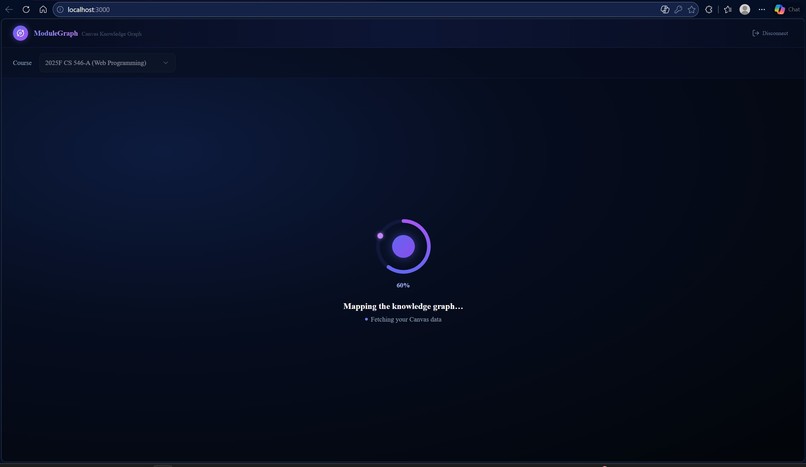
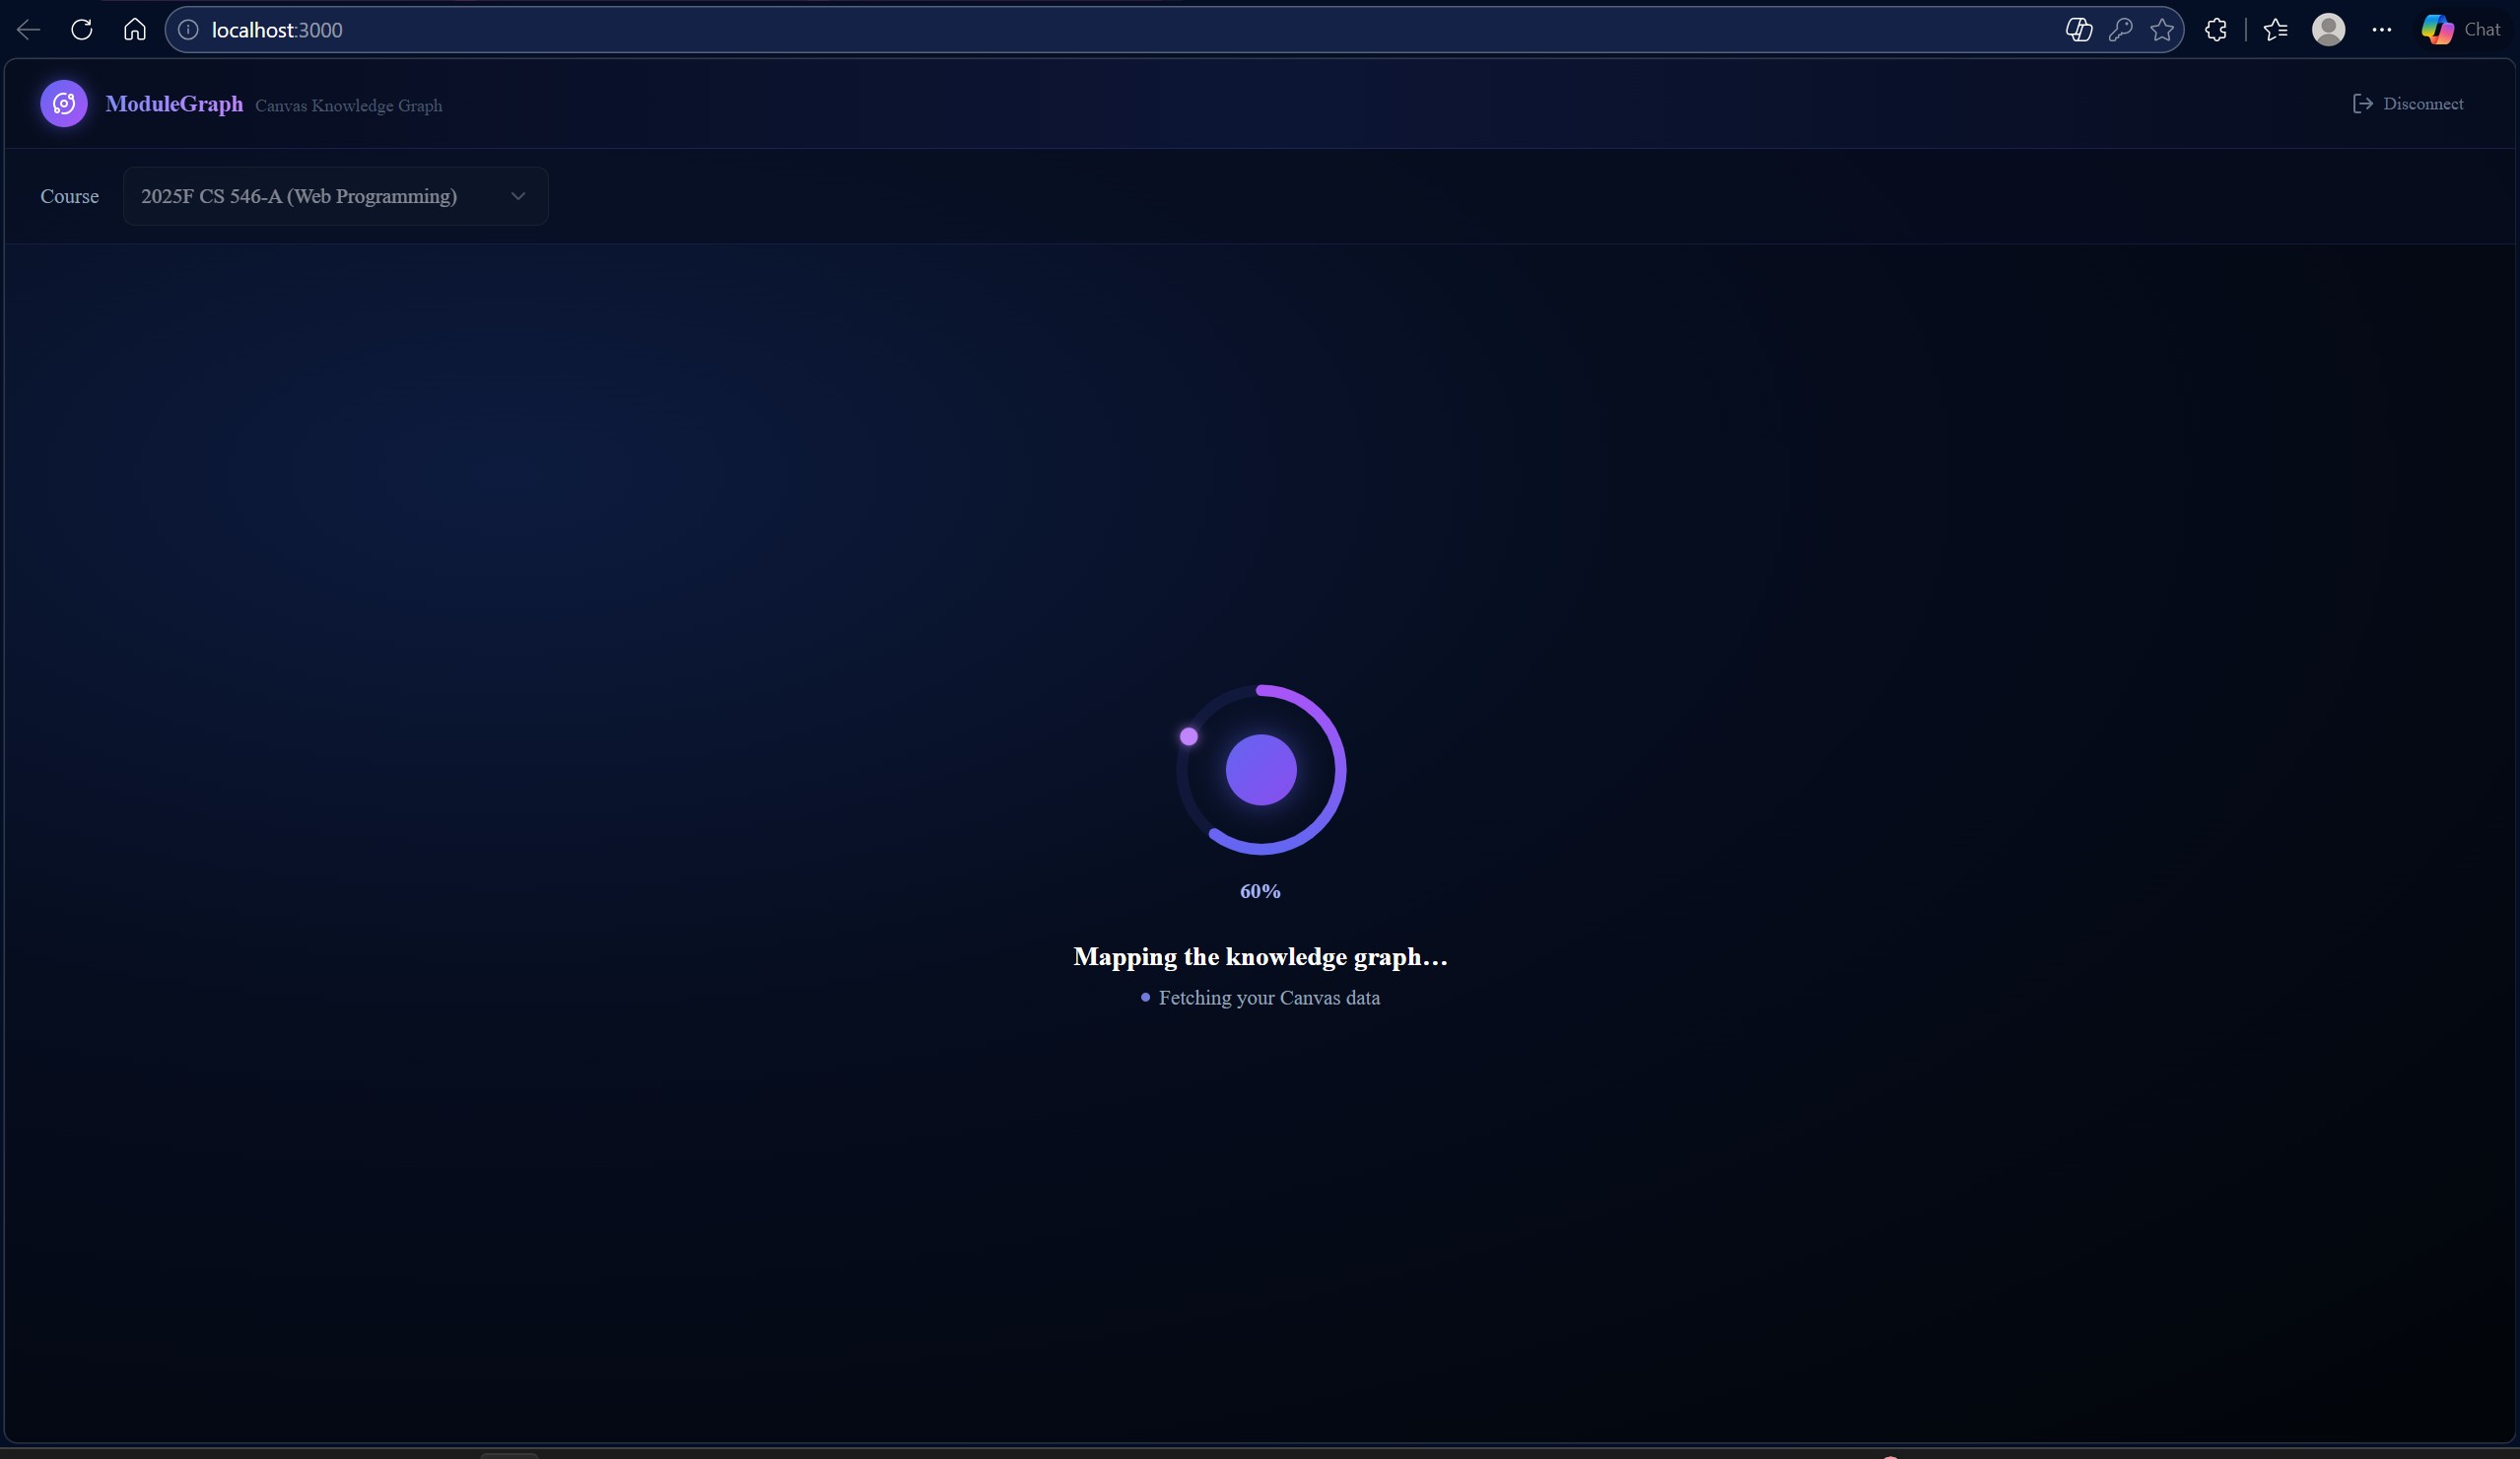
When you select a course, ModuleGraph uses Featherless API to build connections and a graph of modules and study material
-
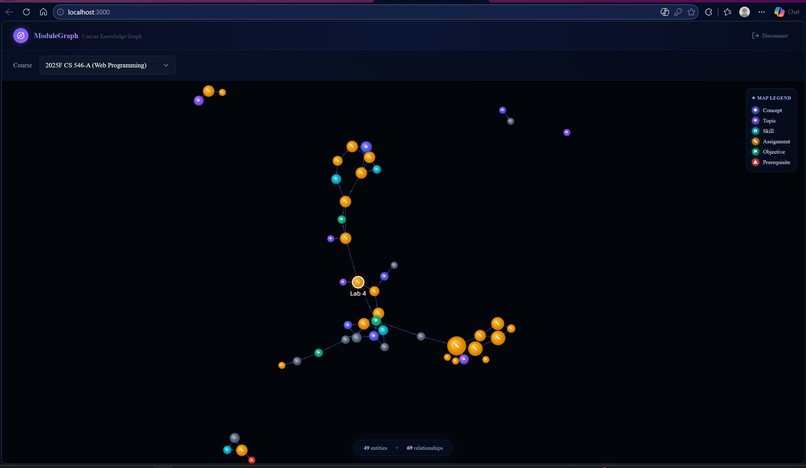
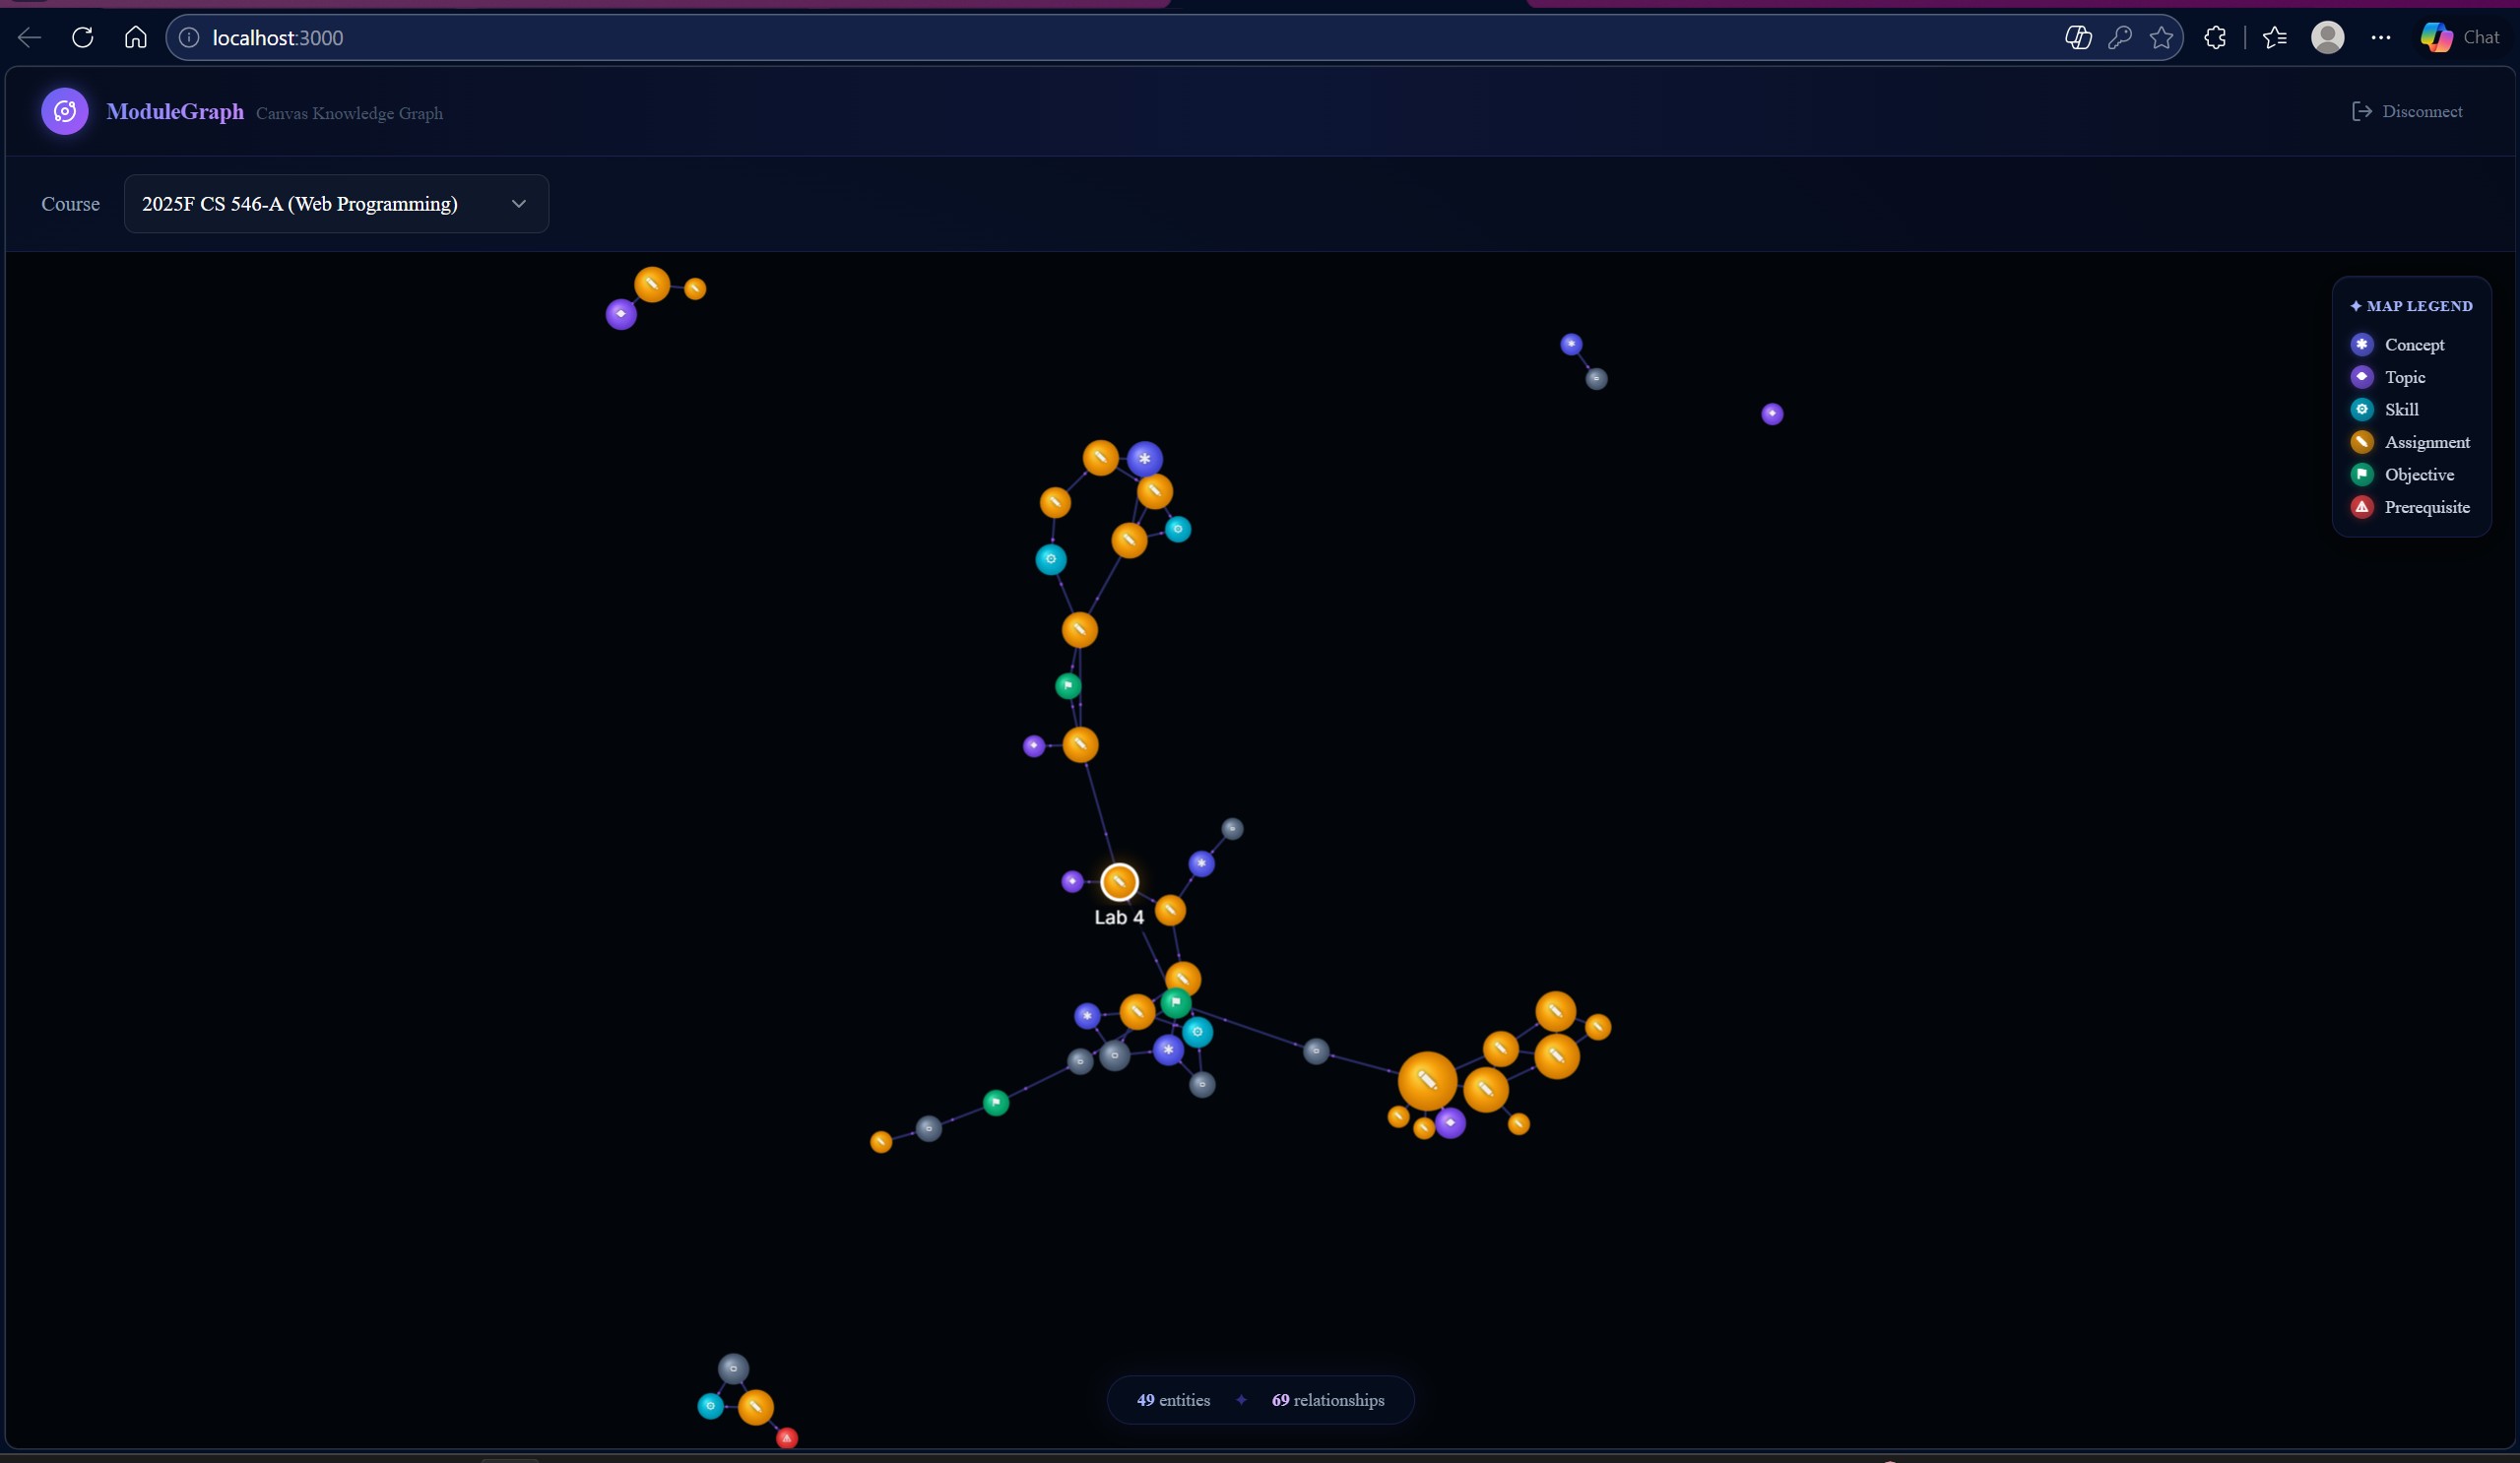
Graph for 546
-
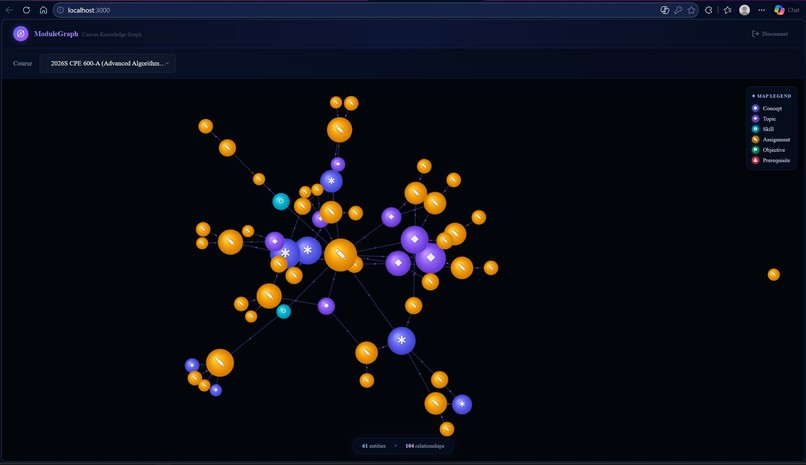
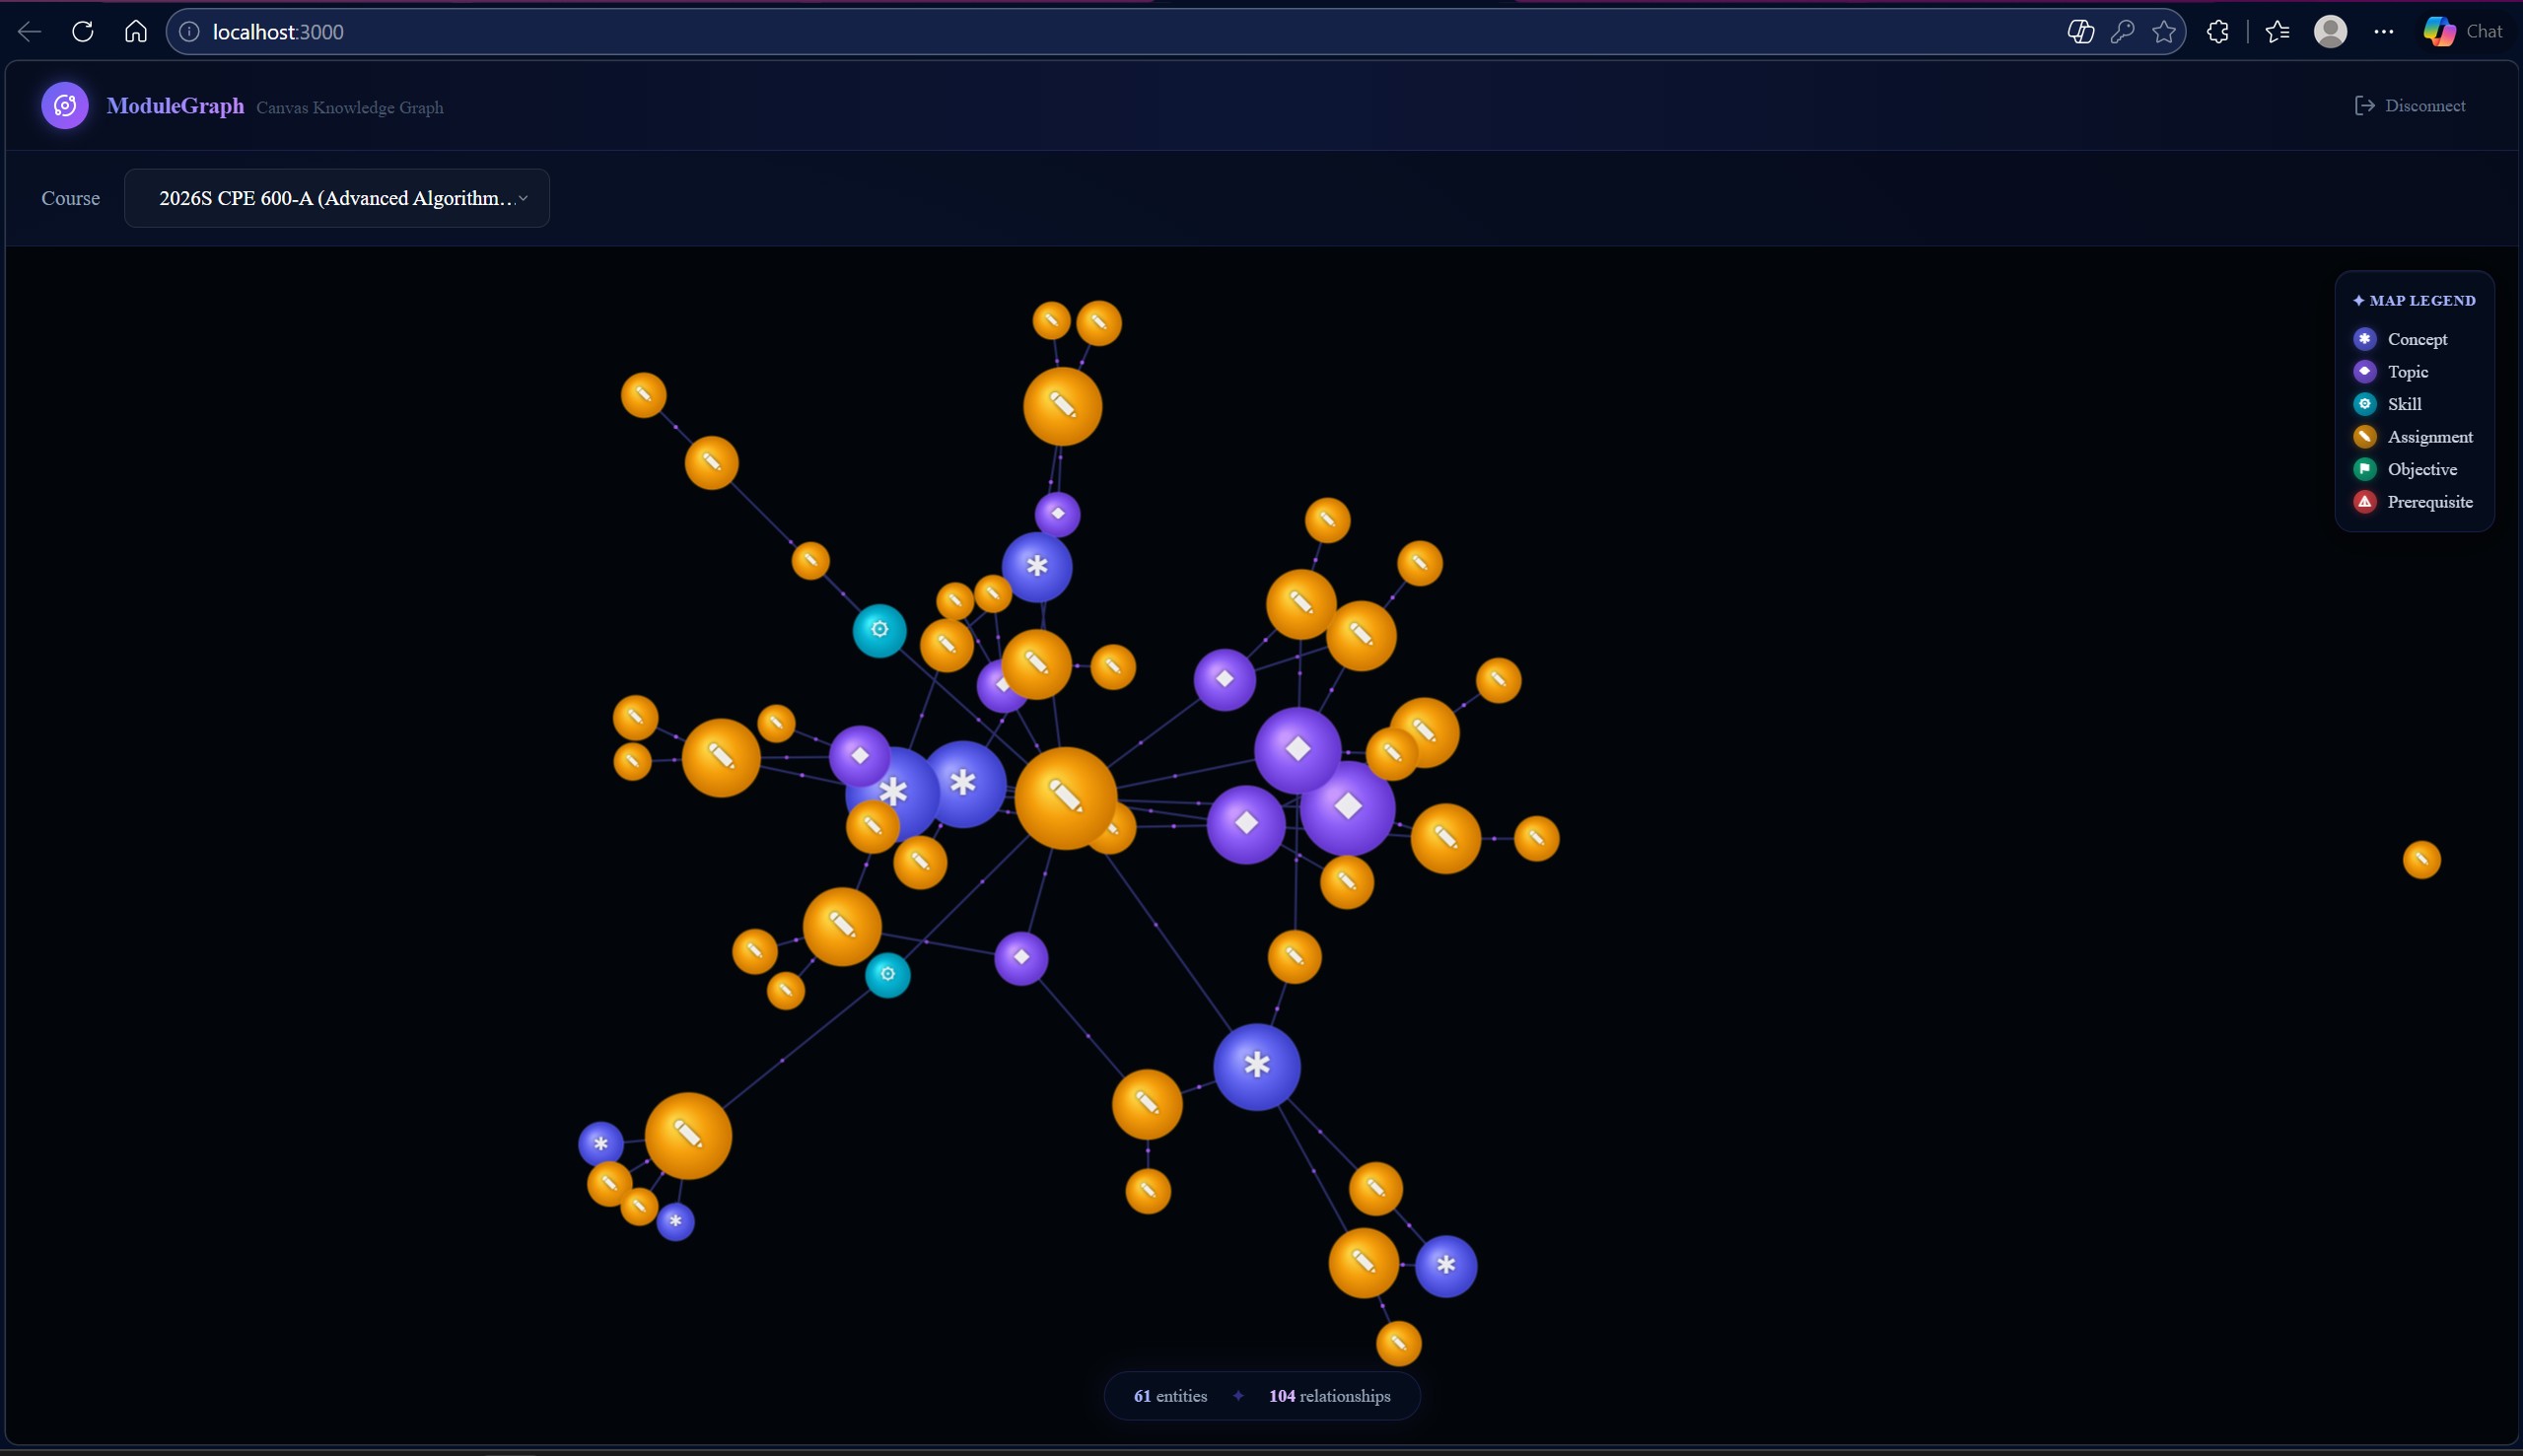
Graph for 600
-
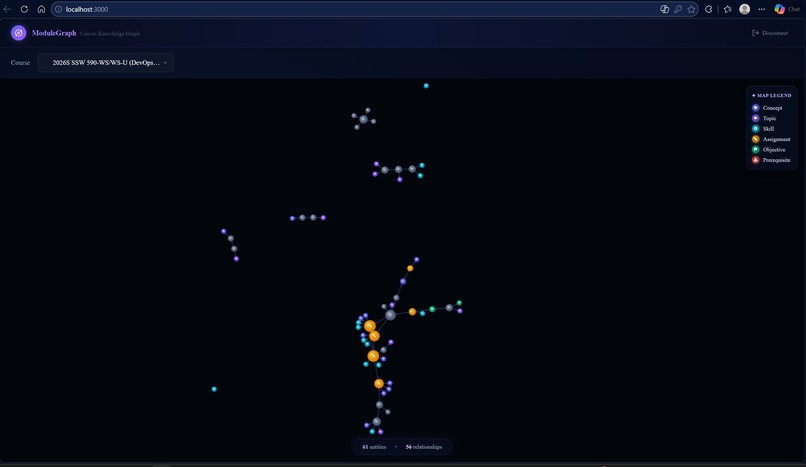
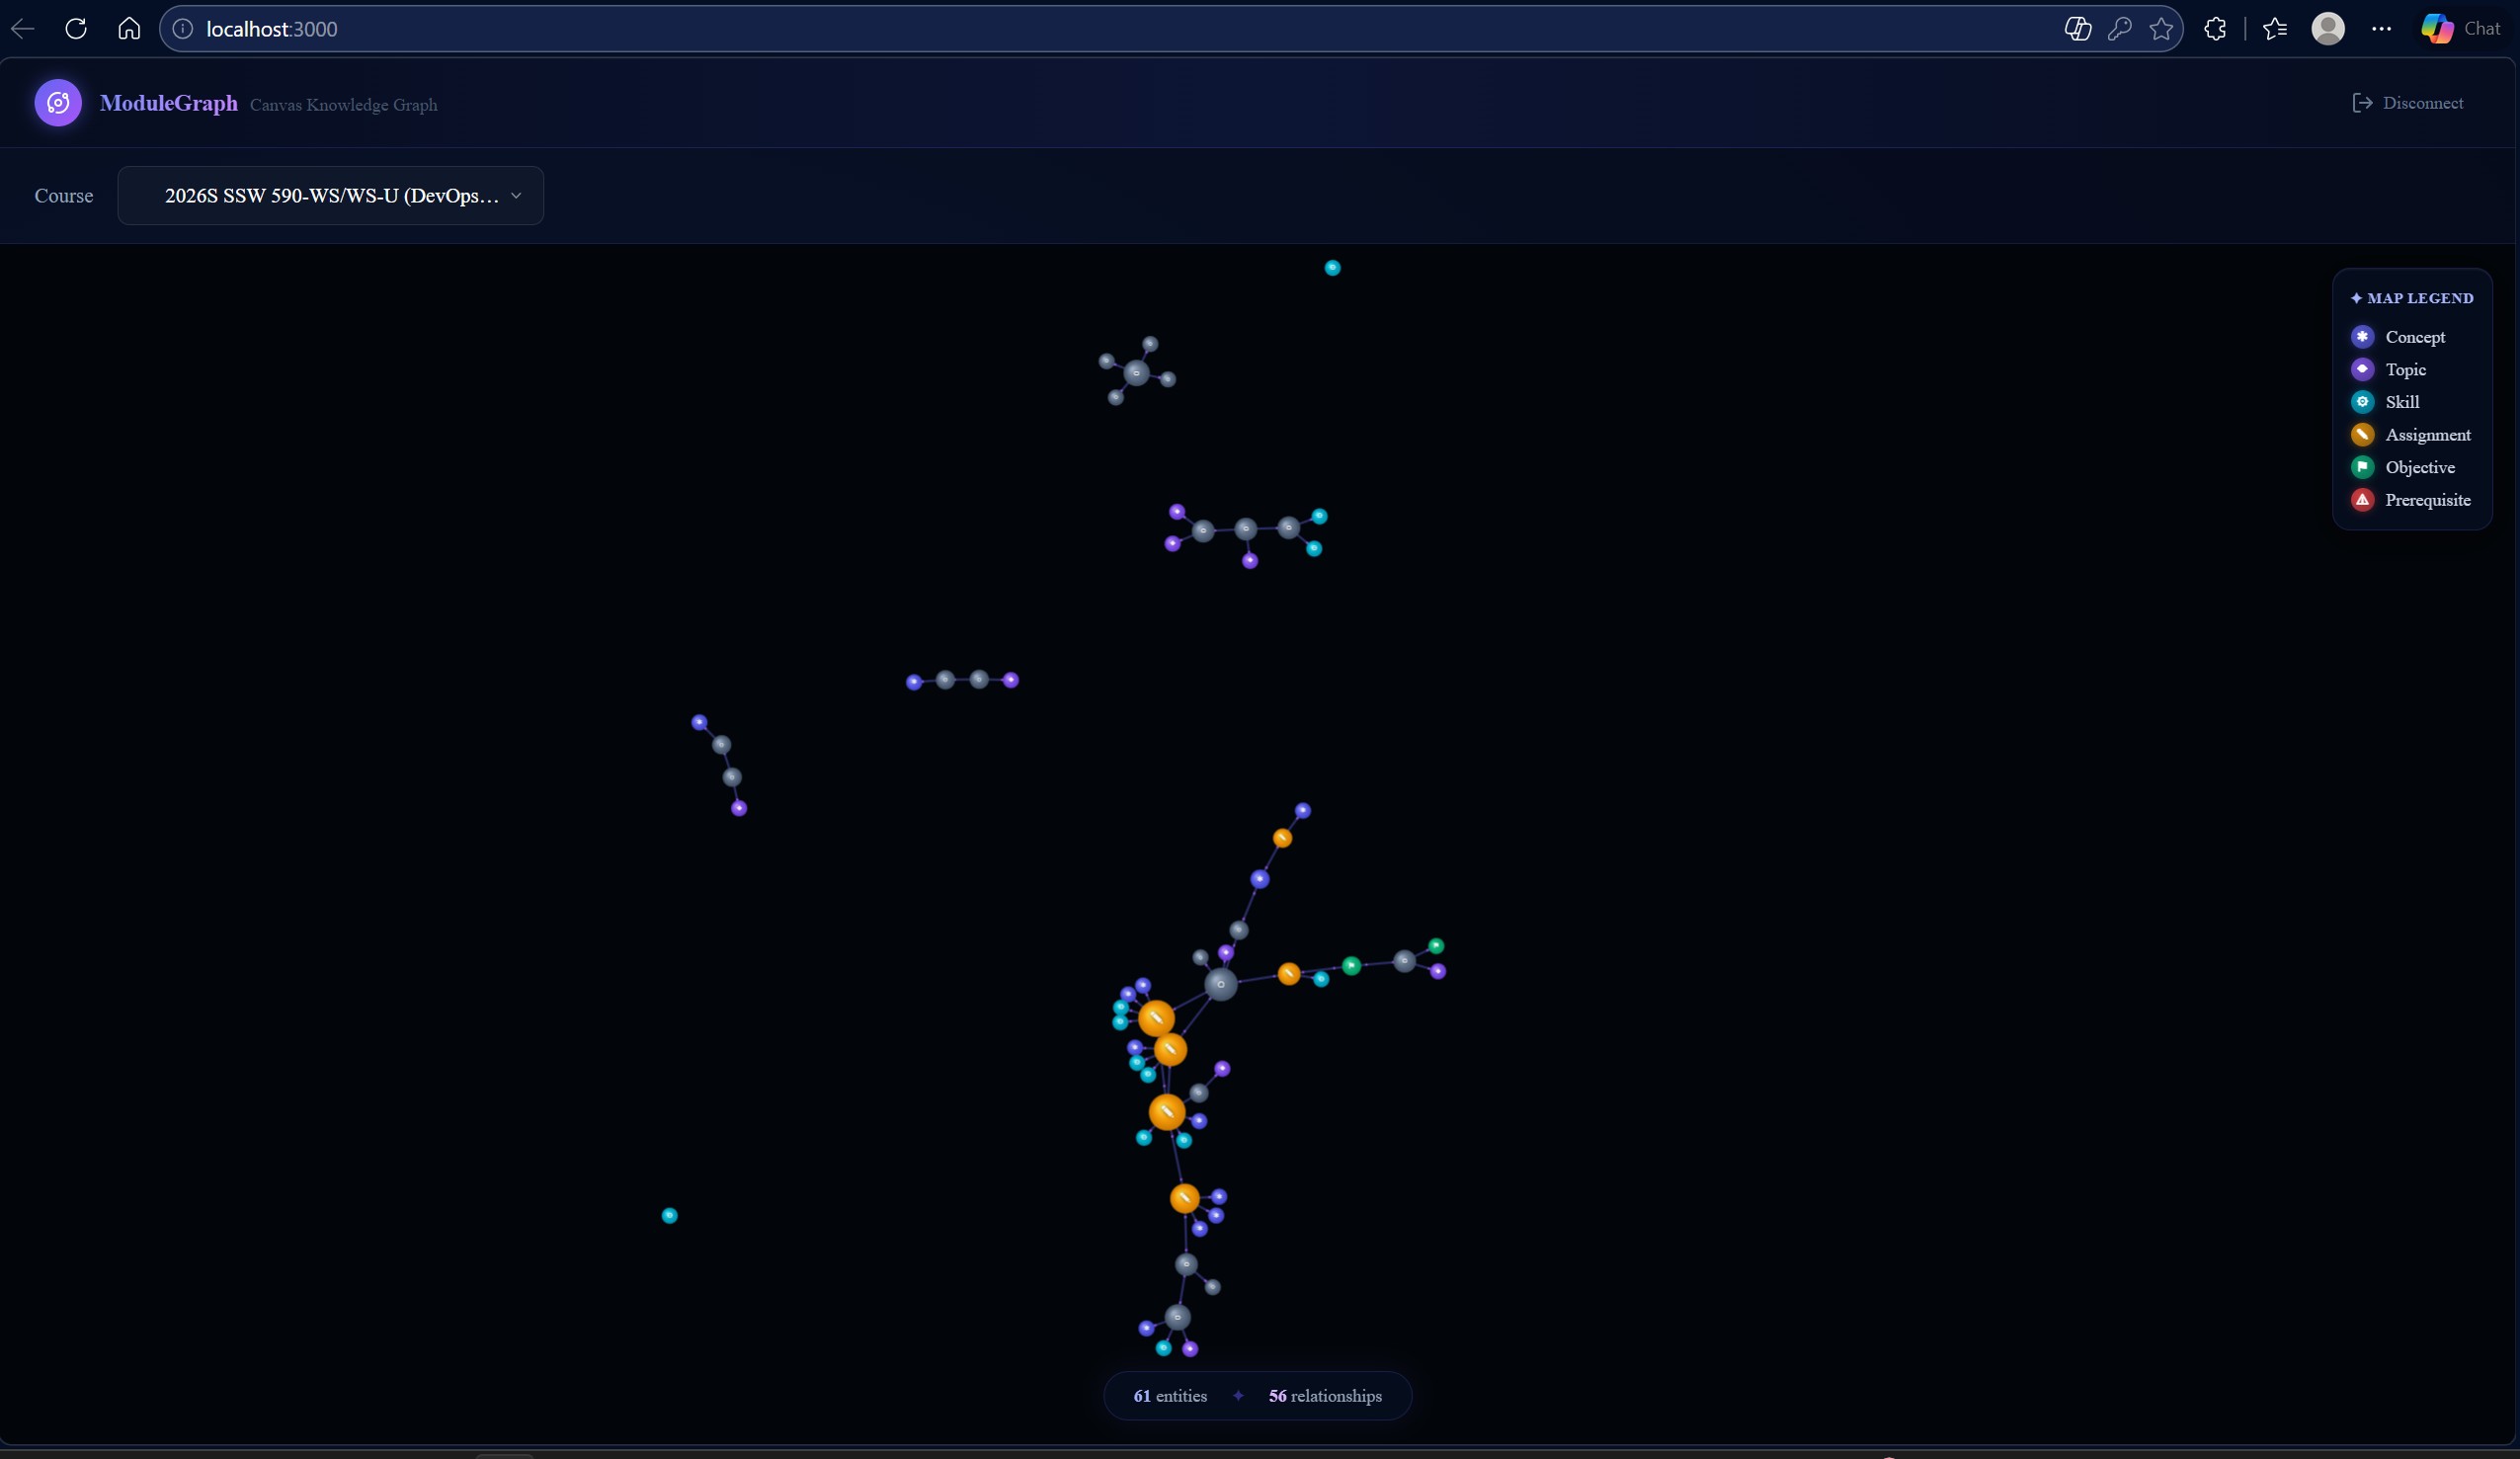
Graph for 590
Inspiration
We realized that many times it's difficult to organize your courses and the material you need to cover for each relevant item. If you're studying for a midterm, it takes significant time to visualize or understand why one concept was taught before another — what builds on what, what an assignment actually assesses, and how topics across a course are connected. Existing tools like Canvas present content as flat lists: modules, assignments, files. There's no map. We wanted to build one.
What it does
ModuleGraph connects to your Canvas LMS account and automatically generates an interactive knowledge graph of your course. You select a course, and within seconds the app:
--> Fetches your syllabus, module structure, and assignments from Canvas via its API
--> Sends that content to an LLM (Qwen3-4B via Featherless AI) which extracts academic entities — concepts, topics, skills, assignments, objectives, and prerequisites — and the semantic relationships between them
--> Renders everything as a living, interactive graph where nodes are color-coded by type and links show relationships like requirements, assessments, builds_on, covers, and precedes
--> Lets you click any node to see its type, name, and connection count in a detail panel
--> Hover over any node to see its full label
The result is a visual map of your entire course — you can see at a glance that Lab 3 builds on Lab 2, that both assess the concept of Dynamic Programming, and that Dynamic Programming requires Recursion as a prerequisite.
How we built it
--> Frontend: Next.js 15 (App Router) with TypeScript, Tailwind CSS, and shadcn/ui components. Node rendering uses the HTML5 Canvas API directly, each node is drawn with a custom nodeCanvasObject function that produces planet-style sphere gradients, glow halos, and hover labels. The space theme uses a seeded PRNG (mulberry32) to draw a stable 545-star starfield with nebula glow blobs on a element layered behind the force graph.
--> Backend: Next.js API routes handle all Canvas communication and LLM calls server-side to keep credentials out of the browser. We call the Canvas REST API to fetch the syllabus (/api/v1/courses/:id/syllabus), module structure with items, and all assignments including descriptions. This data is condensed and sent to Featherless AI running Qwen/Qwen3-4B-Instruct in a two-step prompting pipeline: first entity extraction (targeting 30+ named entities), then relation extraction (targeting 40+ subject-predicate-object triplets). The results are parsed, deduplicated by lowercased name, and assembled into a graph data structure by graph-transformer.ts.
--> Auth: Canvas Personal Access Token stored in React state via a custom useCanvasAuth hook, meaning no backend session needed.
Challenges we ran into
--> LLM output consistency: Getting the model to reliably return valid JSON arrays without preamble or markdown fencing required careful prompt engineering and regex-based extraction with fallback to empty arrays. We also had to tune temperature (0.2) to balance creativity with structure.
--> Graph connectivity: react-force-graph-2d mutates link objects in-place after the first layout pass, replacing string IDs with full node objects. On re-renders this caused links to silently drop. We fixed this with the nodeId="id" prop and careful data flow.
--> SSR with canvas libraries: react-force-graph-2d bundles aframe-extras and 3d-force-graph-vr which reference AFRAME as a browser global. This caused a hard crash in Next.js. The fix was switching from the monolithic react-force-graph package to react-force-graph-2d which has no VR dependencies. It was also difficult to render graph while use force graph
--> Canvas hover labels: React state updates don't trigger repaints of the force graph's own canvas animation loop. Hover labels only appeared after a full React re-render. We solved this by switching hoveredNode from useState to useRef, which the graph's animation loop reads directly every frame without needing React to re-render.
--> Inter font in canvas: CSS font loading doesn't apply to HTML5 Canvas ctx.fillText. We had to explicitly reference "500 12px Inter, sans-serif" in the canvas font string after ensuring Inter was loaded via next/font/google.
Accomplishments that we're proud of
--> A working end-to-end pipeline from Canvas API → LLM extraction → interactive graph in a single course selection
--> The space-themed UI with a procedurally generated starfield, planet-style graph nodes with radial gradients and glow halos, and glassmorphism panels — all built without any image assets or extra design libraries
--> The two-step LLM prompting architecture that reliably produces both entities and typed semantic relationships from unstructured syllabus and assignment text
--> Hover labels that work correctly by routing state through a ref rather than through React's render cycle
--> A fully type-safe codebase with well-separated concerns: Canvas client, extraction hook, graph transformer, and rendering all in distinct modules
What we learned
--> How to work with the Canvas LMS REST API and its quirks around syllabus HTML, module item types, and assignment descriptions
--> That force-directed graph libraries have their own internal state that doesn't play nicely with React's re-render model — and how to bridge the two with refs
--> How to write effective prompts for structured JSON extraction from academic text, including how to guide a small 4B parameter model to produce consistently parseable output
--> That seeded PRNGs are essential for any procedural rendering inside React — without a fixed seed, the starfield regenerated on every render
--> The difference between react-force-graph (includes 3D/VR, crashes in SSR) and react-force-graph-2d (2D only, safe)
What's next for ModuleGraph
--> Multi-course graphs: overlay two or more courses to see shared concepts and cross-course prerequisites
--> Study path generation: given a target assignment or exam, highlight the subgraph of everything you need to understand first
--> Progress tracking: mark nodes as "understood" or "needs review" and persist that state across sessions
--> Smarter LLM: upgrade to a larger model or fine-tune on academic content for denser, more accurate knowledge graphs
--> Graph filtering: filter by entity type, show only assignments, or isolate a single topic cluster
--> Export — download the graph as a PDF study map or export the entity/relation data as a structured JSON
Built With
- claude-code
- css
- featherlessapi
- html
- next.js
- tailwind
- typescript


Log in or sign up for Devpost to join the conversation.