-
-
 GIF
GIF
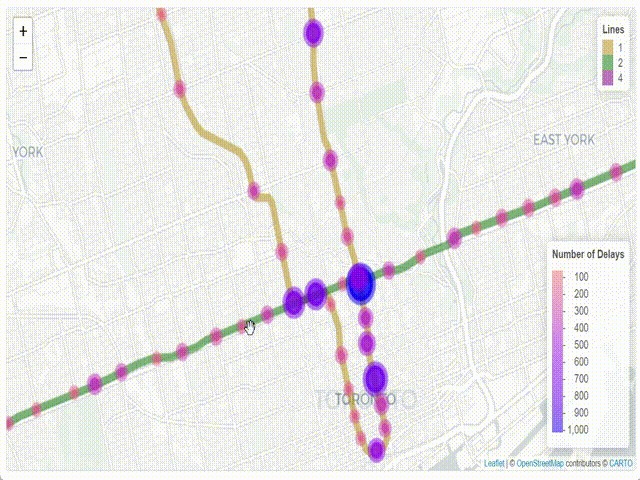
Geographic hotspots of subway delays in Toronto, 2024
-
 GIF
GIF
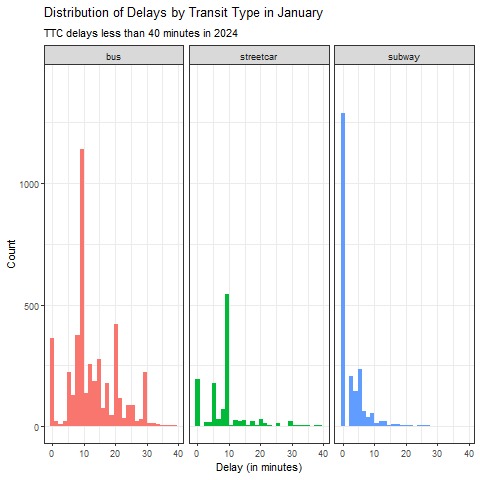
Distribution of delay durations by transport type
-
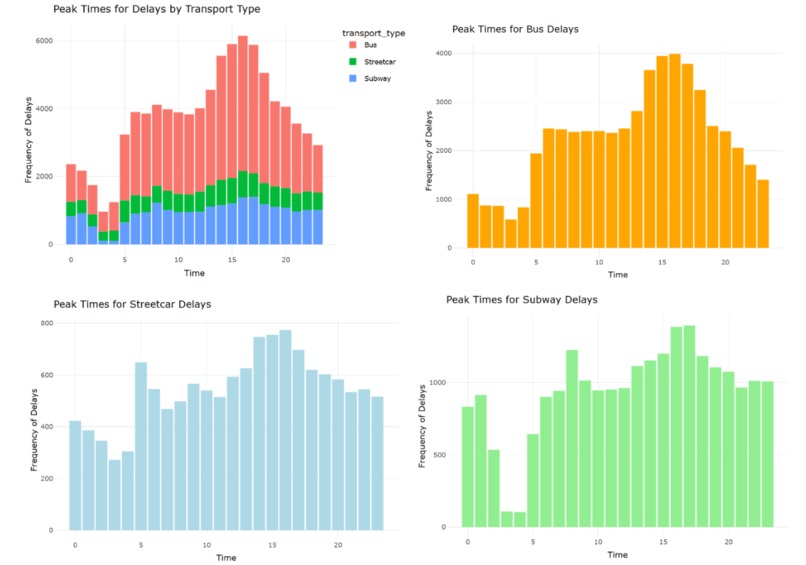
Peak times for delays by transport type
-

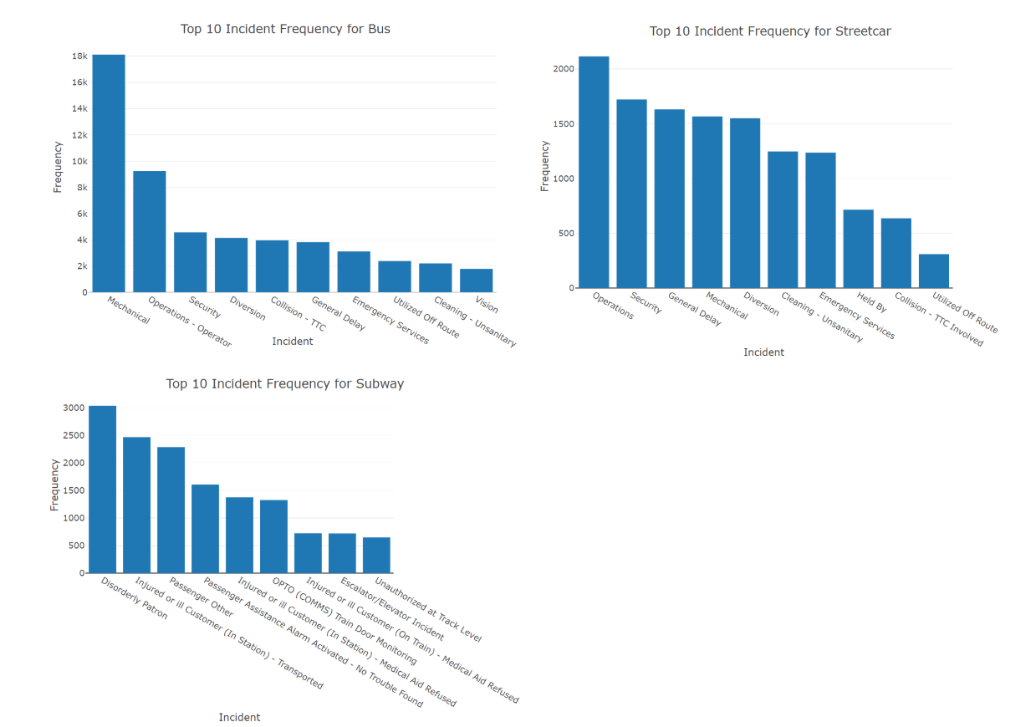
Top 10 most frequent incident types for each transport type
-
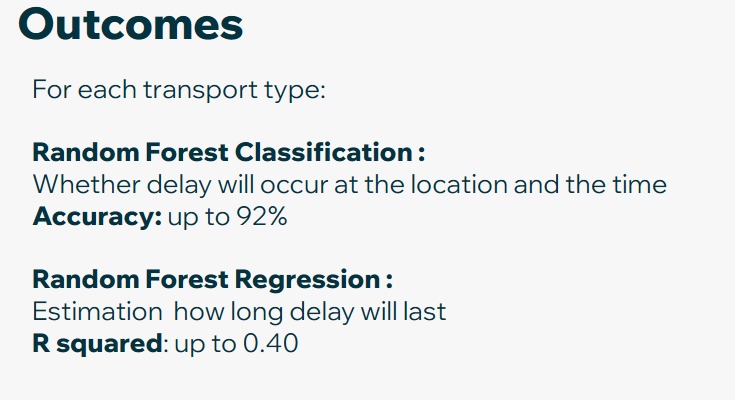
Outcomes of random forest models for each transport type
-
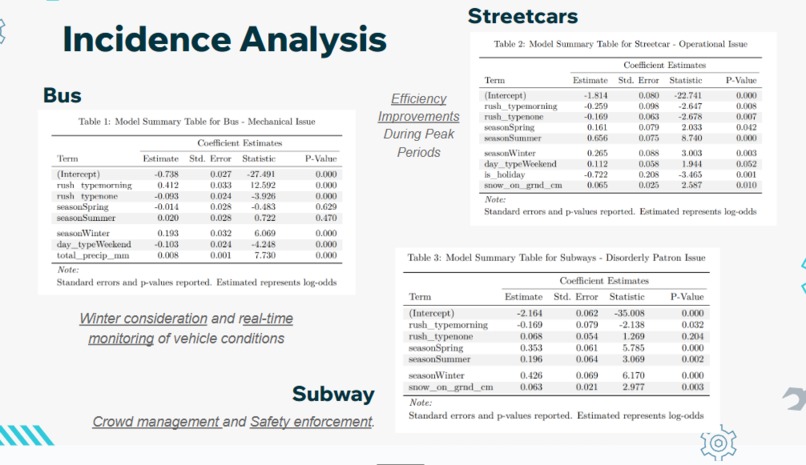
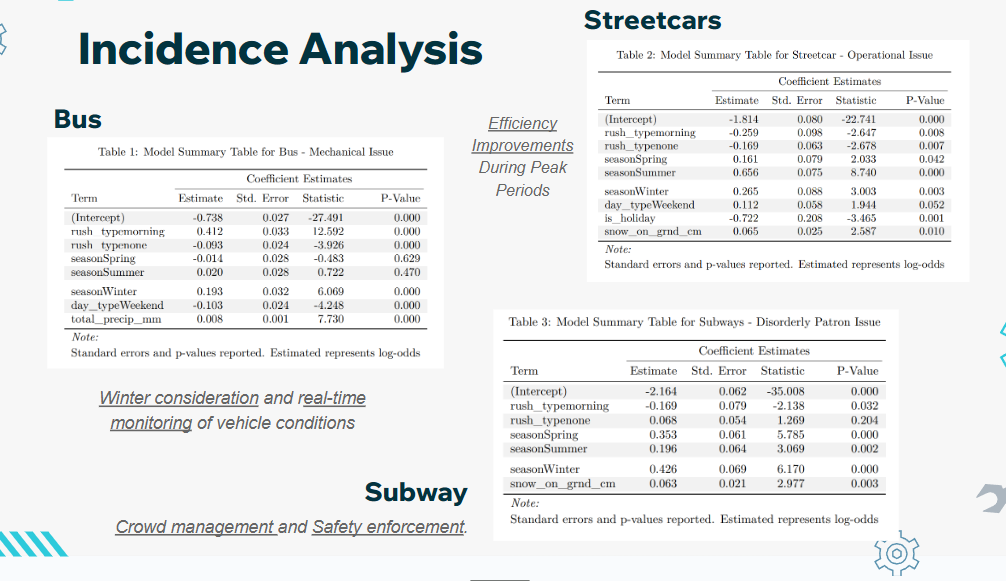
Logistic models show that rush hours, seasons, and weather impact transit delay, with winter and rush hour increasing delay


Inspiration
Our inspiration for this project came from the daily frustrations many Toronto residents face with delays in the TTC system. With public transportation being a vital service, the unpredictability of delays affects thousands of commuters, leading to dissatisfaction and inconvenience. We wanted to investigate whether machine learning models could help predict these delays and provide insights for the TTC to improve service reliability.
What it does
The project involves analyzing historical data on TTC delays and weather patterns to predict when and where delays are most likely to occur. Using machine learning, we built models for buses, streetcars, and subway systems to provide insights into how external factors like weather, time of day, and other variables influence delays. The goal is to help the TTC optimize its scheduling, maintenance, and incident response strategies by anticipating delays in advance.
How we built it
We gathered historical TTC delay data and external weather data from sources like Environment and Climate Change Canada. After cleaning and preprocessing the data, we created features representing time-based attributes, weather conditions, and other factors. We used Random Forest classifiers to predict the occurrence of delays, and further explored insights such as the most frequent causes of delays and peak times for each transportation type.
Challenges we ran into
One of the key challenges was dealing with incomplete or inaccurate data, especially with weather measurements that were recorded from a single location in Toronto and the names of subway stations (a lot of mispelt names!). Another challenge was tuning the models to achieve good performance across all transportation types, as buses, streetcars, and subways have distinct delay patterns.
Accomplishments that we're proud of
We’re proud of the high accuracy achieved by our models—up to 92% for predicting delay occurrences across different transportation types. Additionally, our exploratory analysis revealed important insights about the geographic hotspots for delays, the top causes for each transport mode, and the influence of weather on delay occurrences.
What we learned
We learned that different transport types experience delays for distinct reasons, and that seasonality and weather have a considerable impact on the frequency and duration of delays. We also gained valuable experience in cleaning and processing real-world datasets, as well as building and evaluating machine learning models.
What's next for Modelling TTC Delays in Buses, Streetcars, and the Subway
In the future, we aim to improve our models by incorporating more granular weather data and exploring additional machine learning techniques like gradient boosting. We also plan to build an interactive dashboard that can visualize real-time predictions and help TTC operators make data-driven decisions to reduce delays.
Built With
- esri
- gganimate
- ggplot
- googlecolab
- plotly
- python
- r
- scikit-learn


Log in or sign up for Devpost to join the conversation.