-
-

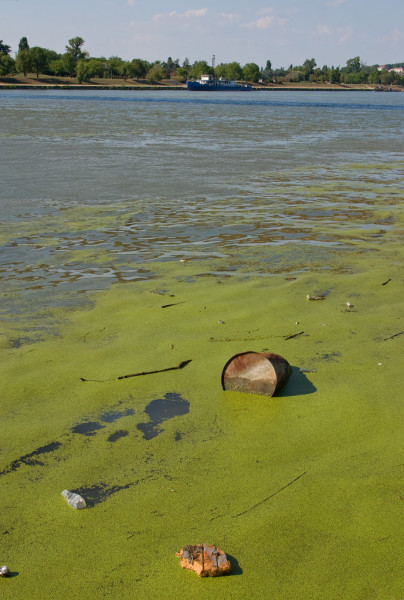
Harmful Algal Bloom - the effects of phosphorus pollution
Inspiration
Harmful algal blooms are on the radar of state agencies and local communities alike. From producing toxins harmful to humans and aquatic animals, through forming a thick mat that prevents sunlight from reaching the lower layers, to depleting the oxygen levels needed by aquatic organisms to survive, the rapid growth of algae signify an alarming level of water pollution. But the process, called eutrophication, starts way before we can see algae bloom on the water surface. Eutrophication in modern-day societies is sped up by land-use practices that lead to excessive amounts of nutrients entering the water body and thus causing a growth spurt in first the plant (such as algae), then the animal population. In this process, phosphorus as a key nutrient plays an important role both in producing and in controlling algae blooms. Phosphates are essential to cell reproduction. This means, that the plant population can only grow to the extent supported by the amount of phosphates in the water, regardless of the availability of other nutrients. While, therefore, a high level of phosphorus stimulates rapid algae growth, controlling the level of phosphorus in the water helps maintain a healthy aquatic ecosystem.
What it does
The first step towards controlling the total phosphorus amount in the water body is to monitor when levels are reaching a critical point. Our model predicts total phosphorus from measured levels of:
- active chlorophyll
- dissolved oxygen
- ammonium nitrogen
- nitrate nitrogen
- PH, corrected for temperature
- orthophosphate phosphorus
- salinity
- turbidity (Secchi depth)
- total alkalinity
- total dissolved solids
- total Kjeldahl nitrogen
- total nitrogen
- total suspended solids
- turbidity (nephelometric method)
- water temperature
as three distinct categories: 1) healthy amount, 2) increased amount that stimulates plant growth, and 3) problematic amount that projects unhealthy algae blooms
in the Chesapeake Watershed.
Code
First, we built a random forest classifier model to predict the phosphorus levels on the Potomac River from the feature parameters. The testing and cross-validated accuracy were 97%.
Next, we extended the model to include the entire Chesapeake Watershed. The testing and cross-validated accuracy held at 97%, suggesting that the model scales well and generalizes well.
Last, we experimented with predicting chlorophyll (as a proxy for algal bloom) from all other parameters on the Potomac River with using the RandomForestRegressor algorithm of the sklearn library. In theory, changes in the chlorophyll level do not follow the change in nutrient levels immediately. For this reason, we selected only those data points that contained measurements from consecutive days. Then, we shifted observed chlorophyll values back in time by 1 day, 3 days, and 7 days. This meant to assure that the model predicts chlorophyll levels in 1 day, 3 days and 7 days in the future. So far, the model evaluation metrics do not look promising. The cross-validated R-squared score consistently stays below zero, suggesting that the model, as it is, explains less from the variability in the chlorophyll level, than the mean level of chlorophyll.
Challenges we ran into
The most challenging part of building the model was dealing with the lack of consistency in data collection, the missing values, and cleaning and merging datasets, as well as the lack of subject matter expertise.
What’s next for Modeling Toxic Phosphorus Levels in the Chesapeake Watershed
- Incorporate data sets with more features (such as benthic data and weather data).
- Try a neural net classifier.


Log in or sign up for Devpost to join the conversation.