Inspiration
Since awareness on COVID-19 began growing in Europe, several datasets have been published as open for users to make analysis, create platforms and interactive maps. Examples of this effort can be seen in many national open data portals across Europe. In particular, we focused our attention on the datasets provided and constantly updated by the Italian Civil Protection, which release information on the epidemic in machine-readable format through the official GitHub repository. This dataset is structured in several breakdowns, including national, regional and provincial level, for both historical and current data. We wanted to create a tool able to model the data, predict the end of the epidemic on a regional level, and show the outcomes in an user-friendly web-mapping interface.
What it does
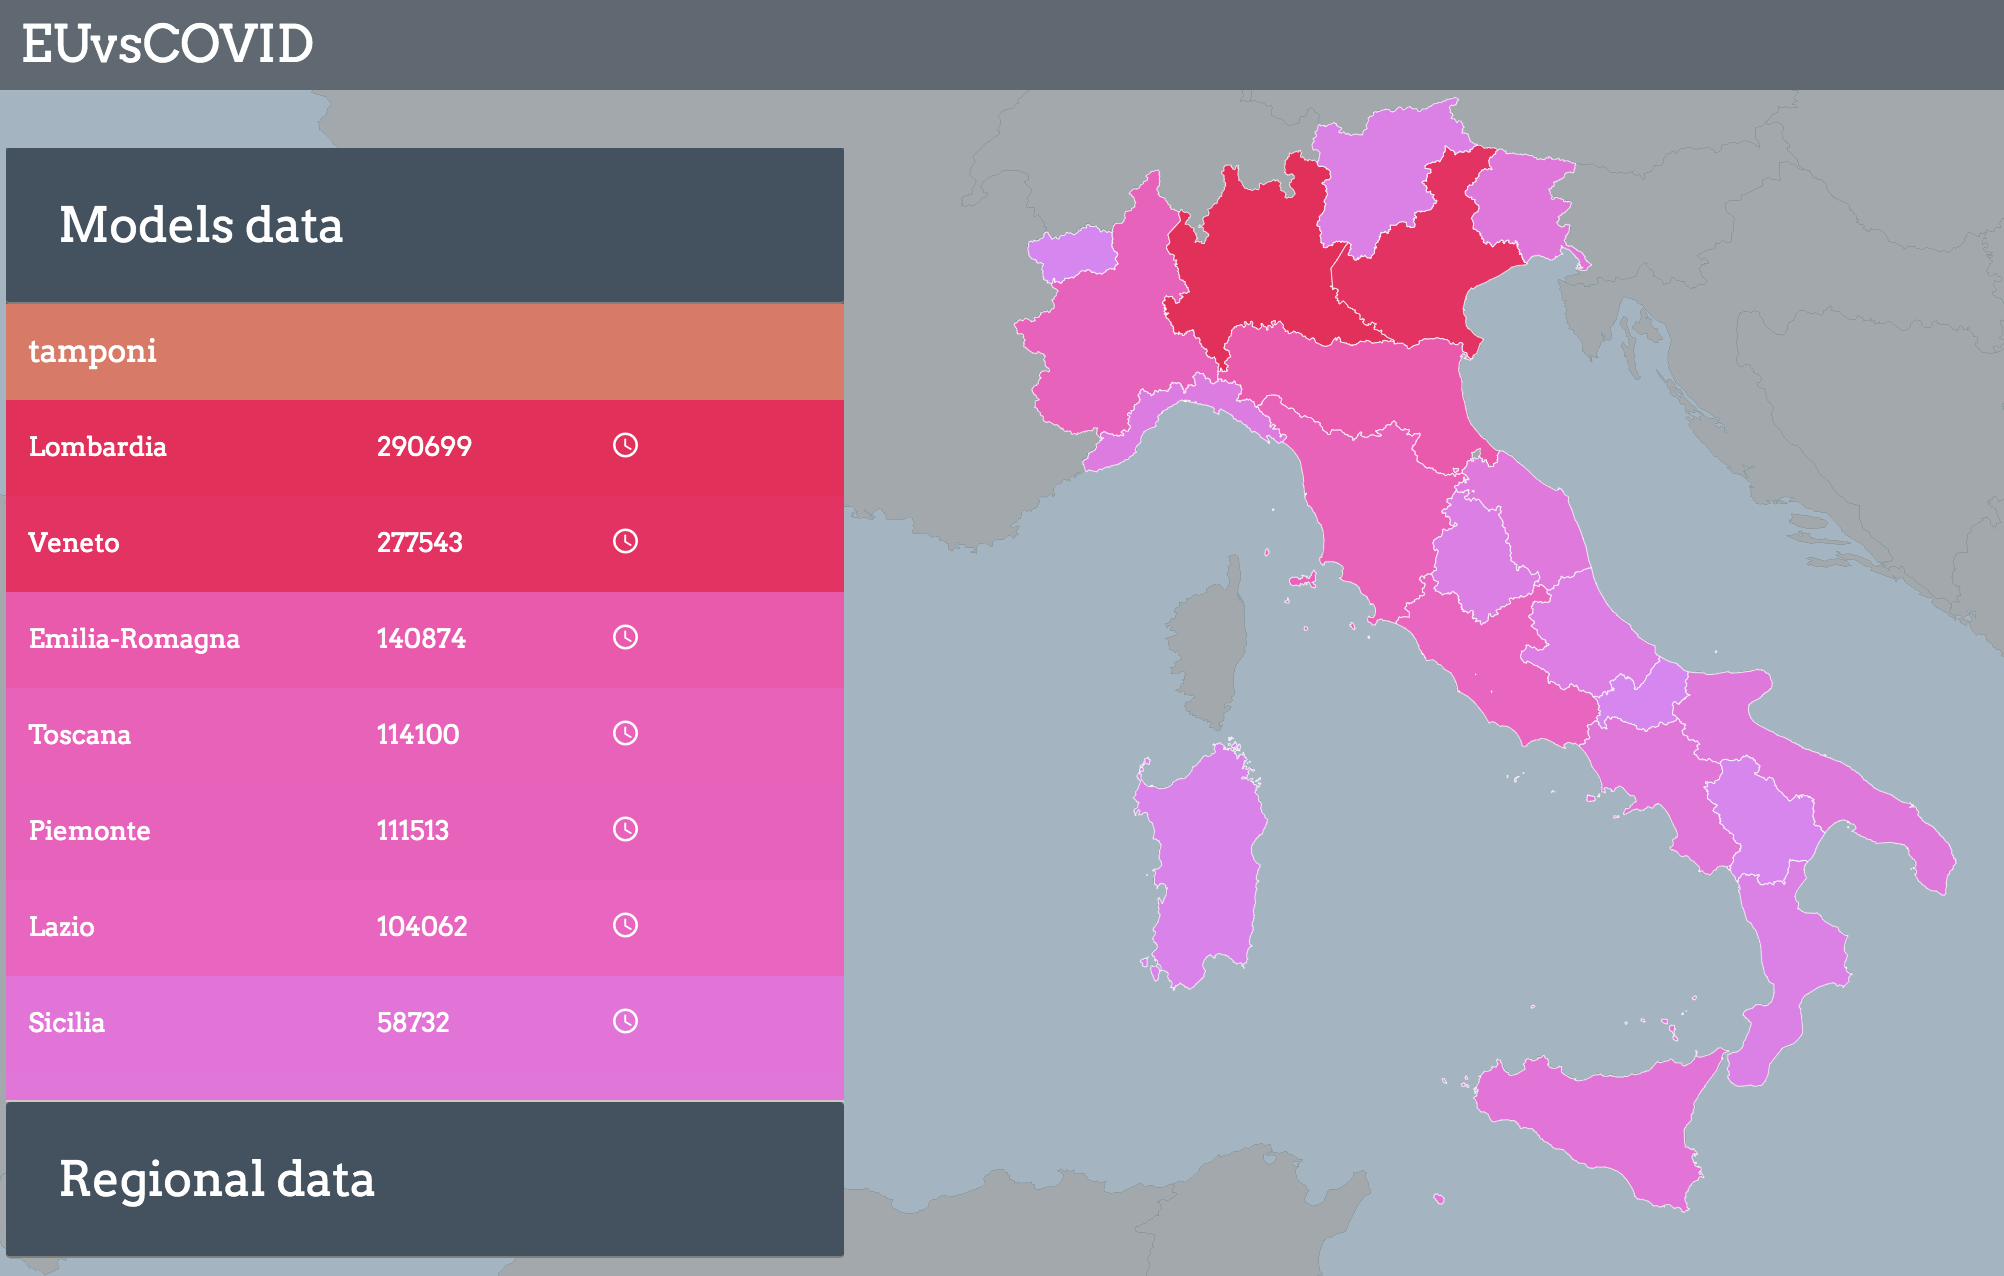
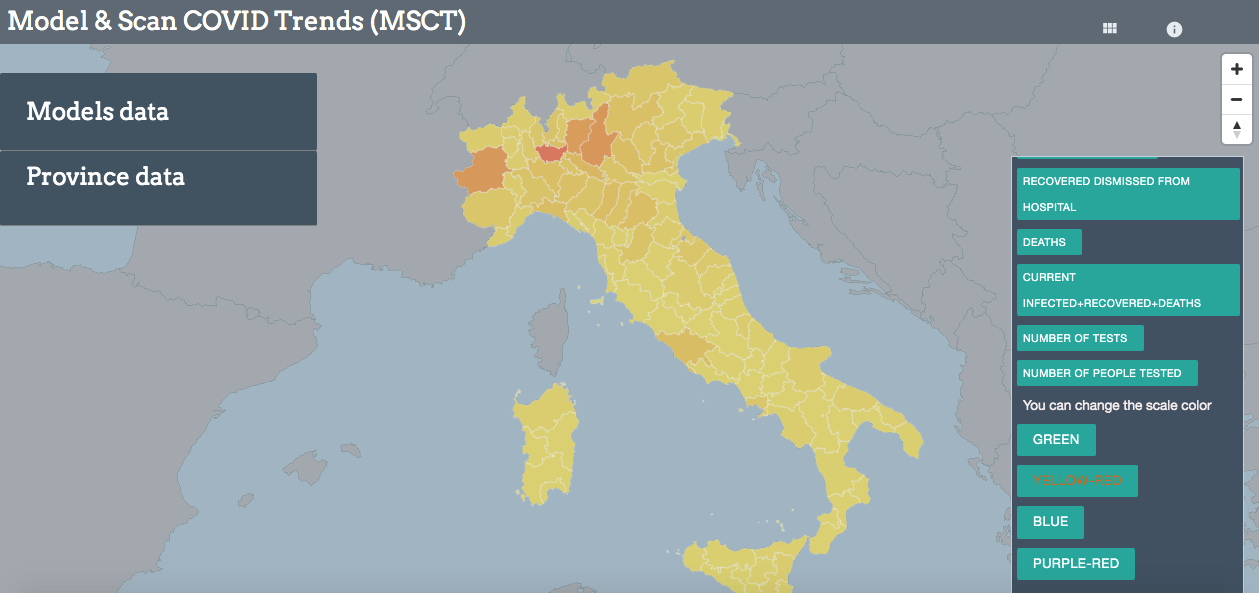
MSCT is able to model COVID-19 epidemic and predict the end of the most severe phase of the epidemic for each Italian Region. MSCT is constantly adjusting the estimations by incorporating daily updates in the model, and the outcomes are presented in an intuitive and user-friendly web-mapping interface.
How we built it
We calculated a derived variable called Epidemic Indicator, given by the sum of the number of patients in Intensive Care Unit (ICU) with the number of daily deaths. We noticed that this variable follows a regular descending trend, after the peak registered on April 1st. In fact, it is an easily measurable information which doesn't suffer from sampling methodology or weekly fluctuations. It is certainly not perfect since it can also be prone to underestimation, mostly during the acute peak of the crisis where the health system was stressed and hospitals saturated. But after that critical phase, the Epidemic Indicator should reflect pretty well the number of patients that are affected most severely by the virus. The main assumption of our analysis is that Epidemic Indicator can be a reliable variable for estimating the current epidemic progression and for modeling future trends. In fact, after April 1st this variable is decreasing at a constant rate. For this reason, we can model the future trend of the Epidemic Indicator using Linear Regression, one of the most popular classical Machine Learning algorithms for supervised learning. This algorithm is relatively easy to implement and works well when the relationship between covariates and response variable is known to be linear (in our case: Epidemic Indicator VS time). A known disadvantage is that Linear Regression over simplifies many real world problems. We separated the dataset in 20 regional subsets. Then, we created and trained a Linear Regression Model for each region. Trained models are then used for predicting the end of the epidemic, expressed by the number of days remaining before Epidemic Indicator is expected to be 0. Of course, not all regional models performed the same. Some regions have clear recovering trends (i.e. Lombardia), while others seem to have a less linear evolution (i.e. Lombardia). For this reason, every model also returns a performance score, the coefficient of determination R² of the prediction. An R² of 1 indicates that the regression predictions perfectly fit the data. therefore the closer the value gets to 1, the more we can trust our model and its predictions.
The results from the modeling process are visualized on an interactive web-mapping application, allowing to visualize the information in form of dynamic maps, tables with associated information and charts.
More technical information about the model can be found at https://github.com/Andrampa/covid_analysis/blob/master/Modeling_COVID19_epidemic_regional_breakdown.ipynb
Accomplishments that we are proud of
Excelent coordination. Technically innovative (smooth map transition using D3.js on Mapboxgl)
What I learned
Nice visualizations are important, but much more if the incoming data is good :.)
What's next for Model&Scan COVID trend
We plan to extend the project to other countries that are providing COVID dataset on a machine-readable format, such as Spain and France, and to keep improving the model with new data disseminated daily.
Built With
- charts
- css
- d3.js
- geographic
- gis
- html
- javascript
- mapboxgl
- numpy
- pandas
- python
- scikit-learn
- statistic



Log in or sign up for Devpost to join the conversation.