-
-

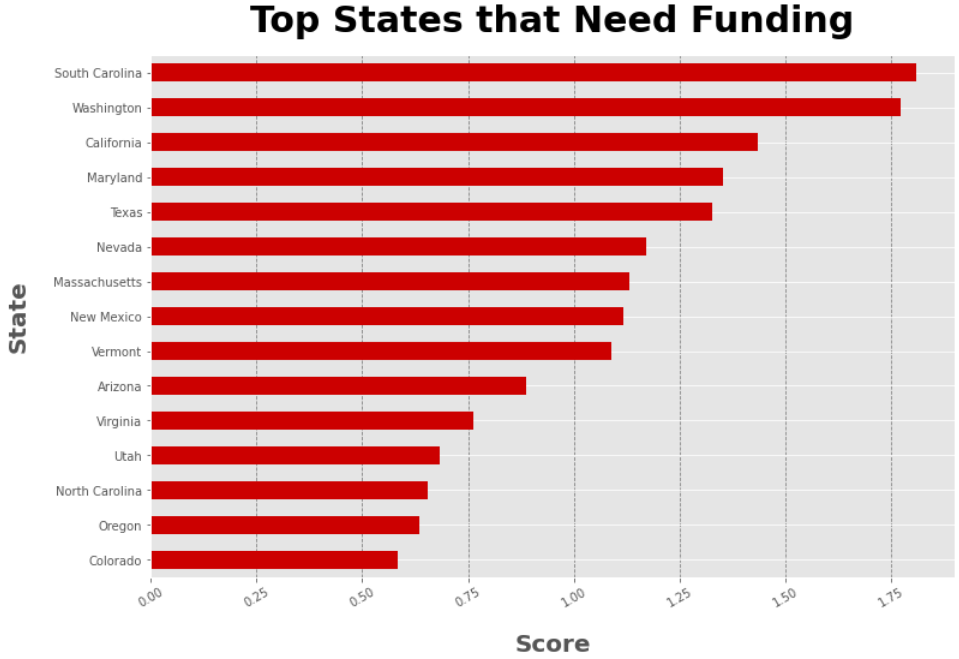
Top States Suggested for Funding
-
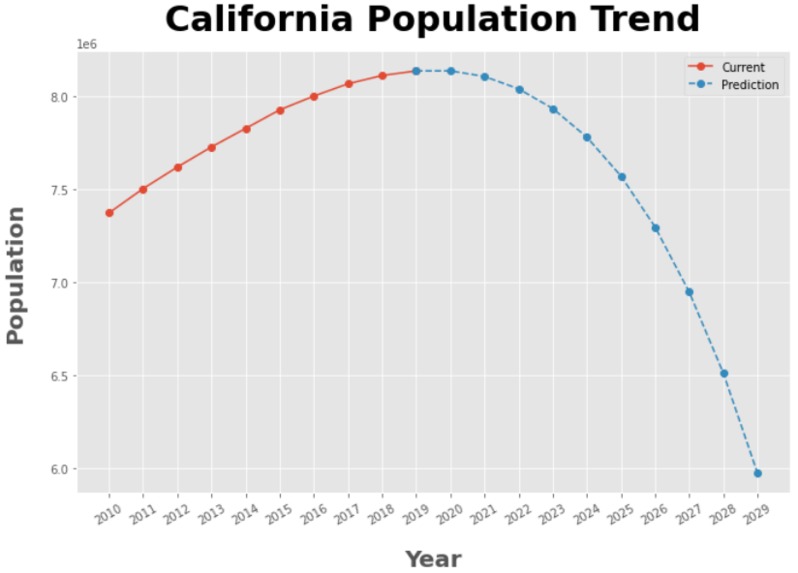
California Population Trend

Inspiration
The inspiration behind our project was to find a way that we could help out the FDA by analyzing locations that would be the most beneficial to allocate the international grant funds towards. We want to make sure that we are noticing the most underrepresented states that lack the necessary resources and training, as well as population migrations patterns in order to target the largest amount of people we can in the future.
What it does
Our project creates several visualizations that allows the FDA to see where their allocations of funds would be the most beneficial and impactful for the nation. In our code we ensured that the data was cleaned and usable and utilized it to compare the ratio of people per facilities as well as visualizing future population growth for the various states in order to approach a long term investment strategy.
How we built it
We built the various models using numerous python libraries. These include pandas, Matplotlib, Plotly, and an Auto Regression Statistics Model (AR). We used Plotly for the heat maps of people per facility, and we used Matplotlib and AR to plot future predictions in population migrations. We also used pandas to clean the data initially in order to ensure we are using concise, meaningful data.
Challenges we ran into
Some of the main challenges were just formatting data to match the needs we required out of it. For example, the data initially provided was a major hurdle, for we had to shift several columns in order for all the rows to line up. In addition, we also had to remove information, such as US territories that weren't required for analysis.
Accomplishments that we're proud of
The visualizations and cleaning up data were some of our proudest accomplishments. A lot of the content was relatively new, and had to be learned on the fly. Overall, our team dynamic and good spirit kept us going even when there were many challenges ahead of us at the time.
What we learned
We learned that there are many different libraries that can help us visualize certain specialized traits of what we were looking for. We also learned a little bit of the basics for machine learning, as well as found out firsthand what some of the main struggles are when it comes down to providing meaningful data. Overall, we learned that as long as we were consistent with searching for the truth, it would eventually come to us. This was the first datathon for everyone on our team, and this experience was absolutely like none other compared to the day-to-day classroom.
What's next for Mobilizing Mammograms
Some ideas for Mobilizing Mammograms would be to start looking into select states and finding districts or areas where there are still underrepresented areas. Although in the analysis we uncovered the represented facilities by state, we still could dive further through zip codes or even down to addresses. In addition, if a budget were given we could also create an optimal way to allocate funds for the costs of providing these resources in the facilities. In addition, after pragmatic implementation of these processes we can continue monitoring the progress of how significant the grant fund was for these areas in need.

Log in or sign up for Devpost to join the conversation.